 2024, Vol. 45


2. 陕西省环境监测中心站, 陕西省环境介质痕量污染物监测预警重点实验室, 西安 710054;
3. 渭南市环境保护监测站, 渭南 714000
2. Shaanxi Key Laboratory for Environmental Monitoring and Forewarning of Trace Pollutants, Shaanxi Provincial Environmental Monitoring Center Station, Xi'an 710054, China;
3. Weinan Environmental Protection Monitoring Sation, Weinan 714000, China
碳质气溶胶是大气气溶胶中的重要成分, 在PM2.5颗粒物组分的占比通常为20%~50%[1, 2], 主要由有机碳(organic carbon, OC)、元素碳(element carbon, EC)组成, 有机碳和元素碳之和为总碳(TC). EC来自交通、供暖、工业和使用重油、煤或生物燃料能源生产的有机物质的不完全燃烧, 主要为一次排放源[3, 4]. OC除了由矿物、粉尘、化石燃料燃烧和生物质燃烧等直接产生外, 还可在前体气体转化成颗粒物的过程中产生, 因此OC可分为一次有机碳(primary organic carbon, POC)和二次有机碳(secondary organic carbon, SOC)[5 ~ 7]. 除污染物排放和二次气溶胶形成, 气象条件下的干湿沉降和大气扩散也是碳质气溶胶污染的影响因素[8, 9].
碳质气溶胶的吸光性质和致癌性、致突变性化学组分, 如多环芳烃和多氯联苯, 使其在环境健康和全球气候变化中产生较大影响[10, 11]. 国内外针对大气中碳质气溶胶的浓度分布和转化机制已取得一定研究成果. Liu等[12]总结了2012~2021年中国生物质燃烧产生的碳质气体和气溶胶排放清单, OC和EC在含碳气体和含碳气溶胶中占0.3%, 年均排放量以包括北京和天津等地区在内的北方地区最高(239.74 Mt), 以包括陕西和甘肃在内的西北地区碳排放量最低(15.58 Mt). Dong等[13]分析了中国污染城市郑州在COVID-19暴发前和管控期的气溶胶碳质组分, 发现OC和EC浓度分别下降4%和32%, EC组分急剧下降, 表明交通排放源的贡献减少. Wang等[14]报告了2016~2020年中国特大城市上海碳质气溶胶的年际和季节变化, 发现EC在5年间呈下降趋势, 而OC在2018年才开始下降. 彭超等[15]分析了重庆3个典型城区冬季的碳质气溶胶的污染特征、排放源及潜在源区, 发现重庆主城区碳质气溶胶受SOC影响呈周边城区高于中心城区的分布趋势. 李立伟等[16]的研究表明, 京津翼地区OC和EC浓度呈:保定 > 石家庄 > 沧州 > 天津 > 北京的空间分布特点和夏 < 春 < 秋 < 冬的季节变化特点.
近年来随着大气污染专项治理的推进, 关中平原人为排放有所减少, 但不利的天气模式、地形和二次气溶胶生成使关中平原仍是大气污染高发区域. 田鹏山等[17]分析了西安、宝鸡、渭南和秦岭冬季的OC和EC, 发现宝鸡的SOC/OC值最高, 且燃煤是关中地区冬季碳气溶胶的首要来源. 康宝荣等[18]分析关中地区5个主要典型城市秋冬的碳组分特征, 发现碳组分占比的空间分布为咸阳 > 渭南 > 西安 > 宝鸡 > 铜川, 且冬季占比高于秋季;OC与EC的相关性显著, 表明关中地区有着较为相同的污染来源. Feng等[19]利用WRF-CHEM模式模拟了关中平原有机气溶胶浓度、人为排放的贡献率, 评估了大气氧化能力变化对SOA的影响. 目前对关中平原的碳质气溶胶污染和来源研究主要集中在区域主要城市的年际或季节变化特征上. 本研究通过对比关中平原五城市2023年春节前后PM2.5中碳质气溶胶的时空变化以及二次转化情况, 结合污染气体和气象要素, 分析传统节日期间人类生产生活排放对关中平原大气污染的影响, 对区域大气碳组分污染防治有重要意义.
1 材料与方法 1.1 采样地点关中平原位于陕西省中部(图 1), 南接秦岭, 北靠黄土高原, 平均海拔500 m, 呈东西走向的口袋状, 包含了关中平原城市群的中心城市和重要节点城市:西安、宝鸡、咸阳、渭南和铜川. 5个城市占省总人口的65.2%, 是陕西省人口和工业发展最集中的区域. 每个城市各设置一个采样点, 表 1为采样点信息, 各站点周边分布有住宅区、生活区、交通线和工业, 能够反映春节前后当地人类活动对大气污染的影响.

|
(a)地形高程, 黑色箭头为风向, 高程数据来源于地理空间数据云(https://www.gscloud.cn/#page1/4);(b)人口密度, 数据来源于WorldPop(https://hub.worldpop.org/project/categories?id=18) 图 1 区域概况示意 Fig. 1 Regional overview shown |
|
|
表 1 采样点信息 Table 1 Sampling site information |
1.2 样品与数据
本研究采用美国Sunset Model 4/OCEC(RT-4)有机碳元素碳分析仪在线监测PM2.5中的碳质组分. 通过美国职业安全与卫生研究所(National Institute for Occupational Safety and Health, NIOSH)认定的热学/光学方法测定石英滤膜上样品所负载的OC和EC, TC为对应OC与EC之和, 测量范围为0.2~200 μg·m-3, OC和EC的最低检测限(按1h计)分别为0.4 μg·m-3和0.2 μg·m-3. 仪器测定碳质气溶胶的两个加热阶段炉温均为850℃. 第一阶段加热使OC挥发或碳化;第二阶段加热使EC在氧化环境下被分解为气态氧化物. 两阶段获得的OC和EC在非色散红外检测器(nondispersive infrared defector, NDIR)处定量, 并通过监测激光强度的变化对OC和EC进行分割. 热分解导致的误差通过EC的光吸收特性来校正, 并通过蔗糖溶液和空白对比等方法对仪器进行定期校准, 保证仪器的正常运行和数据的准确性. 最终测得OC和EC有效数据2 092组, 各站点数据在P < 0.01级别显著相关.
SO2、NO2、CO和O3等气体数据来自全国城市空气质量实时发布平台(https://www.cnemc.cn/sssj)的同期各国控站点. 气象5参数(富奥通科技北京有限公司, FWS500)包括:2 m气温(℃)、10 m风速(m·s-1)、10 m风向(rad)、1 h降水量(mm)和相对湿度(%). 后向轨迹聚类所需的气象场数据来源于美国国家环境预报中心(National Center for Environmental Prediction, NCEP)提供的GDAS气象数据(https://www.ready.noaa.gov/data/archives/gdas1/).
1.3 研究方法 1.3.1 反距离加权空间插值法(IDW)IDW以样本点实测值加权决定估算值, 待插点和实测点之间的距离为权重, 权重贡献与距离成反比[20], 其计算公式为:
|
(1) |
式中, Z(x0)为x0处的预测值;Z(xi)为xi处的观测值;n为实测站点数;di0为预测点x0与各实测点xi间的距离;p为距离的幂次数, 这里取默认值2[21].
1.3.2 最小相关系数法(MRS)本研究以化学性质稳定的EC作为直接排放产生的POC的示踪剂, 采用最小相关系数法(MRS)估算二次有机碳(SOC)浓度[22, 23]. 该方法中(OC/EC)pri_h是连续变化的假想值, 通过(OC/EC)pri_h算出对应的假想SOCh和EC与SOCh的相关性系数(R2). 以最小R2对应的OC/EC值为MRS得出的一次比值, 即(OC/EC)pri_MRS. 为减少排放源、气象条件变化等因素的影响, 本研究根据春节前后不同阶段的(OC/EC)pri_MRS对SOC进行估算. SOC的估算公式为:
|
(2) |
|
(3) |
式中, (OC/EC)pri为一次燃烧源排放的OC与EC的比值, MRS中的扫描范围为0~20. 结果显示春节前、春节期间和春节后的(OC/EC)pri_MRS分别为6.41、10.42和7.49.
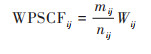
1.3.3 潜在源贡献函数分析(PSCF)利用美国国家海洋和大气管理局(NOAA)空气资源实验室(ARL)研发的HYSPLIT轨迹模型及TrajStat软件对观测期间碳质气溶胶进行潜在源区研究[24 ~ 26], 使用GDAS气象数据对关中平原研究期间的气流来源进行48 h后向轨迹反演, 模式运行时间间隔为6 h(00:00、06:00、12:00和18:00), 距地面高度500 m. 本研究基于后向轨迹模拟的结果创建覆盖整个研究区域的矩形网格(i, j), 并以碳质气溶胶浓度均值为阈值, 碳质气溶胶浓度超过阈值的轨迹即为污染轨迹. PSCF的计算公式为:
|
(4) |
|
(5) |
|
(6) |
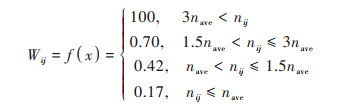
式中, mij为经过某一网格(i, j)的气流轨迹端点数;nij为落在网格内的所有气流轨迹端点数;Wij为权重系数, 用于降低条件概率函数因样本总量较小和各网格内气流滞留时间较短而产生的误差影响;nave为每个网格的平均轨迹端点数.
2 结果与讨论 2.1 OC和EC的时间变化特征本研究期分为春节前(2023年1月14~20日)、春节期间(2023年1月21~27日)和春节后(2023年1月28~31日). 本研究期间关中平原ρ(PM2.5)、ρ(OC)和ρ(EC)平均值分别为(68.2 ± 56.6)、(14.4 ± 10.5)和(1.7 ± 1.1)μg·m-3, OC和EC在PM2.5中的占比分别为20%和2.5%, OC为主要碳质气溶胶. ρ(PM2.5)表现为:春节期间[(80.3 ± 78.0)μg·m-3] > 春节后[(70.7 ± 37.9)μg·m-3] > 春节前[(50.0 ± 31.2)μg·m-3], ρ(OC)表现为:春节后[(18.6 ± 11.0)μg·m-3] > 春节期间[(16.2 ± 15.1)μg·m-3] > 春节前[(10.0 ± 8.3)μg·m-3], ρ(EC)表现为:春节后[(2.2 ± 1.2)μg·m-3] > 春节期间[(1.7 ± 1.5)μg·m-3] > 春节前[(1.4 ± 1.1)μg·m-3]. PM2.5浓度在春节期间最高, OC和EC浓度在春节后最高. TC在PM2.5中的占比为:春节后(28.1%) > 春节前(21.8%) > 春节期间(20.1%), 此外, 在1月22日关中平原PM2.5达到重度污染[ρ(PM2.5) > 200 μg·m-3]水平时, 其TC仅占PM2.5的18%, 说明OC和EC浓度会随着PM2.5浓度的增加而增加, 但在PM2.5中的比例会下降, 这可能是由于污染加重导致PM2.5中SO42-、NO3-和粉尘等成分的比例增加[27].
图 2中, 5个城市PM2.5的时间变化趋势均为“中间高, 两边低”, OC和EC总体呈上升趋势. OC和EC的上升分两个阶段, 春节前到春节期间为第一阶段, 春节期间到春节后为第二阶段. 第一阶段OC和EC的增长幅度为65.0%和27.8%, 第二阶段OC和EC的增长幅度为14.6%和24.3%, OC和EC第一阶段增速比第二阶段增速分别多50.4和3.5个百分点. 5个城市PM2.5和OC峰值均出现在1月22日(初一), EC峰值除西安在1月21日(除夕), 其他城市也均在1月22日, 整个关中平原这两天的PM2.5、OC和EC浓度平均值分别为研究期浓度平均值的3.0、2.8和1.9倍. 低值出现在春节前的1月14~15日以及春节期间的1月24~25日, 可能是由于这几天的平均风速较高(2.9 m·s-1)不利于污染物的积累. 因此春节期间的PM2.5和碳质气溶胶污染主要是受除夕和初一这两天的影响.

|
图 2 2023年PM2.5和碳质气溶胶时间序列 Fig. 2 PM2.5 and carbonaceous aerosol time series in 2023 |
可用不同的OC/EC值范围代表不同的污染来源, 且OC/EC > 2.0时可认为OC存在二次转化[28]. 参考已有研究[29 ~ 31]:机动车排放源的OC/EC值为2.5~5.0;工业排放源中的OC/EC值为3.5~5.5;燃煤排放为2.5~10.5;生物质燃烧排放为12.7~40.0. 关中平原OC/EC值表现为:春节期间(10.5 ± 6.6) > 春节后(9 ± 3.6) > 春节前(8 ± 4.2), 说明关中平原在研究期间受到燃煤、机动车、工业和生物质燃烧排放的共同影响, 春节期间受生物质燃烧的影响可能性更大, 且有明显的二次转化.
图 3为5个城市的OC和EC在除夕和初一的小时污染情况, OC和EC峰值出现时间一致, 西安、宝鸡、咸阳、渭南和铜川的OC和EC峰值时间分别为:1月22日11:00、1月22日9:00、1月22日6:00、1月22日9:00、1月21日22:00;峰值浓度(μg·m-3)分别为:70.8和4.8、155.8和7.6、82.5和5.5、57.1和8.3、56.1和7.9. 在各城市的禁燃政策中, 咸阳全面禁燃, 其他城市划定了限燃区, 本研究采样点均在禁燃区内, 但也不排除周围农村和限燃地区烟花燃放的影响. 铜川峰值出现在除夕夜晚, 说明铜川除夕夜受烟花爆竹燃放的影响最大;其他城市峰值出现在初一上午, 这可能与初一出行、节庆活动产生的一次排放有关[32, 33].

|
图 3 除夕和初一的OC和EC变化 Fig. 3 Changes in OC and EC on Chinese New Year's Eve and the first day of the Spring Festival |
本研究期共18 d, 5个城市PM2.5浓度超过新《环境空气质量标准》(GB 3095-2012)规定的日均二级浓度限值(75 μg·m-3)的污染天数占比分别为47.6%、33.3%、14.3%、19.0%和9.5%. ρ(OC)表现为:咸阳[(21.4 ± 17.3)μg·m-3] > 宝鸡[(15.8 ± 12.8)μg·m-3] > 西安[(13.6 ± 11.3)μg·m-3] > 渭南[(11.6 ± 9.1)μg·m-3] > 铜川[(10.0 ± 8.3)μg·m-3]. ρ(EC)表现为:咸阳[(2.1 ± 1.4)μg·m-3] > 渭南[(1.8 ± 1.4)μg·m-3] > 西安[(1.8 ± 1.2)μg·m-3] > 铜川[(1.6 ± 1.4)μg·m-3] > 宝鸡[(1.2 ± 0.9)μg·m-3], 总体上咸阳的PM2.5和碳质气溶胶污染最严重, 铜川污染最轻.
反距离加权空间插值结果显示(图 4), PM2.5、OC和EC浓度的高值中心[ρ(PM2.5) > 102.3 μg·m-3, ρ(OC) > 27.3 μg·m-3, ρ(EC) > 2.9 μg·m-3)]在平原中部, 低值中心[ρ(PM2.5) < 43.7 μg·m-3, ρ(OC) < 7.0 μg·m-3, ρ(EC) < 1.0 μg·m-3)]在平原北部;东部ρ(OC)和ρ(EC)平均值为15.8 μg·m-3和1.2 μg·m-3, 西部ρ(OC)和ρ(EC)平均值为11.7 μg·m-3和1.7 μg·m-3, OC分布西高东低, EC分布东高西低. PM2.5的高值区域以中部咸阳为中心, 春节期间向东南扩展, 春节后范围继续扩大至西部宝鸡地区;OC分布在3个时期没有明显的方位转移;EC高值区域在春节期间扩散至整个东部, 春节后缩小至东南部.

|
图 4 PM2.5和碳质气溶胶的空间分布 Fig. 4 Spatial distribution of PM2.5 and carbonaceous aerosols |
如表 2所示, 对比已有的2018年和2012年相近研究时期的关中平原OC和EC研究, 本研究关中平原OC和EC的浓度有所下降, 而TC在PM2.5中的占比有所上升. 近年来陕西省实施的“铁腕治霾打赢蓝天保卫战三年行动”政策有效控制了细颗粒物、污染气体、氮氧化物和挥发性有机物的排放量, 本研究期间关中平原ρ(O3)、ρ(CO)、ρ(NO2)和ρ(SO2)的平均值分别为51.4 μg·m-3、0.6 mg·m-3、26.0 μg·m-3和10.2 μg·m-3, 均未超过新《环境空气质量标准》(GB 3095-2012)中的二级浓度限值. 一次排放减少, 说明TC在PM2.5中上升的部分很有可能为二次有机碳, 因此对二次气溶胶的控制已成为大气污染防治的重要环节[25].
|
|
表 2 不同地区PM2.5中碳质气溶胶的浓度水平比较/μg·m-3 Table 2 Comparison of carbonaceous aerosol concentrations in PM2.5 in different regions/μg·m-3 |
2.3 有机碳的二次转化情况
关中平原在研究期间的ρ(SOC)平均值为(6 ± 7.8)μg·m-3, ρ(POC)平均值为(8.1 ± 7.8)μg·m-3. ρ(POC)表现为:春节期间[(10.1 ± 9.3)μg·m-3] > 春节后[(8.9 ± 7.8)μg·m-3] > 春节前[(5.7 ± 5)μg·m-3];ρ(SOC)表现为:春节后[(9.6 ± 7.8)μg·m-3] > 春节期间[(5.9 ± 9.7)μg·m-3] > 春节前[(4 ± 4.3)μg·m-3]. 图 5中SOC在OC中的占比不断上升:春节后(51.7%) > 春节期间(41.1%) > 春节前(36.8%), 增长速度第二阶段(34.5%) > 第一阶段(29.6%), 春节前和春节期间的OC以POC为主, 春节后SOC增长速度加快并成为主要碳质气溶胶.

|
图 5 关中平原不同时期SOC和POC浓度对比 Fig. 5 Comparison of concentrations of SOC and POC in different periods in the Guanzhong Plain |
各城市SOC/OC大小表现为:铜川(60.6%) > 宝鸡(56.1%) > 咸阳(42.2%) > 渭南(36.7%) > 西安(27.9%). 春节前仅铜川SOC在OC中占比(59.3%)超过POC, 春节期间仅宝鸡SOC/OC上升至59.3%, 春节后铜川、咸阳和宝鸡的SOC/OC达到98.4%、79.8%和51.1%. 从图 6中可知不同时期5个城市的SOC在关中平原的贡献率, 总体上为:宝鸡(26.4%) > 咸阳(22.4%) > 铜川(18.6%) > 渭南(13.7%) > 西安(12.4%). 各城市SOC/OC大小和各地SOC在关中平原的贡献率大小表明, 宝鸡、咸阳和铜川受有机碳二次转化影响较大, 西安和渭南受一次排放影响较大.

|
图 6 不同时期5个城市的SOC贡献率 Fig. 6 SOC contribution rates of five cities in different periods |
图 7显示了3个时期碳质气溶胶与气象因子和污染气体的相关性. OC和EC的相关性在一定程度上能够判断二者是否有相同的一次来源[23, 29]. 关中平原春节前、春节期间和春节后的OC和EC的相关系数r分别为0.95、0.92和0.96, 表明研究期间关中平原OC和EC具有高度的同源性, 而春节期间OC和EC的来源情况相对复杂.

|
数字对应的碳质气溶胶、污染气体和气象因子分别为:1.PM2.5, 2.OC, 3.EC, 4.POC, 5.SOC, 6.O3, 7.SO2, 8.CO, 9.NO2, 10.湿度, 11.风速, 12.温度 图 7 碳质气溶胶与气象因子和污染气体的相关性分析 Fig. 7 Correlation analysis of carbonaceous aerosols with polluting gases and meteorological factors |
春节前, 关中平原碳质气溶胶与风速呈中度负相关(r > |0.4|);春节期间, 碳质气溶胶与湿度的相关性明显增强(r > |0.6|), EC与风速的相关性略有增强. 关中平原在研究期间降水量变化较小(0~0.003 mm), 平均温度大小为:春节后(1.3℃) > 春节前(-1.5℃) > 春节期间(-1.7℃);相对湿度大小为:春节前(43.7%) > 春节期间(33.9%) > 春节后(30.4%);平均风速大小为:春节前(2.1 m·s-1) > 春节期间(2.0 m·s-1) > 春节后(1.5 m·s-1), 说明春节期间各城市处于低温低风速和低湿度的不利于污染物扩散的气象条件, 加之较高的排放量, 一次和二次碳质气溶胶快速增长[44, 45];春节后碳质气溶胶各气象条件呈弱相关性, 说明春节后二次碳质气溶胶的增长主要依靠排放源.
EC和POC(一次碳质气溶胶)与CO和NO2的相关性在3个时期都较强, 春节后相关性最强(r > |0.8|);与SO2在春节期间相关性最强(r > |0.8|), 春节后相关性减弱(r < |0.7|);与O3在春节期间的相关性呈负强相关(r > |0.6|), 春节后相关性降至负弱相关. SOC与CO的相关性为递增状态, 春节后增至最强(r=|0.8|);与NO2相关性在春节期间最低(r=|0.5|), 在春节后最强(r=|0.8|);与SO2的相关性在春节期间最强(r=|0.7|);与O3仅在春节前呈负中度相关(r > |0.5|). 总体上, 一次和二次碳质气溶胶与CO、NO2有较强的相关性, 且在春节后相关性最强, 与SO2的相关性在春节期间最强.
图 8中, 春节前5个城市的CO、SO2和O3浓度在3个时期中最低. 春节期间各城市NO2浓度下降, 可能与工厂企业休假有关;CO浓度的上涨除了受节日出行和节庆活动影响, 还可能与湿度有关, 有研究表明相对湿度在30%~40%时CO浓度最高[46], 而关中平原春节期间的相对湿度范围为31.8%~40.5%;SO2浓度在春节期间的增加最可能与烟花排放有关. O3浓度在春节期间增加可能是受NO2浓度的降低使氮氧化物(NOx)对O3的滴定作用减小的影响[47, 48], 而O3增加可加速污染物的氧化促进二次有机碳的生成. 春节后各城市CO、NO2和SO2浓度增加, 说明交通移动、采暖、工厂复工以及风速减小增加了污染气体浓度.

|
图 8 关中平原不同时期的污染气体变化 Fig. 8 Changes in polluting gases in different periods in the Guanzhong Plain |
本研究期间, CO浓度大小为:咸阳 > 西安 > 渭南 > 宝鸡 > 铜川;NO2浓度大小为:渭南 > 咸阳 > 西安 > 宝鸡 > 铜川;SO2浓度大小为:铜川 > 渭南 > 西安 > 咸阳 > 宝鸡;O3浓度大小为:铜川 > 咸阳 > 宝鸡 > 渭南 > 西安. 这表明人口较多的西安、咸阳和渭南的机动车、采暖和工业排放较大, 而铜川、宝鸡和咸阳OC的二次转化, 特别是春节期间, 很有可能受到O3氧化作用的影响. 此外, 咸阳碳质气溶胶的一次来源和二次转化均较高, 除自身排放外还可能受到宝鸡和西安的污染传输影响. 宝鸡为河谷型城市且风速低(0.9 m·s-1), 碳质气溶胶更容易积累并发生二次转化. 铜川人口最少污染最小, 但偏南风会带来周边渭南、西安和咸阳的污染排放, 如铜川站点东南方向的渭南陶瓷、装修材料工业容易产生大量挥发性有机化合物(VOCs)[49], 它是造成大气中臭氧等污染物浓度增加以及向二次有机颗粒物转化的重要前体物[50, 51].
2.5 潜在源贡献函数分析(PSCF)在后向轨迹的基础上, 以各城市不同时期的OC和EC浓度平均值为阈值进行WPSCF演算, WPSCF值域在0.1~1. 由图 9和图 10可知, 总体而言, 关中平原碳质气溶胶的潜在源区自春节前到春节后有从平原西北向平原南部转移的趋势, 5个城市碳质气溶胶不仅受到本地和周边区域的影响, 也受到远距离运输的影响, 周边区域污染主要集中在甘肃南部、陕北以及陕南地区. 春节前关中平原各城市碳质气溶胶的WPSCF高值中心(WPSCF > 0.8)主要分布在城市本地、关中平原西北部与甘肃的交界处以及甘肃南部, 碳质气溶胶受长距离外来输送影响较大, 输送源自西北高压地区经甘肃到达关中各地;春节期间各城市碳质气溶胶的外来长距离输送减少, 碳质气溶胶的WPSCF高值区域(WPSCF > 0.8)向陕北和关中本地转移, 铜川和渭南仍有来自西北方向的长距离输送, 西安、宝鸡、咸阳的污染潜在源在关中以南也有分布;春节后碳质气溶胶的WPSCF高值区域(WPSCF > 0.8)主要分布在关中本地和陕南地区, 说明陕南山地的污染沉积也是关中平原的潜在污染来源.

|
图 9 关中平原OC的潜在源贡献函数分析 Fig. 9 Potential source contribution function analysis of OC in Guanzhong Plain |

|
图 10 关中平原EC的潜在源贡献函数分析 Fig. 10 Potential source contribution function analysis of EC in Guanzhong Plain |
(1) 时间分布上, ρ(OC)表现为:春节后[(18.6 ± 11.0)μg·m-3] > 春节期间[(16.2 ± 15.1)μg·m-3] > 春节前[(10.0 ± 8.3)μg·m-3];ρ(EC)表现为:春节后[(2.2 ± 1.2)μg·m-3] > 春节期间[(1.7 ± 1.5)μg·m-3] > 春节前[(1.4 ± 1.1)μg·m-3], 春节后OC和EC污染最严重. 空间分布上, ρ(OC)表现为:咸阳[(21.4 ± 17.3)μg·m-3] > 宝鸡[(15.8 ± 12.8)μg·m-3] > 西安[(13.6 ± 11.3)μg·m-3] > 渭南[(11.6 ± 9.1)μg·m-3] > 铜川[(10.0 ± 8.3)μg·m-3];ρ(EC)表现为咸阳[(2.1 ± 1.4)μg·m-3] > 渭南[(1.8 ± 1.4)μg·m-3] > 西安[(1.8 ± 1.2)μg·m-3] > 铜川[(1.6 ± 1.4)μg·m-3] > 宝鸡[(1.2 ± 0.9)μg·m-3], 总体上咸阳的PM2.5和碳质气溶胶污染最严重, 铜川污染最轻. IDW结果显示, PM2.5、OC和EC高值中心在平原中部的咸阳, 低值中心在平原北部的铜川, OC分布西高东低, EC分布东高西低.
(2) SOC/OC大小表现为:春节后(51.7%) > 春节期间(41.1%) > 春节前(36.8%). 各城市SOC在OC中的占比大小和各地SOC在关中平原的贡献率大小表明, 铜川、宝鸡、咸阳受有机碳二次转化影响较大.
(3) 3个时期OC和EC的相关性强, 具有高度的同源性. 碳质气溶胶在春节前和春节期间与湿度和风速有一定相关性, 春节后与各气象因子呈弱相关, 说明春节后SOC的增长主要依靠排放源. 碳质气溶胶总体上与CO、NO2有较强的相关性且在春节后相关性最强, 与SO2的相关性在春节期间最强.
(4) WPSCF值分布表明各城市碳质气溶胶污染潜在源主要集中在本地和周边甘肃南部、陕北以及陕南地区, 春节前还受到来自西北方向长距离运输的影响.
| [1] | Cui H, Mao P, Zhao Y, et al. Patterns in atmospheric carbonaceous aerosols in China: emission estimates and observed concentrations[J]. Atmospheric Chemistry and Physics, 2015, 15(15): 8657-8678. DOI:10.5194/acp-15-8657-2015 |
| [2] | Guo Y H. Characteristics of size-segregated carbonaceous aerosols in the Beijing-Tianjin-Hebei region[J]. Environmental Science and Pollution Research, 2016, 23(14): 13918-13930. DOI:10.1007/s11356-016-6538-z |
| [3] | Galindo N, Yubero E, Clemente A, et al. Insights into the origin and evolution of carbonaceous aerosols in a mediterranean urban environment[J]. Chemosphere, 2019, 235: 636-642. DOI:10.1016/j.chemosphere.2019.06.202 |
| [4] |
李安娜, 温天雪, 华维, 等. 鼎湖山大气颗粒物中OC与EC的浓度特征及粒径分布[J]. 环境科学, 2020, 41(9): 3908-3917. Li A N, Wen T X, Hua W, et al. Characterization and size distribution of carbonaceous aerosols at mountain Dinghu[J]. Environmental Science, 2020, 41(9): 3908-3917. |
| [5] | Sudheer A K, Aslam M Y, Upadhyay M, et al. Carbonaceous aerosol over semi-arid region of western India: Heterogeneity in sources and characteristics[J]. Atmospheric Research, 2016, 178-179: 268-278. DOI:10.1016/j.atmosres.2016.03.026 |
| [6] | Chen Z W, Ting Y C, Huang C H, et al. Sources-oriented contributions to ozone and secondary organic aerosol formation potential based on initial VOCs in an urban area of Eastern Asia[J]. Science of the Total Environment, 2023, 892. DOI:10.1016/j.scitotenv.2023.164392 |
| [7] | Yoo H Y, Kim K A, Kim Y P, et al. Validation of SOC estimation using OC and EC concentration in PM2.5 measured at Seoul[J]. Aerosol and Air Quality Research, 2022, 22(4). DOI:10.4209/aaqr.210388 |
| [8] | Liu P, Zhou H J, Chun X, et al. Characteristics and sources of carbonaceous aerosols in a semi-arid city: quantifying anthropogenic and meteorological impacts[J]. Chemosphere, 2023, 335. DOI:10.1016/j.chemosphere.2023.139056 |
| [9] | Bei N, Li G, Molina L T. Uncertainties in SOA simulations due to meteorological uncertainties in Mexico City during MILAGRO-2006 field campaign[J]. Atmospheric Chemistry and Physics, 2012, 12(23): 11295-11308. DOI:10.5194/acp-12-11295-2012 |
| [10] | Cao J J, Wang Q Y, Chow J C, et al. Impacts of aerosol compositions on visibility impairment in Xi'an, China[J]. Atmospheric Environment, 2012, 59: 559-566. DOI:10.1016/j.atmosenv.2012.05.036 |
| [11] | Moffett C E, Mehra M, Barrett T E, et al. Contemporary sources dominate carbonaceous aerosol on the North Slope of Alaska[J]. Science of the Total Environment, 2022, 831. DOI:10.1016/j.scitotenv.2022.154641 |
| [12] | Liu Y X, Zhao H M, Zhao G Y, et al. Carbonaceous gas and aerosol emissions from biomass burning in China from 2012 to 2021[J]. Journal of Cleaner Production, 2022, 362. DOI:10.1016/j.jclepro.2022.132199 |
| [13] | Dong Z, Wang S B, Sun J B, et al. Impact of COVID-19 lockdown on carbonaceous aerosols in a polluted city: composition characterization, source apportionment, influence factors of secondary formation[J]. Chemosphere, 2022, 307. DOI:10.1016/j.chemosphere.2022.136028 |
| [14] | Wang M, Duan Y S, Xu W, et al. Measurement report: characterisation and sources of the secondary organic carbon in a Chinese megacity over 5 years from 2016 to 2020[J]. Atmospheric Chemistry and Physics, 2022, 22(19): 12789-12802. DOI:10.5194/acp-22-12789-2022 |
| [15] |
彭超, 李振亮, 向英, 等. 重庆典型城区冬季碳质气溶胶的污染特征及来源解析[J]. 环境科学, 2024, 45(1): 48-60. Peng C, Li Z L, Xiang Y, et al. Characteristics and source apportionment of carbonaceous aerosols in the typical urban areas in Chongqing during winter[J]. Environmental Science, 2024, 45(1): 48-60. |
| [16] |
李立伟, 肖致美, 陈魁, 等. 京津冀区域PM2.5中碳组分污染特征研究[J]. 环境科学学报, 2018, 38(4): 1306-1316. Li L W, Xiao Z M, Chen K, et al. Characteristics of carbonaceous species of PM2.5 in the region of Beijing, Tianjin and Hebei, China[J]. Acta Scientiae Circumstantiae, 2018, 38(4): 1306-1316. |
| [17] |
田鹏山, 曹军骥, 韩永明, 等. 关中地区冬季PM2.5中碳气溶胶的污染特征及来源解析[J]. 环境科学, 2016, 37(2): 427-433. Tian P S, Cao J J, Han Y M, et al. Pollution characteristics and sources of carbonaceous aerosol in PM2.5 during winter in Guanzhong area[J]. Environmental Science, 2016, 37(2): 427-433. |
| [18] |
康宝荣, 刘立忠, 刘焕武, 等. 关中地区细颗粒物碳组分特征及来源解析[J]. 环境科学, 2019, 40(8): 3431-3437. Kang B R, Liu L Z, Liu H W, et al. Pollution characteristics and sources of carbonaceous components in PM2.5 in the Guanzhong area[J]. Environmental Science, 2019, 40(8): 3431-3437. |
| [19] | Feng T, Zhao S Y, Zhang X, et al. Increasing wintertime ozone levels and secondary aerosol formation in the Guanzhong basin, central China[J]. Science of the Total Environment, 2020, 745. DOI:10.1016/j.scitotenv.2020.140961 |
| [20] |
杨春华, 郑莉, 黄河清, 等. 重庆山地区域气象要素空间插值方法对比[J]. 气象与环境学报, 2022, 38(4): 57-66. Yang C H, Zheng L, Huang H Q, et al. Comparison of spatial interpolation methods of meteorological elements over Chongqing mountainous region[J]. Journal of Meteorology and Environment, 2022, 38(4): 57-66. |
| [21] |
吴昌广, 林德生, 周志翔, 等. 三峡库区降水量的空间插值方法及时空分布[J]. 长江流域资源与环境, 2010, 19(7): 752-758. Wu C G, Lin D S, Zhou Z X, et al. Spatial interpolation methods and temporal-spatial distribution of precipitation in the Three Gorges Reservoir area[J]. Resources and Environment in the Yangtze Basin, 2010, 19(7): 752-758. |
| [22] | Wu C, Wu D, Yu J Z. Quantifying black carbon light absorption enhancement with a novel statistical approach[J]. Atmospheric Chemistry and Physics, 2018, 18(1): 289-309. DOI:10.5194/acp-18-289-2018 |
| [23] | Wu C, Yu J Z. Determination of primary combustion source organic carbon-to-elemental carbon (OC/EC) ratio using ambient OC and EC measurements: secondary OC-EC correlation minimization method[J]. Atmospheric Chemistry and Physics, 2016, 16(8): 5453-5465. DOI:10.5194/acp-16-5453-2016 |
| [24] | Tang R Z, Wu Z P, Li X, et al. Primary and secondary organic aerosols in summer 2016 in Beijing[J]. Atmospheric Chemistry and Physics, 2018, 18(6): 4055-4068. |
| [25] | Li L, Li Q, Huang L, et al. Air quality changes during the COVID-19 lockdown over the Yangtze River Delta Region: an insight into the impact of human activity pattern changes on air pollution variation[J]. Science of the Total Environment, 2020, 732. DOI:10.1016/j.scitotenv.2020.139282 |
| [26] |
庹雄, 杨凌霄, 张婉, 等. 海-陆大气交汇作用下青岛冬季大气PM2.5污染特征与来源解析[J]. 环境科学, 2022, 43(5): 2284-2293. Tuo X, Yang L X, Zhang W, et al. Characteristics and source analysis of PM2.5 in Qingdao in winter under the action of sea-land-atmosphere convergence[J]. Environmental Science, 2022, 43(5): 2284-2293. |
| [27] |
张颖龙, 李莉, 吴伟超, 等. 嘉善冬季碳质气溶胶变化特征及其来源解析[J]. 环境科学, 2021, 42(9): 4116-4125. Zhang Y L, Li L, Wu W C, et al. Variation characteristics and source analysis of carbonaceous aerosols in winter in Jiashan[J]. Environmental Science, 2021, 42(9): 4116-4125. |
| [28] |
张灿, 周志恩, 翟崇治, 等. 基于重庆本地碳成分谱的PM2.5碳组分来源分析[J]. 环境科学, 2014, 35(3): 810-819. Zhang C, Zhou Z E, Zhai C Z, et al. Carbon source apportionment of PM2.5 in Chongqing based on local carbon profiles[J]. Environmental Science, 2014, 35(3): 810-819. |
| [29] | Sandrini S, Fuzzi S, Piazzalunga A, et al. Spatial and seasonal variability of carbonaceous aerosol across Italy[J]. Atmospheric Environment, 2014, 99: 587-598. |
| [30] | Cao J J, Lee S C, Chow J C, et al. Spatial and seasonal distributions of carbonaceous aerosols over China[J]. Journal of Geophysical Research: Atmospheres, 2007, 112(D22). DOI:10.1029/2006JD008205 |
| [31] | Chen Y J, Sheng G Y, Bi X H, et al. Emission factors for carbonaceous particles and polycyclic aromatic hydrocarbons from residential coal combustion in China[J]. Environmental Science & Technology, 2005, 39(6): 1861-1867. |
| [32] | Zhang N, Maung M W, Win M S, et al. Carbonaceous aerosol and inorganic ions of PM2.5 in Yangon and Mandalay of Myanmar: seasonal and spatial variations in composition and sources[J]. Atmospheric Pollution Research, 2022, 13(6). DOI:10.1016/j.apr.2022.101444 |
| [33] |
吕文丽, 张凯, 曹晴, 等. 烟花爆竹燃放对大气污染物及PM2.5组分影响[J]. 中国环境科学, 2020, 40(8): 3303-3311. Lü W L, Zhang K, Cao Q, et al. Impacts of fireworks burning on atmospheric pollutants and water-soluble inorganic ions in PM2.5 [J]. China Environmental Science, 2020, 40(8): 3303-3311. |
| [34] |
牟臻, 陈庆彩, 王羽琴, 等. 西安市PM2.5中碳质气溶胶污染特征[J]. 环境科学, 2019, 40(4): 1529-1536. Mu Z, Chen Q C, Wang Y Q, et al. Characteristics of carbonaceous aerosol pollution in PM2.5 in Xi'an[J]. Environmental Science, 2019, 40(4): 1529-1536. |
| [35] |
周变红, 王锦, 曹夏, 等. 宝鸡市冬季碳质气溶胶污染特征及来源解析[J]. 环境化学, 2020, 39(12): 3336-3345. Zhou B H, Wang J, Cao X, et al. Characteristics and sources of carbon fractions during winter in Baoji City[J]. Environmental Chemistry, 2020, 39(12): 3336-3345. |
| [36] |
李朝阳, 袁亮, 张小玲, 等. 成都碳质气溶胶变化特征及二次有机碳的估算[J]. 中国环境科学, 2022, 42(6): 2504-2513. Li Z Y, Yuan L, Zhang X L, et al. Characteristics of carbonaceous aerosols and estimation of secondary organic carbon in Chengdu[J]. China Environmental Science, 2022, 42(6): 2504-2513. |
| [37] | Hong Y H, Cao F, Fan M Y, et al. Impacts of chemical degradation of levoglucosan on quantifying biomass burning contribution to carbonaceous aerosols: a case study in Northeast China[J]. Science of the Total Environment, 2022, 819. DOI:10.1016/j.scitotenv.2021.152007 |
| [38] | Ji D S, Gao M, Maenhaut W, et al. The carbonaceous aerosol levels still remain a challenge in the Beijing-Tianjin-Hebei region of China: insights from continuous high temporal resolution measurements in multiple cities[J]. Environment International, 2019, 126: 171-183. |
| [39] | Yu Y Y, Ding F, Mu Y F, et al. High time-resolved PM2.5 composition and sources at an urban site in Yangtze River Delta, China after the implementation of the APPCAP[J]. Chemosphere, 2020, 261. DOI:10.1016/j.chemosphere.2020.127746 |
| [40] | Zhou S Z, Yang L X, Gao R, et al. A comparison study of carbonaceous aerosols in a typical North China Plain urban atmosphere: seasonal variability, sources and implications to haze formation[J]. Atmospheric Environment, 2017, 149: 95-103. |
| [41] |
桂佳群, 杨员, 王显钦, 等. 贵阳市花溪城区大气PM2.5中碳质气溶胶的变化特征及来源解析[J]. 环境科学, 2024, 45(3): 1337-1348. Gui J Q, Yang Y, Wang X Q, et al. Characteristics and source analysis of carbonaceous aerosols in PM2.5 in Huaxi district, Guiyang[J]. Environmental Science, 2024, 45(3): 1337-1348. |
| [42] | Cesari D, Merico E, Dinoi A, et al. Seasonal variability of carbonaceous aerosols in an urban background area in Southern Italy[J]. Atmospheric Research, 2018, 200: 97-108. |
| [43] | Kristensson A, Ausmeel S, Pauraite J, et al. Source contributions to rural carbonaceous winter aerosol in North-Eastern Poland[J]. Atmosphere, 2020, 11(3). DOI:10.3390/atmos11030263 |
| [44] | Bei N F, Li X P, Tie X, et al. Impact of synoptic patterns and meteorological elements on the wintertime haze in the Beijing-Tianjin-Hebei region, China from 2013 to 2017[J]. Science of the Total Environment, 2020, 704. DOI:10.1016/j.scitotenv.2019.135210 |
| [45] | Bei N F, Xiao B, Meng N, et al. Critical role of meteorological conditions in a persistent haze episode in the Guanzhong basin, China[J]. Science of the Total Environment, 2016, 550: 273-284. |
| [46] |
史海琪, 曾胜兰, 李浩楠. 四川盆地大气污染物时空分布特征及气象影响因素研究[J]. 环境科学学报, 2020, 40(3): 763-778. Shi H Q, Zeng S L, Li H N. Temporal and spatial distribution characteristics and influencing meteorological factors of air pollutants in sichuan basin[J]. Acta Scientiae Circumstantiae, 2020, 40(3): 763-778. |
| [47] | Chen H M, Zhuang B L, Liu J, et al. Characteristics of ozone and particles in the near-surface atmosphere in the urban area of the Yangtze River Delta, China[J]. Atmospheric Chemistry and Physics, 2019, 19(7): 4153-4175. |
| [48] | Bao B Y, Li Y P, Liu C Q, et al. Response of cross-correlations between high PM2.5 and O3 with increasing time scales to the COVID-19: different trends in BTH and PRD[J]. Environmental Monitoring and Assessment, 2023, 195(5). DOI:10.1007/s10661-023-11213-w |
| [49] | Teng W, Liu W W, Shao X, et al. Emission characteristics, environmental impact assessment and priority control strategies derived from VOCs speciation sourcely through measurement for wooden furniture-manufacturing industry in China[J]. Science of the Total Environment, 2023, 877. DOI:10.1016/j.scitotenv.2023.162287 |
| [50] |
易宵霄, 李姜豪, 李光华, 等. 铜川市秋冬季大气VOCs特征及其O3和SOA形成潜势分析[J]. 环境科学, 2022, 43(1): 140-149. Yi X X, Li J H, Li G H, et al. Characteristics of VOCs and formation potentials of O3 and SOA in autumn and winter in Tongchuan, China[J]. Environmental Science, 2022, 43(1): 140-149. |
| [51] | Zhan J L, Feng Z M, Liu P F, et al. Ozone and SOA formation potential based on photochemical loss of VOCs during the Beijing summer[J]. Environmental Pollution, 2021, 285. DOI:10.1016/j.envpol.2021.117444 |