 2024, Vol. 45


2. 河海大学浅水湖泊综合治理与资源开发教育部重点实验室, 南京 210098
2. Key Laboratory of Integrated Regulation and Resource Development on Shallow Lakes, Ministry of Education, Hohai University, Nanjing 210098, China
微塑料(microplastics, MPs)是指粒径小于5 mm的塑料颗粒、纤维或碎片.早在1972年, 美国马尾藻海域就发现了其存在痕迹[1], 但直到2004年这一概念才由Thompson在《科学》杂志上首次提出, 并自此成为国内外的研究热点[2].微塑料来源于人们生产生活的方方面面, 陆地上沐浴露等个人护理品的使用[3]、含纺织微纤维的废水排放[4]、农田塑料薄膜的破碎[5]、轮胎和道路标记的磨损[6, 7]、塑料垃圾的分解[8]、海洋上的航海运输和水产养殖都会产生不同程度的微塑料污染[9], 致使微塑料广泛存在于全球水环境中[10].但微塑料自带毒性[11]、难以降解、易被水生生物误食并沿食物链转移[12], 从而影响生物正常的生长发育, 甚至可能威胁到人类健康[13].更为复杂的是, 微塑料聚合物类型发生变化时, 其对生物的毒性效应也随之改变, 杨柳等[14]的研究表明与聚酰胺相比, 聚乙烯微塑料浸出液对生菜种子胚根和子叶的发育影响更大, 殷岑[15]同样发现聚乙烯微塑料对斜生栅藻的生长抑制毒性大于聚氯乙烯.
长江是欧亚大陆上最大的河流, 同时也被认为是向海洋出口微塑料最多的河流[16, 17].自Zhao等[18]于2014年第一次报道了长江口微塑料的污染现状, 长江流域微塑料研究进入了快速发展阶段, Su等[19]对长江中下游湖泊及长江口微塑料赋存情况进行调查, Wang等[20]研究了长江城市(武汉)地表水中微塑料的污染情况, Xiong等[21]聚焦于高原湖泊(青海湖)的微塑料污染特征.然而大多数有以下3个限制:①研究主要集中于干流或流域某一部分水体, 缺乏对全流域微塑料的整体性认识;②微塑料特征组成的多样化与污染源数量存在联系[22], 但没有统一的指标衡量长江流域微塑料特征组成的多样性;③流域内的多个地区开展了微塑料生态风险评价, 但使用方法不一, 无法进行横向比较.
长江作为我国社会经济可持续发展的命脉和水资源配置的战略水源地, 其流域水生态环境状况直接关系到长江经济带的绿色发展和高质量发展.因此, 本研究针对流域尺度建立了微塑料调查评价体系, 分析长江流域表层水体中微塑料污染特征, 引入多样性指数量化微塑料特征组成, 探究人为活动对流域微塑料的驱动机制, 评价水体微塑料的潜在生态风险, 以期为长江流域微塑料污染防控提供科学依据并为其他流域微塑料相关研究提供重要参考.
1 材料与方法 1.1 研究区域概况长江发源于青藏高原, 向东于崇明岛汇入东海, 全长6 300 km, 以宜昌和湖口为界分为上、中、下三段, 长度分别为4 504、955和938 km(如图 1).长江流域系指长江干支流的集水范围, 横跨我国三级阶梯, 面积约为1.8×10⁶ km2, 占国土总面积的18.8%.流域内水系发达, 汇入的主要水系有雅砻江、岷江、嘉陵江、乌江、洞庭湖、汉江和鄱阳湖[23].同时长江流域也被誉为我国的“黄金腰带”, 聚集了超过全国总量40%的人口和经济生产总值 , 平均人口密度超过220人·km-2, 且呈现由西向东逐渐递增的规律, 其中长江三角洲地区是长江流域乃至全国人口最密集的地区.

|
图 1 研究区域范围示意 Fig. 1 Schematic diagram of the study area scope |
(1)长江干支流的微塑料数据由既往研究提供, 其中长江源区[24, 25], 有6个采样点, 命名为M1 ~ M4、T1-1和T1-2;岷江流域成都段[26]有11个采样点, 命名为T2-1 ~ T2-11;汉江流域丹江口段[27]有13个采样点, 命名为T3-1 ~ T3-13;洞庭湖流域岳阳段[28]有14个采样点, 命名为T4-1 ~ T4-14;赣江流域[29]有10个采样点, 命名为T5-1 ~ T5-5、T6、T7和T8;太湖流域[30]有14个采样点, 命名为T9-1 ~ T9-14;长江干流[25]有34个采样点, 命名为M5 ~ M27, 其中有两个及以上采样点的部分地区, 附加数字后缀加以区分.微塑料数据的采样孔径处于10 ~ 75 μm范围内, 时间范围为2019年8月到2020年1月.
(2)收集微塑料采样点所在市级行政区的人类活动数据, 其中经济生产总值(gross domestic product, GDP, 亿元)、民用汽车保有量(万辆)、农林牧渔产值(亿元)和旅游收入(亿元)数据来自于各省统计年鉴以及地方国民经济和社会发展统计公报;人口密度(人·km-2)和城镇化率(%)数据来自于国家统计局发布的《第七次全国人口普查公报》;工业废水排放量(万t)数据来自于《中国城市统计年鉴》;快递业务量(万件)来自于地方邮政管理局.
(3)水系和市级行政区划地理数据来源于国家地理信息公共服务平台(https://www.tianditu.gov.cn/).
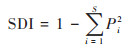
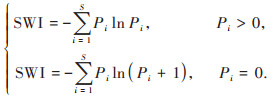
1.3 研究方法 1.3.1 微塑料多样性指数计算为了分析研究区域中微塑料特征组成的复杂性, 提出辛普森多样性指数(simpson diversity index, SDI)和香农-维纳指数(shannon-weiner index, SWI), 两者都用于量化微塑料多样性, 但前者对均匀度更加敏感, 后者对丰富度更加敏感[31, 32].其计算公式如下:
|
(1) |
|
(2) |
式中, S表示类别数, Pi表示类别i的微塑料在总样本中的比例.SDI最小值为0, 最大值为1, 且越接近1表示样本多样性越大.
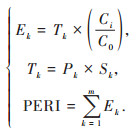
1.3.2 微塑料生态风险计算为了评价长江流域水体微塑料污染的生态风险, 根据微塑料丰度和聚合物类型计算潜在生态风险指数(potential ecological risk index, PERI), 计算公式如下:
|
(3) |
式中, Ci表示微塑料丰度;C0表示标准参考值, 此处选择Everaert等[33]计算出的表层水体中微塑料安全丰度(6 650 n·m-3);Tk表示聚合物k的化学毒性系数;Pk表示聚合物k的百分比;Sk表示聚合物k的危害分数[34], 具体数值如表 1所示, 其中聚合物RA和PB根据其特性自定义危害分数;Ek和PERI分别表示潜在生态风险因子和潜在生态风险指数.潜在生态风险分级标准阈值分别为:Ⅰ(PERI < 10)、Ⅱ(10≤PERI < 100)、Ⅲ(100≤PERI < 1 000)和Ⅳ(1 000≤PERI < 10 000).
|
|
表 1 聚合物危害分数 Table 1 Polymer hazard fraction |
2 结果与讨论 2.1 长江流域水体微塑料空间分布
微塑料在长江流域表层水体中的丰度结果见图 2.结果表明, 长江流域微塑料的丰度范围为21~44 080 n·m-3, 平均丰度为4 483 n·m-3.除赣江之外, 支流微塑料污染相比于干流更为严重.这可能是因为支流作为微塑料污染的直接受纳水体, 存在“二相性”, 既是微塑料的“载体”同时也是微塑料的“汇”[35], 随着支流微塑料产生源与长江干流之间距离的增加, 支流滞留效应凸显, 微塑料在流域内部汇聚, 从而加重支流微塑料污染.此外, 在支流中岷江流域是微塑料检出丰度的高值地区, 范围为6 110~44 080 n·m-3, 平均丰度高达15 880 n·m-3, 与珠江(8 725~53 250 n·m-3)微塑料检出丰度相当[35].究其原因, 一方面采样区域流经中国西部最大城市和经济文化中心成都, 2019年人口密度为1 157人·km-2, 人均生产总值为10.34万元, 分别为川渝平均水平的566%和168%[36].人口密集、建筑面积大以及农业活动强度高等原因进一步加剧了区域微塑料污染;另一方面成都地处四川盆地, 近郊为西邻群山, 冬季进入静稳气象状态后, 垂直和水平扩散条件差容易造成微塑料等污染物的积累和滞留[37], 与成都地形相似的北方城市(北京), 同样微塑料污染严重[38].

|
采样点中A表示T1和M1~M4, B表示T2-1~T2-11, C表示T3-1~T3-13, D表示T4-1~T4-14, E表示T5~T8, F表示T9-1~T9-14 图 2 长江流域微塑料丰度空间变化趋势 Fig. 2 Spatial variation trend of microplastic abundance in the Yangtze River Basin |
有研究指出湖泊、水库等相对封闭或全封闭的水体, 水文条件相对稳定, 利于微塑料沉积与滞留, 因而成为内陆水体中微塑料重要的“汇”[39].本研究中丹江口水库(708~12 529 n·m-3)、岳阳南湖(3 050~7 100 n·m-3)以及太湖(1 650~8 480 n·m-3)较高的微塑料丰度也印证了这一点.但位于干流的三峡水库对微塑料的汇聚效应并不明显, 微塑料丰度呈现自东向西逐渐增加的趋势, 这可能是因为三峡水库属于典型的峡谷河道型水库[40], 而且采样时间处于水库的开闸补枯期, 导致水流对微塑料的搬运作用较为强烈.Di等[41]对三峡水库微塑料污染的调查同样表明, 表层水体微塑料丰度与其距三峡大坝的距离无相关性, 大坝并不具有明显的拦截作用.
2.2 长江流域水体微塑料特征组成如图 3所示, 长江流域微塑料尺寸集中在0~1 mm, 其中长江源区和太湖流域小于0.5 mm的占比高达96.46%和93.20%;形状以纤维和碎片为主, 二者占比分别为54.63%和32.43%;颜色以彩色和透明为主, 占比分别为237.93%和29.61%;聚合物类型中, PE和PP占比较大, 分别为26.85%和25.80%.基于流域微塑料的特征组成, 可以对其进行溯源分析, 比如长江源区和洞庭湖岳阳段微塑料主导形状为纤维, 主导颜色为透明, 主导聚合物为PE和PA, 推测区域微塑料与长江源区纺织品在建筑、装饰和服饰方面的广泛应用以及岳阳城区含洗衣纤维的生活污水排放有关[42].

|
(a)尺寸, (b)形状, (c)颜色, (d)聚合物成分;采样点中A表示T1和M1~M4, B表示T2-1~T2-11, C表示T3-1~T3-13, D表示T4-1~T4-14, E表示T5~T8, F表示T9-1~T9-14, G表示M5~M27;部分采样点未对微塑料尺寸或颜色进行鉴定 图 3 长江流域微塑料的形态分布 Fig. 3 Morphological distribution of microplastics in the Yangtze River Basin |
目前微塑料分类还没有统一的标准, 区域之间无法进行定量比较, 因此利用SDI和SWI衡量长江流域微塑料在尺寸、颜色、形状和聚合物方面的多样性.微塑料尺寸、形状、颜色和聚合物的SDI多样性指数分别为0.462~0.607、0.067~0.593、0.557~0.688和0.558~0.882, SWI多样性指数分别为0.853~1.068、0.078~1.061、0.985~1.269和0.899~1.810(图 4).与以往的研究相比, 本研究的SDI(0.586)高于贵州南明河流域微塑料的SDI(0.544)[43], 但SWI(1.087)小于莱州湾微塑料的SWI(1.840)[44].SWI和SDI在量化微塑料聚合物多样性方面变化趋势相同, 但在尺寸、形状和颜色方面略有差异, 特别是在微塑料尺寸多样性中汉江流域丹江口段的SDI处于下降趋势但SWI却在上升, 说明该区域微塑料尺寸的丰富度在增加但均匀度在减少.

|
采样点中A表示T1和M1~M4, B表示T2-1~T2-11, C表示T3-1~T3-13, D表示T4-1~T4-14, E表示T5~T8, F表示T9-1~T9-14, G表示M5~M27 图 4 长江流域微塑料多样性指数 Fig. 4 Microplastic diversity index in the Yangtze River Basin |
人类是微塑料的唯一来源[45], 直接影响着微塑料在环境中的分布情况.图 5的回归分析表明, 人类活动与微塑料丰度呈显著正相关(P < 0.05), 其中民用汽车保有量和旅游收入与微塑料丰度相关性较强, 城镇化率、快递业务量和GDP与微塑料丰度的相关性次之, 人口密度、工业废水排放量和农林牧渔产值与微塑料丰度的相关性较弱, 这说明了交通运输业和旅游业是影响微塑料分布的主要行业.汽车行驶过程中轮胎磨损产生的微塑料会通过道路径流或雨水径流进入水环境[46], 并已成为水体微塑料的最大来源[47].Kole等[48]通过计算表明轮胎磨损微塑料的人均排放量达到了0.81 kg, 一年的全球释放量高达591万t, 同时汽车数量决定了轮胎磨损微塑料的释放量[49], 使得本研究中汽车保有量与微塑料丰度相关性最强.此外旅游收入与微塑料丰度同样具有较强相关性, 造成这一现象的原因是游客产生的垃圾中44%为塑料废弃物[50], 而景区垃圾产生源分散且不易控制, 加之假期游客高峰期垃圾桶数量严重不足以及工作人员清洁不及时导致塑料废弃物管理不善容易进入环境中, 进而造成水体微塑料污染.

|
图 5 长江流域微塑料丰度与人类活动的关系 Fig. 5 Relationship between microplastic abundance and anthropogenic activities in the Yangtze River Basin |
让人意外的是, 人口密度和工业废水排放量与微塑料丰度相关性较弱, 这可能是因为污水处理厂去除了生活污水及工业废水中的部分微塑料, Gao等[51]的调查表明污水处理厂对微塑料的去除率为50%~99.99%不等.农林牧渔产值与微塑料丰度最弱, 说明农用塑料薄膜虽然是土壤微塑料的重要来源[52], 但可能会在土壤系统中滞留, 仅部分通过地表径流进入水体中.王慧等[53]在淮河流域开展的研究证实了这一点, 强降雨情况下表层土壤(10 cm)的农业源微塑料平均流失比例为7.58%.
2.4 长江流域微塑料生态风险评价采用潜在生态风险指数法对长江流域水体微塑料污染造成的生态风险进行了评价(图 6).流域微塑料的PERI值差异巨大, 介于0.33 ~ 4 049之间, 就比例而言, 6.90%的地区属于Ⅳ级风险区, 62.07%的地区属于Ⅲ级风险区, 20.69%的地区属于Ⅱ级风险区, 10.34%的地区属于Ⅰ级风险区.岷江流域成都段和太湖流域PERI值过高, 导致流域整体微塑料生态风险高于西江主流区(PERI:231~943)[54]、泰国沿海省份(PERI:50~470)[55]以及印度海港城市(PERI:253~445)[56]水体中微塑料的生态风险, 但显著低于我国海湾微塑料生态风险[57].

|
采样点中A表示T1和M1~M4, B表示T2-1~T2-11, C表示T3-1~T3-13, D表示T4-1~T4-14, E表示T5~T8, F表示T9-1~T9-14 图 6 长江流域微塑料潜在生态风险水平 Fig. 6 Potential ecological risk level of microplastics in the Yangtze River Basin |
PERI值最高的地区出现在太湖流域, 绝大部分由PVC贡献, 占PERI值的99.81%.蓝藻水华等富营养化问题一直以来是太湖流域水污染防治的重点, 而最新研究表明微塑料可能会改变有害蓝藻的分布[58], 本研究中太湖流域过高的微塑料生态风险可能会扩大有害蓝藻的发生区域和发生风险.进入干流后, PERI值的峰值为326, 出现在长江中游和下游的分界线, PVC贡献了总PERI值的95.31%, 同时该处也是鄱阳湖与长江的交汇处, 水量交换频繁, 微塑料也随之迁移.虽然鄱阳湖上游入湖河流——赣江的PERI值仅为0.33, 但下游长江微塑料生态风险较高, 可能会对鄱阳湖这类过水性、吞吐型湖泊的自然保护区以及敏感物种造成威胁.微塑料的生态风险由微塑料丰度和聚合物类型共同决定, 在削减微塑料丰度的同时应注意PVC和PU等高风险聚合物的控制.
3 结论(1)长江流域微塑料分布具有明显的空间异质性, 其丰度范围为21~44 080 n·m-3;支流微塑料污染相比于干流更为严重, 且丰度最高值出现在岷江流域成都段;太湖、南湖和丹江口水库等湖泊、水库是微塑料重要的“汇”.目前研究侧重于长江流域微塑料的空间分布, 未来将结合时间尺度进行深入探讨.
(2)流域微塑料尺寸集中在0~1 mm, 形状以纤维和碎片为主, 颜色以彩色(有色)和透明为主, 聚合物以PE和PP为主, 用于衡量微塑料多样性的辛普森指数和香农-维纳指数空间变化趋势略有不同.
(3)人类活动与微塑料丰度呈显著正相关(P < 0.05), 其中民用汽车保有量和旅游收入与微塑料丰度相关性最强, 而污水处理厂的去除和土壤系统的滞留导致人口密度、工业废水排放量以及农林牧渔产值与水体中微塑料丰度的相关性较弱.
(4)长江流域微塑料生态风险水平相对较高, 68.97%的区域属于Ⅲ级和Ⅳ级风险区, 最高值出现在太湖流域.此外, 主要影响微塑料生态风险的聚合物类型为PVC和PU, 因此在微塑料生态风险防控方面, 应同时注意微塑料丰度削减与高风险聚合物控制.
| [1] | Carpenter E J, Smith K L Jr. Plastics on the sargasso sea surface[J]. Science, 1972, 175(4027): 1240-1241. DOI:10.1126/science.175.4027.1240 |
| [2] | Thompson R C, Olsen Y, Mitchell R P, et al. Lost at sea: Where is all the plastic?[J]. Science, 2004, 304(5672): 838. DOI:10.1126/science.1094559 |
| [3] | Auta H S, Emenike C U, Fauziah S H. Distribution and importance of microplastics in the marine environment: A review of the sources, fate, effects, and potential solutions[J]. Environment International, 2017, 102: 165-176. DOI:10.1016/j.envint.2017.02.013 |
| [4] | Mason S A, Garneau D, Sutton R, et al. Microplastic pollution is widely detected in US municipal wastewater treatment plant effluent[J]. Environmental Pollution, 2016, 218: 1045-1054. DOI:10.1016/j.envpol.2016.08.056 |
| [5] | Ng E L, Lwanga E H, Eldridge S M, et al. An overview of microplastic and nanoplastic pollution in agroecosystems[J]. Science of the Total Environment, 2018, 627: 1377-1388. DOI:10.1016/j.scitotenv.2018.01.341 |
| [6] | Foitzik M J, Unrau H J, Gauterin F, et al. Investigation of ultra fine particulate matter emission of rubber tires[J]. Wear, 2018, 394-395: 87-95. DOI:10.1016/j.wear.2017.09.023 |
| [7] | Horton A A, Svendsen C, Williams R J, et al. Large microplastic particles in sediments of tributaries of the River Thames, UK-Abundance, sources and methods for effective quantification[J]. Marine Pollution Bulletin, 2017, 114(1): 218-226. DOI:10.1016/j.marpolbul.2016.09.004 |
| [8] | Jiang C B, Yin L S, Wen X F, et al. Microplastics in sediment and surface water of west Dongting lake and south Dongting lake: Abundance, source and composition[J]. International Journal of Environmental Research and Public Health, 2018, 15(10). DOI:10.3390/ijerph15102164 |
| [9] | Gao L, Wang Z Z, Peng X Z, et al. Occurrence and spatial distribution of microplastics, and their correlation with petroleum in coastal waters of Hainan Island, China[J]. Environmental Pollution, 2022, 294. DOI:10.1016/j.envpol.2021.118636 |
| [10] |
耿娜, 赵广明, 张大海, 等. 黄河三角洲湿地表层沉积物中微塑料的分布、来源和风险评价[J]. 环境科学, 2023, 44(9): 5046-5054. Geng N, Zhao G M, Zhang D H, et al. Distribution, sources, and risk assessment of microplastics in surface sediments of Yellow River Delta wetland[J]. Environmental Science, 2023, 44(9): 5046-5054. |
| [11] |
王峰, 公玮, 刘哲, 等. 南水北调丹江口库区土壤中微塑料分布特征及风险评估[J]. 环境科学, 2023, 44(11): 6279-6286. Wang F, Gong W, Liu Z, et al. Distribution characteristics and risk assessment of microplastics in soil in Danjiangkou Reservoir area of South-to-North Water Diversion Project[J]. Environmental Science, 2023, 44(11): 6279-6286. |
| [12] |
山泽萱, 张妍, 张成前, 等. 渭河微塑料污染现状与风险评价[J]. 环境科学, 2023, 44(1): 231-242. Shan Z X, Zhang Y, Zhang C Q, et al. Microplastic pollution status and ecological risk evaluation in Weihe river[J]. Environmental Science, 2023, 44(1): 231-242. |
| [13] |
赵佳, 饶本强, 郭秀梅, 等. 微塑料对斑马鱼胚胎孵化影响及其在幼鱼肠道中的积累[J]. 环境科学, 2021, 42(1): 485-491. Zhao J, Rao B Q, Guo X M, et al. Effects of microplastics on embryo hatching and intestinal accumulation in larval zebrafish Danio rerio[J]. Environmental Science, 2021, 42(1): 485-491. |
| [14] |
杨柳, 张琳, 邓敏, 等. 不同聚合物类型微塑料浸出液的表征及其对生菜种子萌发的影响[J]. 环境科学, 2023, 44(10): 5779-5787. Yang L, Zhang L, Deng M, et al. Characterization of microplastic leachate from different polymers and its effect on seed germination of lettuce[J]. Environmental Science, 2023, 44(10): 5779-5787. |
| [15] | 殷岑. 微塑料和有机污染物对水生生物的联合毒性效应研究[D]. 南京: 南京理工大学, 2018. |
| [16] | Lebreton L C M, Van Der Zwet J, Damsteeg J W, et al. River plastic emissions to the world's oceans[J]. Nature Communications, 2017, 8(1). DOI:10.1038/ncomms15611 |
| [17] | Schmidt C, Krauth T, Wagner S. Export of plastic debris by rivers into the sea[J]. Environmental Science & Technology, 2017, 51(21): 12246-12253. |
| [18] | Zhao S Y, Zhu L X, Wang T, et al. Suspended microplastics in the surface water of the Yangtze Estuary System, China: first observations on occurrence, distribution[J]. Marine Pollution Bulletin, 2014, 86(1-2): 562-568. DOI:10.1016/j.marpolbul.2014.06.032 |
| [19] | Su L, Cai H W, Kolandhasamy P, et al. Using the Asian clam as an indicator of microplastic pollution in freshwater ecosystems[J]. Environmental Pollution, 2018, 234: 347-355. DOI:10.1016/j.envpol.2017.11.075 |
| [20] | Wang W F, Ndungu A W, Li Z, et al. Microplastics pollution in inland freshwaters of China: A case study in urban surface waters of Wuhan, China[J]. Science of the Total Environment, 2017, 575: 1369-1374. DOI:10.1016/j.scitotenv.2016.09.213 |
| [21] | Xiong X, Zhang K, Chen X C, et al. Sources and distribution of microplastics in China's largest inland lake – Qinghai Lake[J]. Environmental Pollution, 2018, 235: 899-906. DOI:10.1016/j.envpol.2017.12.081 |
| [22] | Li C C, Gan Y D, Zhang C, et al. "Microplastic communities" in different environments: Differences, links, and role of diversity index in source analysis[J]. Water Research, 2021, 188. DOI:10.1016/j.watres.2020.116574 |
| [23] |
徐苏, 张永勇, 窦明, 等. 长江流域土地利用时空变化特征及其径流效应[J]. 地理科学进展, 2017, 36(4): 426-436. Xu S, Zhang Y Y, Dou M, et al. Spatial distribution of land use change in the Yangtze River Basin and the impact on runoff[J]. Progress in Geography, 2017, 36(4): 426-436. |
| [24] |
张胜, 潘雄, 林莉, 等. 长江源区水体微塑料组成及分布特征初探[J]. 长江科学院院报, 2021, 38(4): 12-18. Zhang S, Pan X, Lin L, et al. Preliminary study on composition and distribution characteristics of microplastics in water from the source region of Yangtze River[J]. Journal of Yangtze River Scientific Research Institute, 2021, 38(4): 12-18. |
| [25] | Yuan W K, Christie-Oleza J A, Xu E G, et al. Environmental fate of microplastics in the world's third-largest river: Basin-wide investigation and microplastic community analysis[J]. Water Research, 2022, 210. DOI:10.1016/j.watres.2021.118002 |
| [26] | Li X T, Liang R F, Li Y, et al. Microplastics in inland freshwater environments with different regional functions: A case study on the Chengdu Plain[J]. Science of the Total Environment, 2021, 789. DOI:10.1016/j.scitotenv.2021.147938 |
| [27] | Lin L, Pan X, Zhang S, et al. Distribution and source of microplastics in China's second largest reservoir-Danjiangkou reservoir[J]. Journal of Environmental Sciences, 2021, 102: 74-84. DOI:10.1016/j.jes.2020.09.018 |
| [28] |
文晓凤, 尹令实, 蒋昌波, 等. 典型城市湖泊岳阳南湖表层水体中的微塑料污染特征[J]. 环境化学, 2022, 41(11): 3579-3588. Wen X F, Yin L S, Jiang C B, et al. Microplastics in surface water of a typical urban lake: A case study from Nanhu Lake, Yueyang City[J]. Environmental Chemistry, 2022, 41(11): 3579-3588. DOI:10.7524/j.issn.0254-6108.2021071404 |
| [29] | Hu H, Jin D F, Yang Y Y, et al. Distinct profile of bacterial community and antibiotic resistance genes on microplastics in Ganjiang River at the watershed level[J]. Environmental Research, 2021, 200. DOI:10.1016/j.envres.2021.111363 |
| [30] | Zhang Q J, Liu T, Liu L, et al. Distribution and sedimentation of microplastics in Taihu Lake[J]. Science of the Total Environment, 2021, 795. DOI:10.1016/j.scitotenv.2021.148745 |
| [31] | Fang Q, Niu S P, Yu J H. Characterising microplastic pollution in sediments from urban water systems using the diversity index[J]. Journal of Cleaner Production, 2021, 318. DOI:10.1016/j.jclepro.2021.128537 |
| [32] |
许晴, 张放, 许中旗, 等. Simpson指数和Shannon-Wiener指数若干特征的分析及"稀释效应"[J]. 草业科学, 2011, 28(4): 527-531. Xu Q, Zhang F, Xu Z Q, et al. Some characteristics of Simpson index and the Shannon-Wiener index and their dilution effect[J]. Pratacultural Science, 2011, 28(4): 527-531. DOI:10.3969/j.issn.1001-0629.2011.04.001 |
| [33] | Everaert G, Van Cauwenberghe L, De Rijcke M, et al. Risk assessment of microplastics in the ocean: Modelling approach and first conclusions[J]. Environmental Pollution, 2018, 242: 1930-1938. DOI:10.1016/j.envpol.2018.07.069 |
| [34] | Lithner D, Larsson Å, Dave G. Environmental and health hazard ranking and assessment of plastic polymers based on chemical composition[J]. Science of the Total Environment, 2011, 409(18): 3309-3324. DOI:10.1016/j.scitotenv.2011.04.038 |
| [35] | Yan M T, Nie H Y, Xu K H, et al. Microplastic abundance, distribution and composition in the Pearl River along Guangzhou city and Pearl River estuary, China[J]. Chemosphere, 2019, 217: 879-886. DOI:10.1016/j.chemosphere.2018.11.093 |
| [36] |
黄鉴涛, 刘婧懿, 徐家炜, 等. 新冠肺炎疫情时期四川盆地大气污染成因分析[J]. 气象科学, 2022, 42(3): 377-389. Huang J T, Liu J Y, Xu J W, et al. Analysis of air pollution in the Sichuan Basin during the COVID-19 pandemic[J]. Journal of the Meteorological Sciences, 2022, 42(3): 377-389. |
| [37] |
王碧菡, 廖婷婷, 蒋婉婷, 等. 成都市郊冬季一次大气重污染过程化学组分粒径分布特征[J]. 环境化学, 2022, 41(10): 3323-3334. Wang B H, Liao T T, Jiang W T, et al. The particle size distribution of chemical components during a heavy air pollution period in suburban Chengdu in winter[J]. Environmental Chemistry, 2022, 41(10): 3323-3334. DOI:10.7524/j.issn.0254-6108.2021060703 |
| [38] |
门聪, 李頔, 左剑恶, 等. 北京市通州区河流中微塑料组成的空间分布及潜在来源解析[J]. 环境科学, 2022, 43(7): 3656-3663. Men C, Li D, Zuo J E, et al. Spatial variation and potential sources of microplastics in rivers in Tongzhou District, Beijing[J]. Environmental Science, 2022, 43(7): 3656-3663. |
| [39] | Jian M F, Zhang Y, Yang W J, et al. Occurrence and distribution of microplastics in China's largest freshwater lake system[J]. Chemosphere, 2020, 261. DOI:10.1016/j.chemosphere.2020.128186 |
| [40] |
郭劲松, 陈海燕, 李哲, 等. 三峡水库水环境相关研究文献计量分析与未来展望[J]. 湖泊科学, 2018, 30(5): 1177-1186. Guo J S, Chen H Y, Li Z, et al. Bibliometric and hot topic analysis of related literatures on water environment in Three Gorges Reservoir[J]. Journal of Lake Sciences, 2018, 30(5): 1177-1186. |
| [41] | Di M X, Wang J. Microplastics in surface waters and sediments of the Three Gorges Reservoir, China[J]. Science of the Total Environment, 2018, 616-617: 1620-1627. DOI:10.1016/j.scitotenv.2017.10.150 |
| [42] | Wang T, Zou X Q, Li B J, et al. Preliminary study of the source apportionment and diversity of microplastics: Taking floating microplastics in the South China Sea as an example[J]. Environmental Pollution, 2019, 245: 965-974. DOI:10.1016/j.envpol.2018.10.110 |
| [43] | 刘咏雪. 贵阳市南明河流域微塑料分布特征及风险评估研究[D]. 贵阳: 贵州大学, 2022. |
| [44] | Sun X M, Wang T, Chen B J, et al. Factors influencing the occurrence and distribution of microplastics in coastal sediments: From source to sink[J]. Journal of Hazardous Materials, 2021, 410. DOI:10.1016/j.jhazmat.2020.124982 |
| [45] |
李高俊, 熊雄, 詹晨熙, 等. 南渡江水体微塑料污染现状研究[J]. 环境科学学报, 2022, 42(2): 205-212. Li G J, Xiong X, Zhan C X, et al. Occurrence of microplastics in the water of the Nandu Jiang River[J]. Acta Scientiae Circumstantiae, 2022, 42(2): 205-212. |
| [46] | Unice K M, Weeber M P, Abramson M M, et al. Characterizing export of land-based microplastics to the estuary-Part I: Application of integrated geospatial microplastic transport models to assess tire and road wear particles in the Seine watershed[J]. Science of the Total Environment, 2019, 646: 1639-1649. DOI:10.1016/j.scitotenv.2018.07.368 |
| [47] | Wang T, Li B J, Zou X Q, et al. Emission of primary microplastics in mainland China: Invisible but not negligible[J]. Water Research, 2019, 162: 214-224. DOI:10.1016/j.watres.2019.06.042 |
| [48] | Kole P J, Löhr A J, Van Belleghem F G A J, et al. Wear and tear of tyres: A stealthy source of microplastics in the environment[J]. International Journal of Environmental Research and Public Health, 2017, 14(10). DOI:10.3390/ijerph14101265 |
| [49] |
焦萌, 曹秉帝, 张涛. 环境中的轮胎磨损颗粒: 从路面到海洋[J]. 环境科学学报, 2020, 40(12): 4263-4278. Jiao M, Cao B D, Zhang T. Tire wear particles in the environment: from road to ocean[J]. Acta Scientiae Circumstantiae, 2020, 40(12): 4263-4278. |
| [50] |
邓婷, 高俊敏, 吴文楠, 等. 温州沿海大型塑料垃圾排放特征研究[J]. 中国环境科学, 2018, 38(11): 4354-4360. Deng T, Gao J M, Wu W N, et al. Study on the discharging characteristics of large plastic litters along Wenzhou coastal[J]. China Environmental Science, 2018, 38(11): 4354-4360. DOI:10.3969/j.issn.1000-6923.2018.11.046 |
| [51] | Gao Z Q, Chen L G, Cizdziel J, et al. Research progress on microplastics in wastewater treatment plants: A holistic review[J]. Journal of Environmental Management, 2023, 325. DOI:10.1016/j.jenvman.2022.116411 |
| [52] | Huang Y, Liu Q, Jia W Q, et al. Agricultural plastic mulching as a source of microplastics in the terrestrial environment[J]. Environmental Pollution, 2020, 260. DOI:10.1016/j.envpol.2020.114096 |
| [53] | 王慧. 淮河流域王蚌区间农业源微塑料迁移特征及影响因素研究[D]. 淮南: 安徽理工大学, 2022. |
| [54] | Mai Y Z, Peng S Y, Lai Z N, et al. Measurement, quantification, and potential risk of microplastics in the mainstream of the Pearl River (Xijiang River) and its estuary, Southern China[J]. Environmental Science and Pollution Research, 2021, 28(38): 53127-53140. DOI:10.1007/s11356-021-14395-3 |
| [55] | Prarat P, Hongsawat P. Microplastic pollution in surface seawater and beach sand from the shore of Rayong province, Thailand: Distribution, characterization, and ecological risk assessment[J]. Marine Pollution Bulletin, 2022, 174. DOI:10.1016/j.marpolbul.2021.113200 |
| [56] | Keerthika K, Padmavathy P, Rani V, et al. Spatial, seasonal and ecological risk assessment of microplastics in sediment and surface water along the Thoothukudi, south Tamil Nadu, south east India[J]. Environmental Monitoring and Assessment, 2022, 194(11). DOI:10.1007/s10661-022-10468-z |
| [57] | Liu S L, Junaid M, Sadaf M, et al. A novel framework-based meta-analysis for in-depth characterization of microplastic pollution and associated ecological risks in Chinese Bays[J]. Journal of Hazardous Materials, 2023, 444. DOI:10.1016/j.jhazmat.2022.130423 |
| [58] | Wang K, Lin H, Wang S M, et al. Species diversity and community structure of microalgae living on microplastics in Luoyuan Bay, China[J]. Marine Pollution Bulletin, 2022, 180. DOI:10.1016/j.marpolbul.2022.113809 |