 2022, Vol. 43


2. 长江保护与绿色发展研究院, 南京 210098
2. Yangtze Institute for Conservation and Development, Nanjing 210098, China
塑料具有低成本且多功能的特点, 在过去几十年中被广泛应用, 据Plastics Europe发布的报告显示[1], 2019年全球塑料产量已达3.7×10⁸ t, 超过大多数人造材料[2].到2025年, 估计有192个国家或地区因管理不善而产生最高达2.5×10⁸ t的海洋塑料垃圾[3], 而大块塑料在自然环境下会破碎成微米甚至纳米级别的塑料碎片.微塑料通常被定义为尺寸小于5 mm的塑料颗粒, 由于降解缓慢和在环境中的持久性[4], 微塑料容易长时间暴露在水体中并和水生生物相互作用[5], 造成潜在的生态威胁[6~8].
内陆淡水是微塑料进入海洋的重要途径[4], 该领域一直是微塑料的研究重点.由于其持续积累, 湖泊成为淡水系统中微塑料的主要“汇”[9].对于一些特定的水体, 如水交换频繁的浅水湖泊, 沉积物比地表水更能反映微塑料长期的污染水平[10].此外, 水库或大坝等特殊水工结构可能是微塑料积累的热点, 水流冲击[11, 12]、非点源污染[13]和人工洪水[14]能改变微塑料的运输和迁移行为, 因此探究人为影响下微塑料的分布特征和环境行为有着重要意义.
骆马湖是换水频繁的人工调控湖泊, 截至2021年4月, 南水北调东线工程已向中国北方地区调水超过4.9×10⁹ t[15], 而骆马湖是东线工程的重要节点, 年调水量巨大.除了长达半年的调水期外, 骆马湖的主要支流还具有泄洪、灌溉等功能, 进出水频繁.骆马湖的上游是拥有稠密人口和发达工业的长江流域[16], 存在大量未妥善处置的塑料垃圾, 长江和支流地区微塑料污染严重[17], 但大规模的调水工程对沿线城市湖泊带来的环境风险和对微塑料环境行为的影响仍缺乏调研数据.本研究阐明了骆马湖表层沉积物微塑料的丰度、特征和时空分布, 计算其储存量, 通过探讨人工泄洪和调水对表层沉积物微塑料分布特征的影响, 以期为人工调控下微塑料的破碎和迁移行为提供新的证据.
1 材料与方法 1.1 研究区域骆马湖是位于中国江苏省的城市浅水湖泊, 南北长约27 km, 东西宽约20 km, 水域面积260 km2.作为淮河流域第三大湖泊, 骆马湖是宿迁市和徐州市数百万居民的重要饮用水源[16], 具有防汛抗旱的功能, 同时带动了当地渔业、水产养殖和旅游业的兴旺[18].
1.2 样品采集本研究从骆马湖收集了20个采样点的表层沉积物, 深度为0~3 cm, 点位布设如图 1所示, 根据当地土地总体规划将采样点划分为自然保护区、工业区、旅游区、渔业养殖区和农田区.非调水期采样日期为2019年9月, 调水期采样日期为2021年1月, 其间有持续半年的大规模调水.样品储存在装满干冰的容器中, 采样当日运送至实验室作进一步分析.

|
图 1 骆马湖的地理位置和采样点分布示意 Fig. 1 Geographical location and sampling sites of Luoma Lake |
沉积物样品在-50℃下冷冻干燥后通过5 mm不锈钢网粗筛.取50 g样品置于250 mL烧杯中, 加入150 mL饱和氯化钠溶液, 磁力搅拌10 min后静置沉降12 h以上.收集上清液并在真空下通过滤纸(Whatman GF/B glass microfiber, Britain), 将滤后颗粒冲洗至烧杯中.以上分离过程重复3次后, 将样品置于60 mL 30% 过氧化氢中, 在65℃下消解8 h以上, 充分降解有机物以避免植物纤维对显微镜观察的干扰[19].再次真空过滤后, 将滤纸转移到培养皿中并在室温下干燥.
1.4 样品分析在光学显微镜(Leica DM2500 & DM2500 LED, Leica Corporation, Germany)下目视检查滤纸上的所有颗粒, 将观察到的颗粒根据形状、颜色和尺寸分类计数.通过傅里叶变换红外显微镜光谱仪(Spotlight 200i, PerkinElmer, US)以16次扫描的速率识别疑似塑料颗粒, 光谱范围为4000~650 cm-1, 分辨率为8 cm-1, 鉴定结果对比谱库验证, 匹配分数超过80%则确定为塑料成分.使用扫描电子显微镜(SU8220, Hitachi, Japan)分析微塑料的表面形态.
1.5 储存量计算本研究参考了Cai等[20]关于南海海水微塑料储存量的研究成果, 其通过单位体积海水微塑料含量推算至水域储存量, 本研究将该计算原理应用到由单位质量沉积物的微塑料丰度推算至湖泊沉积物的储存量.同时, 基于形状差异(纤维、薄膜和微球)估算单个微粒体积和质量, 结合各形状微塑料占比计算单位沉积物的微塑料储存量, 计算过程如下:

|
(1) |
式中, S为骆马湖表层沉积物微塑料的质量储存量; i为骆马湖水域分区, 骆马湖渔业和水路运输活动主要集中于徐州市境内即骆马湖北部[21], 同时基于文献[22]中区域名录和实地调研情况发现, 骆马湖南部宿迁境内多为饮用水源地保护区、渔业繁殖保护区和湿地, 人类活动较少, 故将骆马湖水域划分为渔业养殖区和禁渔区; Mi为分区i单位沉积物的微塑料质量; ρi为分区i沉积物的密度; Ai为分区i的水域面积; h为沉积物采样深度, 取3 cm.
|
(2) |
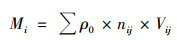
式中, ρ0为微塑料密度, 参考Sui等[23]将桑沟湾主要聚合物成分的平均密度作为微塑料密度的计算方法, 此处取值为骆马湖沉积物中检测出常见塑料类型即聚乙烯(0.96 g·cm-3)和尼龙(1.00 g·cm-3)的平均密度为0.98 g·cm-3; j为微塑料形状类型; nij为分区i单位沉积物中第j种微塑料的数量; Vij为分区i第j种微塑料的单个微粒体积, 在显微镜下观察纤维呈细长条状, 薄膜呈厚度小的圆扁平状, 碎片(微球)呈规则或不规则球体, 故将其概化为窄底圆柱体、宽底圆柱体和球体, 其中纤维和薄膜厚度均按实际观测值8 μm估算, 长度或直径按观测尺寸的平均值估算.

|
(3) |
式中, N为骆马湖表层沉积物微塑料的数量储存量; Ci为分区i的微塑料丰度平均值.
1.6 质量控制考虑到微塑料提取过程中的污染, 本实验采取严格的预防措施, 所有玻璃容器均经超声清洗, 并用铝箔覆盖.实验后检查纯水洗涤过滤后的3个空白滤纸以量化污染, 在空白滤纸中发现1~3根纤维并鉴定为羊毛, 表明实验室的污染可以忽略不计.
1.7 数据处理所有数据使用Origin 2019进行分析, 微塑料的时空分布通过Arc GIS 10.2进行可视化, 使用CANOCO 5的典型关联分析评估环境变量和微塑料成分之间的关系[24].
2 结果与分析 2.1 微塑料的丰度分布本研究在骆马湖的20个采样点发现了477个和338个微塑料, 丰度平均值在120~1 000 n·kg-1之间. 9月微塑料丰度平均值为(513±201) n·kg-1, 低于1月的(528±263) n·kg-1.如图 2所示, 和其他土地类型相比, 工业区、旅游区和农田区发现了较高的微塑料丰度.位于工业区的S11微塑料丰度平均值在9月为850 n·kg-1, 在1月为720 n·kg-1, 邳州市工业区和附近的农业排水可能是其污染源[25].旅游区的微塑料丰度平均值为515 n·kg-1和580 n·kg-1, 农田用地则为572 n·kg-1和730 n·kg-1, 均高于自然保护区的392 n·kg-1和306 n·kg-1.

|
图 2 骆马湖采样点和功能区表层沉积物中微塑料丰度 Fig. 2 Abundance of microplastics in surface sediments at sampling points and functional areas of Luoma Lake |
骆马湖表层沉积物微塑料尺寸以60~500 μm为主, 其占比在9月为58.7%, 在1月为51.1%. 9月是人工泄洪的重要时期, 大块塑料更容易发生破裂, 因此出现小粒径微塑料的可能性更高.如图 3所示, 9月嶂山闸前S3的小粒径微塑料(< 1 mm)占比为34.38%, 闸后S4处这一占比则增加到79.41%, 而大粒径微塑料(>3 mm)则从37.5%减少到2.94%.洋河滩闸小粒径微塑料占比则从闸前S7的63.16%增加到闸后S6的93.75%, 大粒径微塑料从5.26%减少到0.据骆马湖水利管理局和骆运水利工程管理处提供的水闸运行资料显示, 泄洪期间两座水闸的流量平均值分别为254 m3·s-1和39.5 m3·s-1.结果表明, 水闸流量越大, 闸后小粒径微塑料增加的比例则越大.相比之下, 冬季缺水的嶂山闸前后微塑料的粒径分布几乎相同, 水流剪切力带来的微塑料破碎效应得到了削弱.

|
图 3 夏季嶂山闸和洋河滩闸前后微塑料粒径分布 Fig. 3 Microplastic size distribution in front of and behind Zhangshan sluice and Yanghetan sluice in summer |
有研究指出, 人工洪水后下游微塑料的尺寸更小且数量更多[14], 急流打碎了大块塑料并增加了小颗粒塑料的比例, 这和骆马湖闸后微塑料粒径更小的发现相一致.如图 4所示, 骆马湖沉积物微塑料的扫描电镜图表明位于泄洪河道的站点(S3和S4)比湖心站点(S14)具有更复杂更粗糙的表面形态特征, 划痕更多, 碎片的脱落更加明显, 这进一步证明泄洪会加速微塑料的机械磨损和破碎.

|
图 4 骆马湖不同采样点沉积物中微塑料的扫描电子显微镜图像 Fig. 4 Scanning electron microscope images of microplastics in the sediments of different sampling points in Luoma Lake |
骆马湖表层沉积物中检测到4种不同形状的微塑料.总体而言, 纤维最常见, 其占比在9月为45.07%, 在1月为43.20%, 其次是碎片、薄膜和小球.在水产养殖区的纤维中, 1月大尺寸纤维(>2 mm)的比例比9月高40.17%, 而小尺寸纤维(< 500 μm)在禁渔区所占比例很高, 其占比在9月为16.92%, 在1月为35.48%.根据Wang等[26]提出的“微塑料特定源分类系统”, 小尺寸纤维来自人口稠密地区服装纤维的脱落, 大尺寸纤维则是渔网和渔绳的断裂, 且往往是透明的.因此, 冬季水产养殖区更活跃的渔业活动和南部城区的生活污水排放是造成纤维尺寸分布差异的重要原因.
2.2.3 微塑料的颜色分布沉积物中微塑料大部分是透明的, 其9月占比在48%~100%之间, 1月占比在34.48%~100%之间.此外, 蓝色和红色微塑料是最常检测到的, 其中大部分来自废弃渔线和污水厂排放的衣物纤维.有研究发现, 白色塑料由于长期暴露于自然环境中而趋于变成淡黄色[27].因此, 在通过白色、透明和淡黄色作为颜色依据来识别微塑料时, 存在由塑料变色而引起的丰度高估风险.
2.2.4 微塑料的聚合物成分本研究筛选出402个颗粒并进行鉴定, 占总数的49.33%, 典型微塑料样品的光镜图和显微红外光谱如图 5所示.除人造丝和纤维素很少被算作塑料外, 骆马湖沉积物微塑料主要成分为聚乙烯、尼龙、聚四氟乙烯和聚对苯二甲酸乙二醇酯, 占比分别为22.89%、9.20%、8.71%和7.21%.从时间分布来看(图 6), 调水期的聚乙烯占比下降, 聚对苯二甲酸乙二醇酯比例几乎不变, 尼龙和聚丙烯则增加了一倍.

|
图 5 典型微塑料样品光镜及其对应的红外光谱图 Fig. 5 Typical optical microscope pictures and infrared spectra of selected microplastic samples |

|
图 6 调水期和非调水期骆马湖沉积物微塑料聚合物组成分布 Fig. 6 Distribution of microplastic polymer composition in the sediments of Luoma Lake during the water transfer period and non-water transfer period |
骆马湖9月的沉积物微塑料丰度略低于1月, 有研究认为雨季充沛的降水会增加河流流量, 导致微塑料丰度降低[28], 骆马湖的嶂山闸在夏季成为泄洪通道, 而水动力不足的冬季则使得微塑料更有可能沉降至沉积物表面.S11有较高的微塑料丰度平均值, 除了可能存在的工业污染源外, 封闭的水域也会导致微塑料聚集, 这和先前研究发现半岛环流削弱了水交换, 加快微塑料富集的现象相似[10, 29].旅游区的高丰度微塑料反映了地区微塑料和人类娱乐活动之间的相关性, 青岛沙滩的研究也得到了类似结论[30, 31].而农耕使用的塑料制品如地膜和大棚则是农业用地微塑料污染水平高的成因, 青藏高原、丹江口水库支流河和汾河的调研证实了农田对微塑料的污染贡献[32~34].骆马湖沉积物微塑料丰度和其他淡水湖泊的比较见表 1, 其丰度平均值高于中国的太湖、鄱阳湖和雨山湖.骆马湖周围有9个城镇和数百万人口, 邳州工业区和宿迁化工园区也位于湖岸[16], 人类活动远比其他地方频繁, 潜在污染源更多.尽管有研究称污水处理厂对微塑料的去除率高达90%[35], 但污水的大量排放仍使得骆马湖微塑料污染处于较高水平.因此, 人口密集的城市和频繁的人类活动是骆马湖微塑料丰度高的重要原因.
|
|
表 1 全球湖泊沉积物中微塑料的分布 Table 1 Distribution of microplastics in lake sediments worldwide |
为解释土地利用类型、经济发展水平、人口和地理位置等环境变量对湖岸微塑料特征的影响, 本研究进行了典型的关联分析(如图 7).如果微塑料不同形状占比(实心)和环境变量(空心)的夹角是锐角, 则证明它们之间存在正相关, 且锐角越小, 相关性越高.在排除部分解释度较小的因素后, 结果表明1月自然用地面积和碎片微塑料间呈正相关, 农业用地和旅游用地面积和薄膜微塑料占比呈正相关, 同样的结论也适用于9月旅游用地和薄膜微塑料之间的关系.有研究表明农耕作业者通常不会从农田中清理塑料覆盖物, 且消耗的地膜数量和土壤中的塑料残留量之间存在显著线性关系[41].大部分留在田间的覆盖物分解为微塑料, 这解释了农田用地薄膜微塑料的高丰度.同时, 在靠近景区的湖岸搜集到塑料包装废弃物经鉴定为聚乙烯, 和大部分薄膜微塑料的成分一致, 证明了人类丢弃的包装袋是薄膜微塑料的来源.因此, 土地利用类型如农业和旅游用地会影响湖岸微塑料的形状分布.

|
图 7 1月环境变量和微塑料成分典型的关联分析 Fig. 7 Canonical correspondence analysis of environmental variables and the microplastic composition in January |
聚乙烯是骆马湖沉积物微塑料的主要成分, 其占比在9月为22.89%, 在1月为21.35%.在长江下游城市中, 除聚丙烯外, 聚乙烯是地表水中最常见的微塑料类型[17], 并且有可能通过调水工程迁移至骆马湖中.聚对苯二甲酸乙二醇酯常用于制造饮料容器和包装材料, 其纤维用于服装编织.和低质量且小体积的尼龙相似, 聚对苯二甲酸乙二醇酯较高的密度使其更容易沉降.聚四氟乙烯的制品通常用作电线的绝缘层和耐腐蚀的绝缘部件, 在骆马湖发现的聚四氟乙烯微塑料超过半数集中在宿迁化工园区的S3和S4, 其中涉及化工新材料生产的高污染企业可能是造成微塑料污染的潜在来源.
3.2 骆马湖表层沉积物微塑料的储存量尽管Cai等[20]关于微塑料储存量的计算原理对淡水湖泊的底泥适用, 但在计算单位海水微塑料的含量时, 缺少对微塑料体积和质量差异的考量, 得到的数据在一定程度上和实际情况存在偏差.基于此, 本研究根据形状估算单个微粒体积, 对微塑料储存量的计算方法进行改进, 估算出骆马湖单位沉积物的微塑料质量为0~30.27 mg·kg-1, 这和He等[42]研究中的0.18~129.20 mg·kg-1和Reineccius等[43]研究中的0~39 μg·(10 g)-1仅相差一个数量级.经计算, 骆马湖表层沉积物中微塑料的储存量分别为111.20 t(9月)和74.16 t(1月), 分别相当于5.67×10¹²个和5.42×10¹²个.
骆马湖沉积物微塑料的储存量低于桑沟湾的183.73 t[23], 造成这种差异的原因有两个.首先, 虽然骆马湖有着远大于桑沟湾的260 km2水域面积, 但其禁渔区或自然保护区面积超过一半, 且春季有长达5个月的禁渔期.而桑沟湾一直是中国最重要的水产养殖区之一, 因此骆马湖的渔业活动远不如桑沟湾活跃.其次, 作为南水北调东线工程上重要的蓄水湖, 骆马湖进出水频繁, 水流运动增加了微塑料迁移的可能性.另外, 本研究建议以微塑料的单位储存量而不是总量作为衡量微塑料储存水平的指标, 以便不同地区之间的比较.如表 2所示, 桑沟湾沿海水域的微塑料单位储存量最高, 而这一区域更接近人类集中生活的城市[23], 且数据表明港口运输业和渔业繁荣的中国台湾省高雄港也显示出较高的微塑料单位储存量[44].在本研究中, 禁渔区的微塑料单位储存量低于养殖区, 这是因为大量的水产养殖用具、渔具和人为丢弃的塑料垃圾进入湖中[45~47], 人类的渔业活动加剧了养殖区的微塑料污染, 极大地影响了微塑料的分布特征.
|
|
表 2 来自其他研究的沉积物中微塑料的储存量数据 Table 2 Storage of microplastics in the sediments from other studies |
3.3 调水工程对骆马湖表层沉积物微塑料的影响
本研究沿骆马湖西岸的调水路线设置了6个采样点, 包括4个上游站点(S5、S6、S8、S9)和2个下游站点(S1、S10), 以探究调水期和非调水期微塑料分布特征的差异性.作为南水北调东线工程的水利枢纽, 皂河泵站的抽水加剧了水力扰动, 被带动的水流会在泵站下游连续冲刷一定距离的沉积物表面.如图 8所示, 开始调水后上游沉积物中微塑料的丰度平均值从705 n·kg-1下降到653 n·kg-1, 而下游从530 n·kg-1增加到740 n·kg-1.这表明尽管调水工程使得表层沉积物微塑料有向北迁移的风险, 但在到达下一个泵站前实现了再沉降.有研究发现经过开坝造成的人工洪水后, 在远离大坝的地表水中检测到较高浓度的微塑料[13], 这和骆马湖中微塑料的迁移规律是一致的.

|
图 8 不同时期骆马湖沉积物中微塑料丰度和空间分布 Fig. 8 Abundance and spatial distribution of microplastics in Luoma Lake sediment during different periods |
骆马湖西北部的S1和S10距离泵站较远, 缺少允许输送微塑料的流体动力条件[48, 49].泵站带来的水流冲刷了上游表层沉积物, 促使其成为释放微塑料的“源”.随着和泵站距离的增加, 水流的动能逐渐减弱, 流速降低, 下游沉积物成为微塑料的“汇”.本研究对调水路线上6个采样点的聚合物成分进行了鉴定, 发现上游尼龙(1.00~1.13 g·cm-3)和聚对苯二甲酸乙二醇酯(1.55 g·cm-3)的比例在开始调水后保持不变, 而聚乙烯(0.96 g·cm-3)和聚丙烯(0.91 g·cm-3)的比例从39.6%下降到35%.开始调水后的S1处检测出了50%聚丙烯和聚乙烯的这类轻质微塑料, 这表明当南水北调东线工程向北调水时, 动能较大的上游水流卷起较轻的微塑料, 并将它们输送更远的距离.He等[50]的流体动力学和粒子传输模型表明, 尼龙和聚对苯二甲酸乙二醇酯等密度较高的微塑料可能会在靠近污染源的地方积聚, 而高流量则会输送更轻的微塑料, 这和在骆马湖的发现相一致.开始调水后微塑料的尺寸分布和未调水时存在显著差异, 沿线采样点中60~500 μm的微塑料在非调水期的比例(68.29%)接近调水期(36.67%)的两倍.开始调水后 < 2 mm的小尺寸微塑料比例从上游到下游依次从66.67% 增加到73.91%再到84%.调水工程缩短了上游的水力停留时间, 带走了小尺寸的微塑料, 随着和泵站距离的增加, 这部分微塑料失去了持续迁移的动能, 并在流速较低的下游重新沉降.
4 结论(1) 骆马湖表层沉积物9月微塑料丰度平均值为(513±201) n·kg-1, 低于1月的(528±263) n·kg-1, 其中工业区、旅游区和农田区均体现了较高的微塑料污染水平.
(2) 骆马湖微塑料主要是纤维, 聚合物成分主要是聚乙烯, 60~500 μm和透明的微塑料占比最高.
(3) 人工泄洪后, 闸后小尺寸微塑料的比例均高于闸前30%以上, 人为调控进出水导致的水流剪切力是加速微塑料破碎的驱动因素.
(4) 在调水的影响下, 小尺寸(< 2 mm)和低密度的微塑料(聚乙烯和聚丙烯)实现了再悬浮、迁移和再沉降的环境行为.
| [1] | Plastics-the facts 2020[EB/OL]. https://www.plasticseurope.org/en/resources/publications/4312-plastics-facts-2020, 2020-06-21. |
| [2] | Geyer R, Jambeck J R, Law K L. Production, use, and fate of all plastics ever made[J]. Science Advances, 2017, 3(7). DOI:10.1126/sciadv.1700782 |
| [3] | Jambeck J R, Geyer R, Wilcox C, et al. Plastic waste inputs from land into the ocean[J]. Science, 2015, 347(6223): 768-771. DOI:10.1126/science.1260352 |
| [4] | Lebreton L C M, Van Der Zwet J, Damsteeg J W, et al. River plastic emissions to the world's oceans[J]. Nature Communications, 2017, 8(1). DOI:10.1038/ncomms15611 |
| [5] | Zhang Y, Pu S Y, Lv X, et al. Global trends and prospects in microplastics research: a bibliometric analysis[J]. Journal of Hazardous Materials, 2020, 400. DOI:10.1016/j.jhazmat.2020.123110 |
| [6] | Cao Y X, Zhao M J, Ma X Y, et al. A critical review on the interactions of microplastics with heavy metals: mechanism and their combined effect on organisms and humans[J]. Science of the Total Environment, 2021, 788. DOI:10.1016/j.scitotenv.2021.147620 |
| [7] |
刘淑丽, 简敏菲, 周隆胤, 等. 鄱阳湖湿地候鸟栖息地微塑料污染特征[J]. 环境科学, 2019, 40(6): 2639-2646. Liu S L, Jian M F, Zhou L Y, et al. Pollution characteristics of microplastics in migratory bird habitats located within Poyang Lake wetlands[J]. Environmental Science, 2019, 40(6): 2639-2646. |
| [8] |
李文华, 简敏菲, 刘淑丽, 等. 鄱阳湖湖口-长江段沉积物中微塑料与重金属污染物的赋存关系[J]. 环境科学, 2020, 41(1): 242-252. Li W H, Jian M F, Liu S L, et al. Occurrence relationship between microplastics and heavy metals pollutants in the estuarine sediments of Poyang Lake and the Yangtze River[J]. Environmental Science, 2020, 41(1): 242-252. |
| [9] | Yuan W K, Liu X N, Wang W F, et al. Microplastic abundance, distribution and composition in water, sediments, and wild fish from Poyang Lake, China[J]. Ecotoxicology and Environmental Safety, 2019, 170: 180-187. DOI:10.1016/j.ecoenv.2018.11.126 |
| [10] | Teng J, Zhao J M, Zhang C, et al. A systems analysis of microplastic pollution in Laizhou Bay, China[J]. Science of the Total Environment, 2020, 745. DOI:10.1016/j.scitotenv.2020.140815 |
| [11] | Huang Y L, Tian M, Jin F, et al. Coupled effects of urbanization level and dam on microplastics in surface waters in a coastal watershed of Southeast China[J]. Marine Pollution Bulletin, 2020, 154. DOI:10.1016/j.marpolbul.2020.111089 |
| [12] | Wang C, Xing R L, Sun M D, et al. Microplastics profile in a typical urban river in Beijing[J]. Science of the Total Environment, 2020, 743. DOI:10.1016/j.scitotenv.2020.140708 |
| [13] | Zhang K, Xiong X, Hu H J, et al. Occurrence and characteristics of microplastic pollution in Xiangxi Bay of Three Gorges Reservoir, China[J]. Environmental Science & Technology, 2017, 51(7): 3794-3801. |
| [14] | Song J, Hou C Y, Zhou Y, et al. The flowing of microplastics was accelerated under the influence of artificial flood generated by hydropower station[J]. Journal of Cleaner Production, 2020, 255. DOI:10.1016/j.jclepro.2020.120174 |
| [15] |
赵存厚. 南水北调工程概述[J]. 水利建设与管理, 2021, 41(6): 5-9. Zhao C H. Summary of south-to-north water transfer project[J]. Water Conservancy Construction and Management, 2021, 41(6): 5-9. |
| [16] | Lu Y, Hua Z L, Chu K J, et al. Distribution behavior and risk assessment of emerging perfluoroalkyl acids in multiple environmental media at Luoma Lake, East China[J]. Environmental Research, 2021, 194. DOI:10.1016/j.envres.2021.110733 |
| [17] | Xiong X, Wu C X, Elser J J, et al. Occurrence and fate of microplastic debris in middle and lower reaches of the Yangtze River-from inland to the sea[J]. Science of the Total Environment, 2019, 659: 66-73. DOI:10.1016/j.scitotenv.2018.12.313 |
| [18] | Qu X, Chen Y S, Liu H, et al. A holistic assessment of water quality condition and spatiotemporal patterns in impounded lakes along the eastern route of China's south-to-north water diversion project[J]. Water Research, 2020, 185. DOI:10.1016/j.watres.2020.116275 |
| [19] |
王志超, 杨建林, 杨帆, 等. 乌梁素海冰盖中微塑料的分布特征及其与盐度、叶绿素a的响应关系[J]. 环境科学, 2021, 42(2): 673-680. Wang Z C, Yang J L, Yang F, et al. Distribution characteristics of microplastics in ice sheets and its response to salinity and chlorophyll a in the Lake Wuliangsuhai[J]. Environmental Science, 2021, 42(2): 673-680. |
| [20] | Cai M G, He H X, Liu M Y, et al. Lost but can't be neglected: huge quantities of small microplastics hide in the South China Sea[J]. Science of the Total Environment, 2018, 633: 1206-1216. DOI:10.1016/j.scitotenv.2018.03.197 |
| [21] | 集中式地表水饮用水水源地基础状况调查报告——宿迁市骆马湖洋河滩水源地突发环境事件应急预案[EB/OL]. http://hbj.suqian.gov.cn/shbj/hjyj/202010/f57dab07b9e740f0ac8e1bc755af1f22.shtml, 2020-10-30. |
| [22] | 江苏省国家级生态保护红线规划[EB/OL]. http://www.jiangsu.gov.cn/art/2018/6/26/art_46143_7715521.html, 2018-06-09. |
| [23] | Sui Q, Zhang L J, Xia B, et al. Spatiotemporal distribution, source identification and inventory of microplastics in surface sediments from Sanggou Bay, China[J]. Science of the Total Environment, 2020, 723. DOI:10.1016/j.scitotenv.2020.138064 |
| [24] | Niu L H, Li Y Y, Li Y, et al. New insights into the vertical distribution and microbial degradation of microplastics in urban river sediments[J]. Water Research, 2021, 188. DOI:10.1016/j.watres.2020.116449 |
| [25] |
王志超, 杨帆, 杨文焕, 等. 内蒙古河套灌区排水干沟微塑料赋存特征及质量估算[J]. 环境科学, 2020, 41(10): 4590-4598. Wang Z C, Yang F, Yang W H, et al. Occurrence characteristics and quality estimation of microplastics in drainage ditches in Hetao Irrigation District of Inner Mongolia[J]. Environmental Science, 2020, 41(10): 4590-4598. |
| [26] | Wang T, Zou X Q, Li B J, et al. Preliminary study of the source apportionment and diversity of microplastics: taking floating microplastics in the South China Sea as an example[J]. Environmental Pollution, 2019, 245: 965-974. DOI:10.1016/j.envpol.2018.10.110 |
| [27] | Zhang W W, Zhang S F, Wang J Y, et al. Microplastic pollution in the surface waters of the Bohai Sea, China[J]. Environmental Pollution, 2017, 231: 541-548. DOI:10.1016/j.envpol.2017.08.058 |
| [28] | Yan M T, Nie H Y, Xu K H, et al. Microplastic abundance, distribution and composition in the Pearl River along Guangzhou city and Pearl River estuary, China[J]. Chemosphere, 2019, 217: 879-886. DOI:10.1016/j.chemosphere.2018.11.093 |
| [29] | Jiang Y, Yang F, Zhao Y N, et al. Greenland Sea Gyre increases microplastic pollution in the surface waters of the Nordic Seas[J]. Science of the Total Environment, 2020, 712. DOI:10.1016/j.scitotenv.2019.136484 |
| [30] |
罗雅丹, 林千惠, 贾芳丽, 等. 青岛4个海水浴场微塑料的分布特征[J]. 环境科学, 2019, 40(6): 2631-2638. Luo Y D, Lin Q H, Jia F L, et al. Distribution characteristics of microplastics in Qingdao coastal beaches[J]. Environmental Science, 2019, 40(6): 2631-2638. |
| [31] | Gao F L, Li J X, Hu J, et al. The seasonal distribution characteristics of microplastics on bathing beaches along the coast of Qingdao, China[J]. Science of the Total Environment, 2021, 783. DOI:10.1016/j.scitotenv.2021.146969 |
| [32] | Feng S S, Lu H W, Liu Y L. The occurrence of microplastics in farmland and grassland soils in the Qinghai-Tibet plateau: different land use and mulching time in facility agriculture[J]. Environmental Pollution, 2021, 279. DOI:10.1016/j.envpol.2021.116939 |
| [33] |
潘雄, 林莉, 张胜, 等. 丹江口水库及其入库支流水体中微塑料组成与分布特征[J]. 环境科学, 2021, 42(3): 1372-1379. Pan X, Lin L, Zhang S, et al. Composition and distribution characteristics of microplastics in Danjiangkou Reservoir and its tributaries[J]. Environmental Science, 2021, 42(3): 1372-1379. |
| [34] |
朱宇恩, 文瀚萱, 李唐慧娴, 等. 汾河沿岸农田土壤微塑料分布特征及成因解析[J]. 环境科学, 2021, 42(8): 3894-3903. Zhu Y E, Wen H X, Li T H X, et al. Distribution and sources of microplastics in farmland soil along the Fenhe River[J]. Environmental Science, 2021, 42(8): 3894-3903. |
| [35] | Xu Z J, Bai X, Ye Z F. Removal and generation of microplastics in wastewater treatment plants: a review[J]. Journal of Cleaner Production, 2021, 291. DOI:10.1016/j.jclepro.2021.125982 |
| [36] | Su L, Xue Y G, Li L Y, et al. Microplastics in Taihu Lake, China[J]. Environmental Pollution, 2016, 216: 711-719. DOI:10.1016/j.envpol.2016.06.036 |
| [37] |
王璇, 牛司平, 宋小龙, 等. 城市湖泊沉积物微塑料污染特征[J]. 环境科学, 2020, 41(7): 3240-3248. Wang X, Niu S P, Song X L, et al. Characterization of microplastic pollution of sediments from urban lakes[J]. Environmental Science, 2020, 41(7): 3240-3248. |
| [38] | Yin L S, Wen X F, Du C Y, et al. Comparison of the abundance of microplastics between rural and urban areas: a case study from East Dongting Lake[J]. Chemosphere, 2020, 244. DOI:10.1016/j.chemosphere.2019.125486 |
| [39] | Egessa R, Nankabirwa A, Basooma R, et al. Occurrence, distribution and size relationships of plastic debris along shores and sediment of northern Lake Victoria[J]. Environmental Pollution, 2020, 257. DOI:10.1016/j.envpol.2019.113442 |
| [40] | Oni B A, Ayeni A O, Agboola O, et al. Comparing microplastics contaminants in (dry and raining) seasons for Ox- Bow Lake in Yenagoa, Nigeria[J]. Ecotoxicology and Environmental Safety, 2020, 198. DOI:10.1016/j.ecoenv.2020.110656 |
| [41] | Huang Y, Liu Q, Jia W Q, et al. Agricultural plastic mulching as a source of microplastics in the terrestrial environment[J]. Environmental Pollution, 2020, 260. DOI:10.1016/j.envpol.2020.114096 |
| [42] | He B B, Goonetilleke A, Ayoko G A, et al. Abundance, distribution patterns, and identification of microplastics in Brisbane River sediments, Australia[J]. Science of the Total Environment, 2020, 700. DOI:10.1016/j.scitotenv.2019.134467 |
| [43] | Reineccius J, Bresien J, Waniek J J. Separation of microplastics from mass-limited samples by an effective adsorption technique[J]. Science of the Total Environment, 2021, 788. DOI:10.1016/j.scitotenv.2021.147881 |
| [44] | Chen C F, Ju Y R, Lim Y C, et al. Seasonal variation of diversity, weathering, and inventory of microplastics in coast and harbor sediments[J]. Science of the Total Environment, 2021, 781. DOI:10.1016/j.scitotenv.2021.146610 |
| [45] | Mao R F, Hu Y Y, Zhang S Y, et al. Microplastics in the surface water of Wuliangsuhai Lake, northern China[J]. Science of the Total Environment, 2020, 723. DOI:10.1016/j.scitotenv.2020.137820 |
| [46] |
李征, 高春梅, 杨金龙, 等. 连云港海州湾海域表层水体和沉积物中微塑料的分布特征[J]. 环境科学, 2020, 41(7): 3212-3221. Li Z, Gao C M, Yang J L, et al. Distribution characteristics of microplastics in surface water and sediments of Haizhou Bay, Lianyungang[J]. Environmental Science, 2020, 41(7): 3212-3221. |
| [47] | Xue B M, Zhang L L, Li R L, et al. Underestimated microplastic pollution derived from fishery activities and "hidden" in deep sediment[J]. Environmental Science & Technology, 2020, 54(4): 2210-2217. |
| [48] | De Carvalho A R, Garcia F, Riem-Galliano L, et al. Urbanization and hydrological conditions drive the spatial and temporal variability of microplastic pollution in the Garonne River[J]. Science of the Total Environment, 2021, 769. DOI:10.1016/j.scitotenv.2020.144479 |
| [49] | Weideman E A, Perold V, Ryan P G. Limited long-distance transport of plastic pollution by the Orange-Vaal River system, South Africa[J]. Science of the Total Environment, 2020, 727. DOI:10.1016/j.scitotenv.2020.138653 |
| [50] | He B B, Smith M, Egodawatta P, et al. Dispersal and transport of microplastics in river sediments[J]. Environmental Pollution, 2021, 279. DOI:10.1016/j.envpol.2021.116884 |