 2022, Vol. 43

2. 浙江大学环境修复与生态健康教育部重点实验室, 杭州 310058;
3. 浙江大学浙江省亚热带土壤与植物营养重点实验室, 杭州 310058
 , HU Min-peng1,2 , WANG Ming-feng1,2 , ZHANG Yu-fu1,2 , WU Hao1,2 , ZHOU Jia1,2 , WU Kai-bin1,2 , DAI Zhi-zhou1,2 , CHEN Ding-jiang1,2,3
2. Ministry of Education Key Laboratory of Environment Remediation and Ecological Health, Zhejiang University, Hangzhou 310058, China;
3. Zhejiang Provincial Key Laboratory of Subtropical Soil and Plant Nutrition, Zhejiang University, Hangzhou 310058, China
随着活性氮污染负荷增加, 河流已成为很多地区大气氧化亚氮(N2O)的重要来源[1~3].明确河流水系的N2O释放量是实施区域N2O高效减排的关键科学基础.然而, 与土壤和湖泊等静态环境介质相比, 河流具有较大流动性, 使得河流N2O释放通量的时空变异性更加强烈, 准确估算河流水系的N2O释放量较为困难.例如, 不同研究对全球河流N2O的年际释放量估算结果为0.19~2.10 Tg·a-1[4~7], 存在1个数量级的巨大差异.因此, 准确估算河流水系N2O释放量是当前准确制定全球或区域人为N2O释放清单的关键[6, 8, 9].
目前, 河流水系N2O释放通量的估算主要采用排放因子法、漂浮通量箱法、水-气交换模型法和乙炔抑制法等[10].乙炔抑制法仅考虑反硝化产生的N2O[11], 且难以描述野外真实状况[12].排放因子法是当前全球或区域尺度估算河流水系N2O释放量的主要方法, 基于淋溶和径流流失氮污染负荷与排放因子相乘间接估算河流N2O释放量[13].尽管联合国政府间气候变化专门委员会(IPCC)对排放因子推荐值作了多次修正(现行的推荐值为0.002 6)[14], 但是单个排放因子推荐值忽略了巨大的时空异质性, 难以适用于某一河流水系的估算[15].漂浮通量箱法是利用漂浮通量箱中的气体浓度动态变化直接估算N2O释放通量的方法.尽管漂浮通量箱法的监测结果能较为真实地反映研究河流断面实时的N2O释放情况, 但人力成本高, 易受野外条件限制, 难以对整个河流水系进行监测[16].水-气模型法是基于N2O溶存浓度[ρ(N2O)]和水-气界面的气体交换速率间接估算N2O释放通量的方法[17].尽管水-气交换模型法能克服野外条件限制[10], 但气体交换速率的估算需要风速、流速和水深等水文气象数据, 而在实际应用中往往缺乏这些水文气象的实测数据, 导致估算结果存在较大不确定性[18].
总体而言, 由于监测成本高, 数据获取困难, 目前许多有关河流水系N2O释放量估算的研究对N2O释放通量或ρ(N2O)的监测次数较少(< 50次)和时间较短(< 2 a)[19~25], 难以较为全面地反映河流水系N2O产生及释放过程的时空变异性, 影响估算结果可靠性.因此, 在加强监测基础上, 进一步发展实用且可靠方法是提高河流水系N2O释放量估算结果可靠性的关键.
本文以我国东南地区典型河流水系——永安溪水系为研究对象, 基于逐月的水文水质及ρ(N2O)和释放通量监测结果, 分析了ρ(N2O)和释放通量变化特征及其主要影响因素, 构建了N2O释放通量估算的二元回归模型, 估算了永安溪水系N2O年释放量.本研究结果对推进我国东南地区典型河流水系N2O释放规律定量认识具有重要借鉴意义.
1 材料与方法 1.1 研究区概况永安溪(120°21′29″~121°03′38″ E, 28°30′48″~28°52′43″ N)为浙江省椒江水系上游区域, 位于浙江省台州市, 自仙居县经缙云县, 下游出口处距台州湾55 km.永安溪水系具有“源短流急、下游感潮”的特征, 是我国东南地区河流水系的典型代表[26].永安溪流域面积约为2 474 km2, 属于亚热带季风气候, 年平均气温约为17.4℃.年平均降雨量约为1 400 mm, 5~10月为丰水期, 其降雨约占全年的65%.流域内主要土地利用类型为林地、农地和城乡、工矿和人居地等发展用地, 其中农地约占流域面积的17%, 林地约占76%, 城乡、工矿和居民用地约占5%, 水域和草地约占2%.随着城市化进程的不断加快, 林地、水域和草地面积不断减少, 建设用地面积不断增加. 1980~2015年, 永安溪柏枝岙断面氮污染加剧, ρ(TN)、ρ(NH4+-N)和ρ(NO3--N)分别增加了68%、126%和402%[27].
1.2 采样与分析本研究选取永安溪水系布设的10个水文水质监测断面(图 1), 其对应集水区的农地和人居地面积比例范围分别为5%~34%和1%~31%(表 1). 2016-06~2019-07每4~8周对所有监测断面(图 1)完成1次监测分析.现场使用便携式水质检测仪(YSI Profession Plus, 美国YSI公司)测定溶解氧(DO)和水温等的指标, 利用StarlogV4(Unidata Inc.)测定各监测断面的流量.现场采集各监测断面多点混合水样1 L置于聚乙烯瓶中, 作为室内水质分析样品.现场采集各监测断面多点混合的水样25 mL置于提前装有6滴0.5 g·mL-1氯化锌的血清瓶中[28], 作为水体ρ(N2O)分析样品.所有水样置于放有冰块的恒温箱(< 4℃)中, 并于24 h内送往实验室完成相关指标测定.

|
图 1 永安溪水系区位与监测断面分布示意 Fig. 1 Location map and sampling sites of the Yonganxi River system |
|
|
表 1 永安溪水系各监测断面对应集水区的基本属性 Table 1 Basic catchment properties of mainstream and tributaries in Yonganxi River system |
水样中硝氮浓度[ρ(NO3--N)]测定采用紫外分光光度法(HJ/T 346-2007), 氨氮浓度[ρ(NH4+-N)]测定采用靛酚蓝比色法(HJ 536-2009), 总氮(TN)和可溶氮(DN)浓度测定采用碱性过硫酸钾消解紫外分光光度法(GB 11894-89), 可溶性有机碳(DOC)浓度采用TOC总氮/可溶氮分析仪(Jena multi N/C3100)测定.
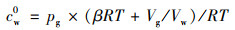
水样中ρ(N2O)的测定采用顶空平衡法[29]: 首先向血清瓶中注入一定体积的高纯氦气, 并抽出等体积的水样, 形成瓶内顶部空间; 剧烈振荡血清瓶, 使瓶内气液相平衡; 最后从瓶内抽出一定体积的气体样品, 并测定N2O浓度.按照式(1), 基于振荡环境参数及气体溶解度计算水样中ρ(N2O):
|
(1) |
式中, cw0为平衡前血清瓶中水相N2O浓度(mol·m-3); pg为顶空气体分压(Pa); β为N2O的本生系数; R为气体常量[8.314 J·(mol·K)-1]; T为振荡温度(K); Vg为气相体积(mL); Vw为水相体积(mL).
2018-07、2018-08、2019-07、2019-08和2021-01分别利用漂浮通量箱法现场测定SJY、HG和ZK支流N2O释放通量.将参考Minami等[30]设计的漂浮通量箱置于各个监测断面水面上(每个监测断面沿横截面左中右位置放置2~3个箱体), 每隔15 min抽取1次通量箱内的气体, 每次抽取100 mL气体于密封气袋并置于恒温箱(< 4℃)中, 带回实验室测定.利用每个样点的4次气体样品浓度差计算N2O释放通量[28].水样ρ(N2O)和气体样品N2O浓度均采用顶空-气相色谱法(GC-2010, 日本岛津)测定[31], 每个样品设置3次重复.
1.3 数据分析本研究采用ANONA单因素方差分析及多重比较方法(Turkey检验, P < 0.05表示有显著性)分析河流ρ(N2O)和释放通量以及各常规水质指标的时空差异显著性; 采用Spearman相关系数法进行河流ρ(N2O)和释放通量与各影响因素之间的相关性分析(P < 0.05表示显著相关); 采用多元回归分析方法建立河流N2O释放通量与相关影响因素及其组合之间的回归模型.所有统计分析采用SPSS 18.0软件(SPSS, Inc., USA).基于Google earth影像, 采用人工解译方法估算河流水系面积.本研究中各类作图采用Prism 8.0(GraphPad Software Inc.)和DataGraph(Visual Data Tools Inc.)软件.
2 结果与讨论 2.1 河流N2O溶存浓度时空变化特征2016-06~2019-07永安溪水系各个监测断面的平均ρ(N2O)为0.50 μg·L-1, 存在2个数量级的时空变异性(0.03~2.14 μg·L-1, 表 2).与很多已有研究结果类似[21, 32, 33], 永安溪流域河流ρ(N2O)与ρ(NO3--N)(r=0.50, P < 0.01)和ρ(NH4+-N)(r=0.36, P < 0.01)呈显著正相关.以上结果表明, 永安溪水系河流溶存的N2O可能主要通过硝化作用和反硝化作用产生[34, 35].河流ρ(N2O)与可溶性有机碳和无机氮质量比(C/N, r=-0.16, P < 0.05)呈显著负相关关系(图 2).由于硝化作用细菌通常为化能自养型细菌, 但在环境C/N较高的条件下, 异养细菌竞争NH4+的能力更强, 使得硝化细菌缺少反应底物, 从而降低硝化速率, 减少了N2O产生[36].
|
|
表 2 永安溪水系水质指标及ρ(N2O)的时空分布特征1) Table 2 Temporal and spatial variations in water quality indexes and ρ(N2O) in Yonganxi River system |

|
阴影部分为回归关系95%置信区间 图 2 永安溪水系ρ(N2O)与ρ(NO3--N)、ρ(NH4+-N)和碳氮比(C/N)的相关关系 Fig. 2 Relationships between ρ(N2O), ρ(NO3--N), ρ(NH4+-N), and carbon to nitrogen ratio in Yonganxi River system |
从时间变异性上看, 永安溪水系ρ(N2O)在春季和冬季(均值: 0.51 μg·L-1; 范围: 0.10~2.14 μg·L-1)显著高于夏季和秋季(均值: 0.40 μg·L-1; 范围: 0.03~1.39 μg·L-1, P < 0.05, 图 3).这主要与河流氮污染的季节性差异有关(表 2).永安溪水系春季和冬季的ρ(NO3--N)和ρ(NH4+-N)均显著高于夏季和秋季的(P < 0.05).由于春季和冬季的温度偏低, 植被覆盖较少, 因此, 不同景观对氮的同化能力较低, 导致河流氮污染加重[37].同时, 春季和冬季时, 河流处于平水期或枯水期, 而夏季和秋季河流处于平水期或丰水期, 即受到稀释作用影响, 使得春季和冬季的河流ρ(N2O)相对较高.

|
图 3 永安溪水系干流和支流的流量和ρ(N2O)的季节性差异 Fig. 3 Seasonal differences in river water discharge and ρ(N2O) for mainstream and river water discharge and ρ(N2O) for tributaries in Yonganxi River system |
从空间变异性上看, 永安溪水系支流监测断面的ρ(N2O)(均值: 0.55 μg·L-1; 范围: 0.16~2.14 μg·L-1, P < 0.05, 表 2)显著高于干流的(均值: 0.44 μg·L-1; 范围: 0.03~1.76 μg·L-1).相对于干流, 由于支流的流量较小和水深较浅, 单位水体体积的河床接触面积较大, 且稀释作用较小, 使得硝化和反硝化反应速率较高, 导致N2O产生速率及ρ(N2O)较大[7, 38, 39].从不同支流监测断面的差异性上看, 对应集水区农地和人居地面积比例较高的监测断面(SJY和HG)河流ρ(N2O)(均值: 0.69 μg·L-1; 范围: 0.16~1.98 μg·L-1)显著高于面积比例较低的河流(ZK、XZT、GL和BT, 均值: 0.48 μg·L-1; 范围: 0.17~2.14 μg·L-1, P < 0.05).由于人类活动的影响, 集水区农地和人居地面积比例较大的支流监测断面的ρ(NO3--N)和ρ(NH4+-N)显著高于面积比例较低的支流(表 2), 从而直接影响ρ(N2O)的差异性.
2.2 河流N2O释放通量空间变化特征2018-07~2021-01永安溪水系SJY、HG和ZK监测断面5次通量箱法监测的N2O释放通量均值为23.93 μg·(m2·h)-1, 存在1个数量级的变异性[范围: 1.32~82.79 μg·(m2·h)-1].河流N2O释放通量与ρ(N2O)(r=0.93, P < 0.05)和流量(r=0.34, P < 0.05)呈显著正相关, 但与ρ(NO3--N)和ρ(NH4+-N)等因素相关性低(P>0.05), 这意味着河流N2O释放通量可能主要受释放能力影响[40, 41].河流ρ(N2O)直接决定了水体的N2O饱和度以及水-气界面ρ(N2O)梯度, 从而影响N2O从河流水体向大气的释放强度.随着河流流量增大, 水体物理扰动增强, 从而促进N2O的逃逸, 提高N2O释放通量[42].尽管无显著性差异(可能由于监测样本较少), 但是对应集水区农地和人居地面积比例较大的监测断面, N2O释放通量总体高于农地和人居地面积占比较小的监测断面位, 这主要是受不同监测断面的ρ(N2O)差异性影响(图 4和表 1).

|
图 4 永安溪水系部分监测断面的ρ(N2O)及N2O释放通量空间差异性 Fig. 4 Spatial differences of ρ(N2O) and flux across several sampling sites in Yonganxi River system |
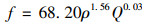
以上的分析结果表明, 永安溪水系N2O释放通量主要受河流流量与N2O浓度的影响.因此, 应用多元回归统计方法, 综合分析了多种河流流量和N2O浓度作为自变量的组合形式, 按照拟合精度(R2和NSE系数值), 筛选出以下基于幂函数形式的二元回归模型为最优:
|
(2) |
式中, f为N2O释放通量[μg·(m2·h)-1], ρ为N2O浓度(μg·L-1), Q为河流流量(m3·s-1).
式(2)模拟的河流N2O释放通量值与实测值之间的R2=0.90且NSE=0.82(n=26), 意味着模型具有较高的精度[图 5(a)].与排放因子法相比, 式(2)综合考虑了河流N2O浓度和水文等条件, 使得估算结果更加可靠.与漂浮通量箱法相比, 式(2)克服了应用漂浮通量箱法过程中人力成本高和受野外条件限制等缺点.与水-气交换模型法相比, 式(2)克服了水气交换系数估算的不确定性问题.与应用SWAT-F(N2O)模型估算Naoli河流水系N2O释放量的研究相比(R2: 0.51~0.79, NSE: 0.45~0.65)[43], 式(2)不仅形式简单, 所需数据少, 而且具有较高精度.

|
阴影部分为回归关系95%置信区间 图 5 永安溪水系N2O释放通量实测值与模拟值拟合关系及N2O释放通量模拟结果 Fig. 5 Relationship between measured and modeled N2O emission fluxes and temporal variation of modeled N2O emission fluxes in Yonganxi River system |
式(2)模拟的2016-06~2019-07永安溪水系N2O释放通量为(27.60±27.58)μg·(m2·h)-1 [范围: 0.31~224.95 μg·(m2·h)-1], 其中干流的年均N2O释放通量为(22.02±17.82)μg·(m2·h)-1[范围: 0.31~181.38 μg·(m2·h)-1], 支流的年均N2O释放通量为(31.42±32.10)μg·(m2·h)-1 [范围: 3.83~224.95 μg·(m2·h)-1].相对于干流, 支流的流量低及水位浅, 使得水-气交换速率较快, 且其各类氮浓度总体较高(表 2).因此, 同一河流水系的支流N2O释放通量显著高于干流的, 即随着河流级数的增加N2O释放通量降低[38, 44].
为估算未监测支流的N2O释放量, 对集水区中农地+人居地面积比例>35%的未监测支流, 采用式(2)模拟的SJY和HG支流释放通量平均值估算; 对农地+人居地面积比例 < 35%的未监测支流, 采用式(2)模拟的XZT、GL、BT和ZK支流的释放通量平均值估算.基于以上假设及式(2)模拟结果, 估算的永安溪水系N2O年均释放量为3.67 t·a-1(表 3).干流水面面积占全水系总水面面积的38%, 贡献了29%的N2O释放量; 各支流总水面面积占全水系总水面面积的62%, 贡献了71%的N2O释放量.因此, 支流是永安溪水系N2O减排的重点.然而, 基于IPCC排放因子推荐值(0.002 6)估算的永安溪水系N2O年均释放量为11.94 t·a-1, 这是基于式(2)估算结果的3.25倍.尤其是干流, 基于IPCC排放因子推荐值的N2O释放量估算值是式(2)估算结果的6.48倍.从不同支流看(表 3), IPCC排放因子推荐值的方法大大低估了集水区农地和人居地面积比例较高的支流(SJY和HG)的N2O释放量, 而大大高估了集水区农地和人居地面积比例较低的支流(ZK、XZT、GL和BT).以上研究结果表明, IPCC的排放因子推荐值方法忽略了时空异质性, 会高估受人类活动影响较小河流的N2O释放量, 但低估了受人类活动影响较大河流的N2O释放量[3, 45].
|
|
表 3 基于式(2)和IPCC释放因子推荐值的永安溪水系干支流N2O释放量估算结果比较 Table 3 Estimated annual N2O emission quantities from mainstream and tributaries of the Yonganxi River system based on the formula (2) and the default value of emission factor recommended by IPCC |
3 结论
(1) 永安溪水系监测的ρ(N2O)具有2个数量级的时空变异性, 总体为: 冬季和春季>夏季和秋季; 支流>干流, 主要受ρ(NO3--N)、ρ(NH4+-N)和C/N的影响.对应集水区农地和人居地面积比例较大的监测断面ρ(N2O)显著高于面积比例较小的.
(2) 永安溪水系监测的N2O释放通量存在1个数量级的时空变异性, 主要受ρ(N2O)和流量的影响.对应集水区农地和人居地面积比例较大的监测断面的N2O释放通量高于面积比例较小的.
(3) 基于河流流量和ρ(N2O)建立的二元回归模型具有较高的精度, 克服了人力成本高、受野外条件限制和中间参数估算困难等不足, 为较准确地估算河流水系N2O释放通量提供了参考方法.
(4) 永安溪水系的N2O年均释放量为3.67 t·a-1(29%来自于干流, 71%来自于支流).支流N2O释放通量显著高于干流的, 是河流水系N2O减排的关键.IPCC的排放因子推荐值方法会高估受人类活动影响小的河流N2O释放量, 但会低估受人类活动影响大的河流N2O释放量.
| [1] | Yan W J, Yang L B, Wang F, et al. Riverine N2O concentrations, exports to estuary and emissions to atmosphere from the Changjiang River in response to increasing nitrogen loads[J]. Global Biogeochemical Cycles, 2012, 26(4). DOI:10.1029/2010GB003984 |
| [2] | Yu Z J, Deng H G, Wang D Q, et al. Nitrous oxide emissions in the Shanghai river network: implications for the effects of urban sewage and IPCC methodology[J]. Global Change Biology, 2013, 19(10): 2999-3010. DOI:10.1111/gcb.12290 |
| [3] | Qin X B, Li Y, Goldberg S, et al. Assessment of indirect N2O emission factors from agricultural river networks based on long-term study at high temporal resolution[J]. Environmental Science & Technology, 2019, 53(18): 10781-10791. |
| [4] | Mosier A, Kroeze C, Nevison C, et al. Closing the global N2O budget: nitrous oxide emissions through the agricultural nitrogen cycle[J]. Nutrient cycling in Agroecosystems, 1998, 52(2-3): 225-248. |
| [5] | Nevison C. Review of the IPCC methodology for estimating nitrous oxide emissions associated with agricultural leaching and runoff[J]. Chemosphere-Global Change Science, 2000, 2(3-4): 493-500. DOI:10.1016/S1465-9972(00)00013-1 |
| [6] | Hu M P, Chen D J, Dahlgren R A. Modeling nitrous oxide emission from rivers: a global assessment[J]. Global Change Biology, 2016, 22(11): 3566-3582. DOI:10.1111/gcb.13351 |
| [7] | Yao Y Z, Tian H Q, Shi H, et al. Increased global nitrous oxide emissions from streams and rivers in the Anthropocene[J]. Nature Climate Change, 2020, 10(2): 138-142. DOI:10.1038/s41558-019-0665-8 |
| [8] | Beaulieu J J, Tank J L, Hamilton S K, et al. Nitrous oxide emission from denitrification in stream and river networks[J]. Proceedings of the National Academy of Sciences of the United States of America, 2011, 108(1): 214-219. DOI:10.1073/pnas.1011464108 |
| [9] | Maavara T, Lauerwald R, Laruelle G G, et al. Nitrous oxide emissions from inland waters: Are IPCC estimates too high?[J]. Global Change Biology, 2019, 25(2): 473-488. DOI:10.1111/gcb.14504 |
| [10] |
晏维金, 王蓓, 李新艳, 等. 河流溶存N2O的环境化学过程及其在水-气界面交换过程的研究[J]. 农业环境科学学报, 2008, 27(1): 15-22. Yan W J, Wang B, Li X Y, et al. Summary of studies on environmental chemical process of dissolved N2O in rivers and the exchange flux between water-air interface[J]. Journal of Agro-Environment Science, 2008, 27(1): 15-22. DOI:10.3321/j.issn:1672-2043.2008.01.002 |
| [11] | Seitzinger S P, Nielsen L P, Caffrey J, et al. Denitrification measurements in aquatic sediments: a comparison of three methods[J]. Biogeochemistry, 1993, 23(3): 147-167. DOI:10.1007/BF00023750 |
| [12] | Risgaard-Petersen N, Skårup S, Nielsen L P. Denitrification in a soft bottom lake: evaluation of laboratory incubations[J]. Aquatic Microbial Ecology, 1999, 17(3): 279-287. |
| [13] | Hama-Aziz Z Q, Hiscock K M, Cooper R J. Indirect nitrous oxide emission factors for agricultural field drains and headwater streams[J]. Environmental Science & Technology, 2017, 51(1): 301-307. |
| [14] | De Klein C, Novoa R S A, Ogle S, et al. Chapter 11: N2O emissions from managed soils, and CO2 emissions from lime and urea application[A]. 2019 Refinement to the 2006 IPCC Guidelines for National Greenhouse Gas Inventories[M]. Japan: IPCC, 2019. 26. |
| [15] | Zhang W S, Li H P, Xiao Q T, et al. Surface nitrous oxide (N2O) concentrations and fluxes from different rivers draining contrasting landscapes: Spatio-temporal variability, controls, and implications based on IPCC emission factor[J]. Environmental Pollution, 2020, 263. DOI:10.1016/J.ENVPOL.2020.114457 |
| [16] | Wu S, Chen J, Li C, et al. Diel and seasonal nitrous oxide fluxes determined by floating chamber and gas transfer equation methods in agricultural irrigation watersheds in southeast China[J]. Environmental Monitoring and Assessment, 2018, 190(3). DOI:10.1007/s10661-018-6502-0 |
| [17] | Watts S H, Seitzinger S P. Denitrification rates in organic and mineral soils from riparian sites: a comparison of N2 flux and acetylene inhibition methods[J]. Soil Biology and Biochemistry, 2000, 32(10): 1383-1392. DOI:10.1016/S0038-0717(00)00056-0 |
| [18] | Hinshaw S E, Dahlgren R A. Dissolved nitrous oxide concentrations and fluxes from the eutrophic San Joaquin River, California[J]. Environmental Science & Technology, 2013, 47(3): 1313-1322. |
| [19] | Harrison J, Matson P. Patterns and controls of nitrous oxide emissions from waters draining a subtropical agricultural valley[J]. Global Biogeochemical Cycles, 2003, 17(3). DOI:10.1029/2002GB001991 |
| [20] | Silvennoinen H, Liikanen A, Rintala J, et al. Greenhouse gas fluxes from the eutrophic Temmesjoki River and its estuary in the Liminganlahti Bay (the Baltic Sea)[J]. Biogeochemistry, 2008, 90(2): 193-208. DOI:10.1007/s10533-008-9244-1 |
| [21] | Beaulieu J J, Arango C P, Hamilton S K, et al. The production and emission of nitrous oxide from headwater streams in the Midwestern United States[J]. Global Change Biology, 2008, 14(4): 878-894. DOI:10.1111/j.1365-2486.2007.01485.x |
| [22] | Outram F N, Hiscock K M. Indirect nitrous oxide emissions from surface water bodies in a lowland arable catchment: a significant contribution to agricultural greenhouse gas budgets?[J]. Environmental Science & Technology, 2012, 46(15): 8156-8163. |
| [23] | Vilain G, Garnier J, Tallec G, et al. Indirect N2O emissions from shallow groundwater in an agricultural catchment (Seine Basin, France)[J]. Biogeochemistry, 2012, 111(1-3): 253-271. DOI:10.1007/s10533-011-9642-7 |
| [24] | Audet J, Hoffmann C C, Andersen P M, et al. Nitrous oxide fluxes in undisturbed riparian wetlands located in agricultural catchments: emission, uptake and controlling factors[J]. Soil Biology and Biochemistry, 2014, 68: 291-299. DOI:10.1016/j.soilbio.2013.10.011 |
| [25] | Mwanake R M, Gettel G M, Aho K S, et al. Land use, not stream order, controls N2O concentration and flux in the upper Mara River basin, Kenya[J]. Journal of Geophysical Research: Biogeosciences, 2019, 124(11): 3491-3506. DOI:10.1029/2019JG005063 |
| [26] |
张柏发, 陈丁江. 1980~2010年浙江某典型河流硝态氮通量对净人类活动氮输入的动态响应[J]. 环境科学, 2014, 35(8): 2911-2919. Zhang B F, Chen D J. Dynamic response of riverine nitrate flux to net anthropogenic nitrogen inputs in a typical river in Zhejiang Province over the 1980-2010 period[J]. Environmental Science, 2014, 35(8): 2911-2919. |
| [27] | Hu M P, Zhang Y F, Wu K B, et al. Assessment of streamflow components and hydrologic transit times using stable isotopes of oxygen and hydrogen in waters of a subtropical watershed in eastern China[J]. Journal of Hydrology, 2020, 589. DOI:10.1016/J.JHYDROL.2020.125363 |
| [28] | Hinshaw S E, Dahlgren R A. Nitrous oxide fluxes and dissolved N gases (N2 and N2O) within riparian zones along the agriculturally impacted San Joaquin River[J]. Nutrient Cycling in Agroecosystems, 2016, 105(2): 85-102. DOI:10.1007/s10705-016-9777-y |
| [29] |
高洁, 郑循华, 王睿, 等. 漂浮通量箱法和扩散模型法测定内陆水体CH4和N2O排放通量的初步比较研究[J]. 气候与环境研究, 2014, 19(3): 290-302. Gao J, Zheng X H, Wang R, et al. Preliminary comparison of the static floating chamber and the diffusion model methods for measuring water-atmosphere exchanges of methane and nitrous oxide from inland water bodies[J]. Climatic and Environmental Research, 2014, 19(3): 290-302. |
| [30] | Minami K, Fukushi S. Methods for measuring N2O flux from water surface and N2O dissolved in water from agricultural land[J]. Soil Science and Plant Nutrition, 1984, 30(4): 495-502. DOI:10.1080/00380768.1984.10434716 |
| [31] |
田琳琳, 王正, 胡磊, 等. 长江上游典型农业源溪流溶存氧化亚氮(N2O)浓度特征及影响因素[J]. 环境科学, 2019, 40(4): 1939-1949. Tian L L, Wang Z, Hu L, et al. Characteristics of the dissolved nitrous oxide (N2O) concentrations and influencing factors in a representative agricultural headwater stream in the upper reach of the Yangtze River[J]. Environmental Science, 2019, 40(4): 1939-1949. |
| [32] | Cole J J, Caraco N F. Emissions of nitrous oxide (N2O) from a tidal, freshwater river, the Hudson River, New York[J]. Environmental Science & Technology, 2001, 35(6): 991-996. |
| [33] | Clough T J, Buckthought L E, Kelliher F M, et al. Diurnal fluctuations of dissolved nitrous oxide (N2O) concentrations and estimates of N2O emissions from a spring-fed river: implications for IPCC methodology[J]. Global Change Biology, 2007, 13(5): 1016-1027. DOI:10.1111/j.1365-2486.2007.01337.x |
| [34] | Dunfield P F, Topp E, Archambault C, et al. Effect of nitrogen fertilizers and moisture content on CH4 and N2O fluxes in a humisol: measurements in the field and intact soil cores[J]. Biogeochemistry, 1995, 29(3): 199-222. DOI:10.1007/BF02186048 |
| [35] |
路俊玲, 陈慧萍, 肖琳. 温度和氨氮浓度对水体N2O释放的影响[J]. 中国环境科学, 2019, 39(1): 330-335. Lu J L, Chen H P, Xiao L. Coupling effect of temperature and ammonia on N2O emission in surface water[J]. China Environmental Science, 2019, 39(1): 330-335. DOI:10.3969/j.issn.1000-6923.2019.01.038 |
| [36] | Strauss E A, Lamberti G A. Regulation of nitrification in aquatic sediments by organic carbon[J]. Limnology and Oceanography, 2000, 45(8): 1854-1859. DOI:10.4319/lo.2000.45.8.1854 |
| [37] | Weber G, Honecker U, Kubiniok J. Nitrate dynamics in springs and headwater streams with agricultural catchments in southwestern Germany[J]. Science of the Total Environment, 2020, 722. DOI:10.1016/j.scitotenv.2020.137858 |
| [38] | Turner P A, Griffis T J, Lee X, et al. Indirect nitrous oxide emissions from streams within the US Corn Belt scale with stream order[J]. Proceedings of the National Academy of Sciences of the United States of America, 2015, 112(32): 9839-9843. DOI:10.1073/pnas.1503598112 |
| [39] | Borges A V, Darchambeau F, Lambert T, et al. Effects of agricultural land use on fluvial carbon dioxide, methane and nitrous oxide concentrations in a large European river, the Meuse (Belgium)[J]. Science of the Total Environment, 2018, 610-611: 342-355. DOI:10.1016/j.scitotenv.2017.08.047 |
| [40] | Chen J S, Cao W Z, Cao D, et al. Nitrogen loading and nitrous oxide emissions from a river with multiple hydroelectric reservoirs[J]. Bulletin of Environmental Contamination and Toxicology, 2015, 94(5): 633-639. DOI:10.1007/s00128-015-1525-5 |
| [41] | Marzadri A, Tonina D, Bellin A, et al. A hydrologic model demonstrates nitrous oxide emissions depend on streambed morphology[J]. Geophysical Research Letters, 2014, 41(15): 5484-5491. DOI:10.1002/2014GL060732 |
| [42] | Butman D, Raymond P A. Significant efflux of carbon dioxide from streams and rivers in the United States[J]. Nature Geoscience, 2011, 4(12): 839-842. DOI:10.1038/ngeo1294 |
| [43] | Gao X, Ouyang W, Lin C Y, et al. Considering atmospheric N2O dynamic in SWAT model avoids the overestimation of N2O emissions in river networks[J]. Water Research, 2020, 174. DOI:10.1016/j.watres.2020.115624 |
| [44] | Marzadri A, Dee M M, Tonina D, et al. Role of surface and subsurface processes in scaling N2O emissions along riverine networks[J]. Proceedings of the National Academy of Sciences of the United States of America, 2017, 114(17): 4330-4335. DOI:10.1073/pnas.1617454114 |
| [45] | Xiao Q T, Xu X F, Zhang M, et al. Coregulation of nitrous oxide emissions by nitrogen and temperature in China's third largest freshwater lake (Lake Taihu)[J]. Limnology and Oceanography, 2019, 64(3): 1070-1086. DOI:10.1002/lno.11098 |