 2021, Vol. 42

2. 自然资源部地球化学探测重点实验室, 廊坊 065000;
3. 国土资源部长沙矿产资源监督检测中心, 长沙 410007
 , WANG Zhen-liang1,2 , GAO Jian-weng1,2 , YAN Hui3 , HU Shu-qi1,2 , TANG Shi-xin1,2 , GONG Jing-jing1,2
2. Key Laboratory of Geochemical Exploration, Ministry of Natural Resources, Langfang 065000, China;
3. Changsha Mineral Resources Supervision and Inspection Center, Ministry of Land and Resources, Changsha 410007, China
随着人们对农产品的需求量不断增大, 农业种植园的集约程度显著提高, 集约化生产体系已经成为我国农业生产的重要组成部分.在种植园集约化管理过程中如施肥、除草、地膜覆盖以及高密度种植等活动会直接或间接引起农作物重金属含量的累积[1, 2].重金属进入食物链不仅影响食品质量安全, 还会进一步威胁人类健康.人体摄入过量的重金属会诱发痛痛病、肌肉萎缩和免疫系统损害等健康疾病[3, 4].因此, 对集约化管理模式下农作物重金属生态风险的评价不可或缺.危害系数法[5, 6]是通过评价单一或多种重金属摄入而导致的人体健康风险, 能够区分和评估重金属对居民的非致癌风险及致癌风险, 广泛应用于预防人类接触环境中的污染介质.Ali等[7]分析了沙特地区蔬菜中7种重金属含量, 并指出绿叶蔬菜比其它类蔬菜更易富集重金属, 表明长期食用绿叶蔬菜需要考虑其重金属摄入量.徐明芳等[8]通过检测食用菌中重金属含量, 认为不同食用菌对重金属富集能力差异大, 其中As和Cd是食用菌对居民健康风险的主要贡献者.Wei等[5]测定了北京市13种食品的重金属含量, 认为谷物是日常摄入Cd、Cr、Cu、Fe、Mn、Pb和Zn元素的主要来源, 但该地区这些元素的摄入并不会造成健康风险.尽管还有很多研究关注国内外农作物中重金属的含量和安全风险评估[9~12], 但研究对象往往较单一, 覆盖面窄.集约化种植园作为农产品生产源头, 提供大量直接食用或加工的农作物, 相关重金属健康风险研究较为缺乏.
海南是我国主要的热带农作物生产基地, 随着脱贫攻坚任务的完成以及企业、种植户的常年投入, 许多种植园具有较高的集约化程度和种植规模, 是研究种植园农作物重金属富集特征的理想基地.本研究在海口、澄迈、东方、琼中和三亚这5县市选取当地集约化管理程度较高的种植园, 共采集6类39种农作物合计673件, 采用电感耦合等离子体质谱技术(ICP-MS)分析其重金属含量, 从环境地球化学角度评估不同农作物中可食用部分重金属累积差异和居民膳食暴露风险, 以期为海南省种植园集约化管理和农作物食品风险防控提供帮助.
1 材料与方法 1.1 采样原则2019年10~11月和2020年4~11月, 于海口、澄迈、东方、琼中和三亚这5县市典型种植园采集当季农作物样品, 选取的园区均有3 a以上的种植史.根据种植园面积布置采样数量, 0.02 km2(约30亩)以内种植园采集样品1~3件, 30亩以上种植园按照每10~20亩一件样品采集, 同一种植园采样不超过10件.每件样品在范围约100 m2内, 根据五点采样法原则采集组合样品3~5 kg, 采样点分布见图 1.

|
图 1 采样点分布示意 Fig. 1 Location of the sampling sites |
果蔬类样品: 选取可食用部分, 使用自来水去除附着表面的杂质, 再用去离子水冲刷3次, 沥去水分并自然晾晒15 min后称重.使用陶瓷刀将样品切成0.5~1 cm大小的细块状、条状, 后置于60℃烘箱烘至干燥, 称量并计算含水量.干样用高速破碎机制成粉样, 样品通过40~60目尼龙筛, 用纸袋套塑料袋封装保存; 籽类样品: 选取可食用的足量试样, 称量后于烘箱60℃烘干, 称干基质量.用高速破碎机制成粉样, 用纸袋外套塑料袋封装待测.
农作物中重金属限量标准多以鲜重表示, 在制备样品时需计算农作物含水量:

|
(1) |
准确称取样品(0.500±0.001)g, 置于微波消解罐中, 加入3~5 mL硝酸, 加盖放置1 h进行消解.待消解罐冷却后取出, 缓慢打开罐盖排气, 用少量水冲洗内盖, 将消解罐放在控温电热板上, 于100℃加热30 min提取样品, 加水定容至25 mL或50 mL容量瓶中, 混匀备用.配制浓度梯度为0、1.00、5.00、10.00、30.00、50.00和100 ng ·mL-1的与样品基体匹配的Cd、Pb、Cr、Cu、Zn、As和Hg混合标准溶液.选取待测指标合适分析同位素, 采用Sc/Ge/Rh/Re混合内标, 使用Thermo scientific生产的ICAP RQ型电感耦合等离子体质谱仪进行分析, 同时做空白实验.
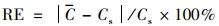
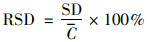
1.3.2 质量控制673件农作物样品按照1:1进行重复性分析, 测试结果符合技术标准[13]方可使用.同时采用国家一级标准物质(GBW 10011和GBW 10048)进行质量监控, 每份样品平行分析8次, 计算分析平均值与标准物质推荐值的相对误差(RE), 计算单个标准样品8份分析的精密度(相对标准偏差, RSD):
|
(2) |
|
(3) |
式中, C为测试结果平均值, Cs为标准物质推荐值, SD为测试结果标准差.方法检出限及计算的RE和RSD见表 1.
|
|
表 1 重金属元素测试检出限、准确度及精密度 Table 1 Detection limits, relative error(RE), and relative standard deviation(RSD)for heavy metal elements |
1.4 评价模型 1.4.1 农作物重金属污染评价方法及质量分级标准
单因子指数(Pi)与内梅罗综合指数(P)[14]是评价农作物重金属污染程度普遍使用的评价方法, 具体表示为:

|
(4) |

|
(5) |
式中, Ci为农作物重金属含量(mg ·kg-1, 鲜重), Co为重金属元素限量标准(各元素参考标准见表 2), Pi为单因子指数, 反映重金属富集程度.P为单因子指数平均值, Pmax为单因子指数最大值, P为内梅罗综合指数.
|
|
表 2 谷物、蔬菜和水果中重金属元素限量卫生标准1) Table 2 Food sanitation standard limit of heavy metal elements in corps, vegetables, and fruits |
单因子指数与内梅罗综合指数均可以分为5个等级: P≤0.7为安全级; 0.7<P≤1.0为警戒级; 1.0<P≤2.0为轻度污染; 2.0<P≤3.0为中度污染; P>3.0为重度污染.
1.4.2 健康风险评价-非致癌风险评价风险系数(HQ)和危害指数(HI)[5, 17]常用于评价重金属经口摄入后的非致癌风险, 计算公式为:

|
(6) |

|
(7) |
式中, EDI为重金属每日摄入量估计值, C为农作物重金属含量, IR为农作物日均消耗量估计值, 各估计值采用文献[18]推荐范围的中位值.EF为重金属暴露天数, ED为暴露年限, BW为人体平均体重, AT为非致癌暴露时间, RfD为经口摄入非致癌风险参考剂量, 各参数见表 3.危害指数(HI)为多种重金属共同作用产生风险系数之和, 当HI<1时为可接受风险, HI>1表示可能存在健康风险.
|
|
表 3 健康风险值计算参数 Table 3 Parameter values for the calculation of healthy risk |
1.4.3 健康风险评价-致癌风险评价
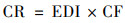
致癌风险系数(CR)[20]用于评价重金属经口摄入所导致的终身致癌风险, 表达式为:
|
(8) |
式中, CF为致癌转换因子, 目前有证据表明, 重金属中致癌元素主要为Pb、As和Cd[21, 22], 这3种元素对应的CF值分别为0.008 5[19]、1.5[22]和6.1[23].根据美国环境保护局标准, CR<1×10⁻⁴为可接受标准, CR>1×10⁻⁴表示存在终身致癌风险.
2 结果与讨论 2.1 海南岛种植园农作物中重金属含量水平农作物重金属含量(鲜重)见图 2. 39种农作物可食用部分Cu、Pb、Zn和Cr平均含量分别为1.383、0.077、4.913和0.350 mg ·kg-1, Cd、As和Hg平均含量分别为14.887、17.980和0.499 μg ·kg-1.可见, 农作物中各重金属含量差异大, 其中以Zn和Cu含量最高, 而Hg、Cd和As含量较低.不同种类农作物对7种重金属的累积也存在差异, 其中Cu在花生、辣椒和毛豆中的含量较高, 而在西瓜、木瓜和小白菜中含量较低; Pb在木薯和花生中含量较高, 在芽苗菜、木瓜和无花果中含量较低; Zn在花生、毛豆和玉米中的含量较高, 是低含量农作物莲雾和瓠瓜的13倍以上; 秋葵、花生和辣椒中Cd的含量, 地瓜、花生和黄瓜中As的含量以及花生、小白菜和地瓜中Hg的含量均较高, 而木瓜、荔枝和芒果等水果中Cd、As和Hg的含量相对较低(图 2).整体而言, 豆类7种重金属含量要明显高于其余5种农作物; 薯类农作物要相对富集Pb、As和Hg; 谷类、绿叶蔬菜和非绿叶蔬菜分别相对富集Zn、Cr和Cd元素; 水果类整体具有较低的重金属含量(图 2).由于不同农作物对重金属的吸收和富集能力不同[9, 24, 25], 导致不同种类农作物中重金属含量差异大.此外, 农作物中的Pb元素主要来自土壤, 经根系转运至植物地面部分, 这会导致块根类农作物优先富集Pb元素[26].而Hg元素不仅来自土壤, 大气和灌溉水也是其重要来源[27, 28], 绿叶蔬菜相对于非绿叶蔬菜具有更大的叶片量, 暴露在空气中面积多而更易富集Hg.由于土壤和果实之间存在更多的障碍有效阻止了重金属的转运[29, 30], 导致水果类重金属含量普遍较低.因此, 农作物的暴露途径也是重金属含量的控制因素.然而, 植物重金属累积不仅取决于农作物种类和暴露途径, 还包括生长年限[31]、栽培土壤性质[32]以及重金属有效态含量[33, 34]等多重因素综合作用.

|
箭头值表示标准误差线端元值, 虚线表示安全警戒线(P=1) 图 2 谷物, 蔬菜和水果可食用部分重金属含量及对应内梅罗综合指数 Fig. 2 Heavy metals in the edible parts of different crops, vegetables, and fruits, and the corresponding Nemero index |
为更直观地表现研究区农作物重金属含量, 选取受众人口较多的珠三角、长三角和黄海沿岸等地种植园农作物做对比, 结果见表 4.可以看出, 研究区谷类中的7种重金属含量均低于珠三角地区和长三角地区.豆类中Pb、Cd和Cr与珠三角地区结果相当.绿叶蔬菜中Cu、Pb和Zn含量与南京有机蔬菜种植园、山西大棚蔬菜种植基地以及黄海沿岸温室种植园结果接近, 而Cr、Cd、As和Hg含量相对较低.非绿叶蔬菜中Cu、Zn和Hg与其它地区结果相当; Pb和As含量高于南京有机蔬菜种植园但低于珠三角地区和山西大棚蔬菜种植基地; Cd含量高于南京有机蔬菜种植园和山西大棚蔬菜种植基地, 但低于珠三角地区.水果类中As和Zn略高于珠三角地区与孟加拉国, 其它重金属含量则相对较低.就研究区内而言, 存在少数重金属含量较高的农作物, 但与其它研究结果相比, 研究区农作物重金属含量总体不高.
|
|
表 4 海南农作物重金属含量与其它地区研究结果比较(鲜重)1) Table 4 Comparison of contents of heavy metals in crops from different studies(fresh weight) |
2.3 39种农作物重金属超标情况
参考农作物重金属限量值(表 2), 海南集约化种植园中673件农作物超标情况见表 5.可以看出, 所测样品Cu、As和Hg均未超标, Pb、Zn、Cr和Cd也具有较低的超标率, 分别为2.67%、3.71%、2.53%和3.71%.其中Zn超标的样品全部为水果类植物, 由于参考标准中Zn的限量仅为5 mg ·kg-1, 远低于其它类农作物, 而这一标准在2011年已废止.随着人们对锌元素营养价值认识的提高, 高锌水果或许能作为日常膳食补充剂.极少量的水果类、薯类和豆类存在Pb超标, 这可能与种植园土壤的Pb含量以及园区管理方式有关; 尽管Cd的超标只在部分非绿叶蔬菜(辣椒、秋葵)和水果(波罗蜜)中发现, 但Cd却是重金属引起肺癌和前列腺癌的主要贡献者[3, 21].因此, 在各种农作物的栽培过程中, 需要注意对应污染物的防控.
|
|
表 5 农作物样品重金属超标统计 Table 5 Heavy metal proportions in crop samples exceeding the acceptable limits |
Cr的超标主要集中在绿叶蔬菜类.Fan等[37]通过研究大棚种植的绿叶蔬菜发现, 其种植土壤具有较低的Cr浓度, 而所种植蔬菜的Cr含量均超过国家标准, 认为绿色蔬菜Cr的超标与其自身具有较强的富集Cr的能力相关.此外, 本次绿叶蔬菜样品集中在海口种植园采集, 琼北土壤中高Cr背景[40]也可能是其过量累积的来源之一.前人关于绿叶蔬菜中Cr超标的报道较多, 如珠三角地区绿叶蔬菜Cr超标率为17%[35]; 山西大棚蔬菜种植基地中绿叶蔬菜中Cr平均含量达到6.1 mg ·kg-1[37], 远超标准限定值0.5 mg ·kg-1; 广州市116件市售蔬菜样品测试结果显示, 绿叶蔬菜中Cr含量最高, 蔬菜Cr超标率达91.67%[16].可见, 绿叶蔬菜中Cr超标较为普遍, 栽培土壤、灌溉水、化肥和农药等都是其Cr元素的潜在来源.因此, 相关部门应加强绿叶蔬菜的重金属污染溯源和监管力度, 降低农作物重金属污染.
2.4 农作物重金属污染评价对39种农作物中7种重金属进行单因子指数(表 6)和内梅罗综合指数(图 2)评价.单因子污染指数结果显示, Cu、As和Hg元素均在安全警戒线1.0以下; 百香果中的Zn与辣椒中的Cd处于警戒级; 秋葵中的Cd和珍珠菜中的Cr为中度污染; 韭菜、苋菜、小白菜和小葱中的Cr和木薯中的Pb为重度污染.综合污染指数结果显示, 花生、百香果和辣椒处于警戒级; 珍珠菜处于轻度污染级; 小葱、小白菜和苋菜处于中度污染级; 木薯和韭菜处于重度污染级; 其余29种农作物均为安全级别.总体来看, 农作物中重金属污染程度为: 绿叶蔬菜类>薯类>非绿叶蔬菜类>豆类>水果类>谷类.可见, 处于污染级别的农作物主要为绿叶蔬菜类(图 2).绿叶蔬菜类叶片上分布着大量气孔, 其表面高蒸发量易导致污染物在叶菜中积累[16].
|
|
表 6 农作物重金属单因子指数 Table 6 Single factor evaluation of heavy metals in crops |
2.5 农作物健康风险评价
根据中国居民膳食指南(2016)推荐的各类农作物摄入量中位值[18], 计算海南农作物重金属摄入量、风险系数、危害系数和致癌风险.
结果显示, 6类农作物重金属日摄入量平均值Zn、Cu、Cr、Pb、As、Cd和Hg依次降低, Zn和Cu是其主要贡献者, 平均含量分别占据73%和18%(图 3).除绿叶蔬菜Cr的EDI值超出RfD值外, 其余元素均远小于RfD值, 重金属日摄入量大小依次为: 非绿叶蔬菜类>绿叶蔬菜类>豆类>谷类>水果类>薯类.风险系数显示, 绿叶蔬菜Cr元素HQ值大于1, 其它农作物重金属风险系数均小于1, 表明居民经膳食摄入绿叶蔬菜会导致Cr暴露接触而产生非致癌风险, 摄入其它类农作物不会产生非致癌风险.危害系数结果显示, 绿叶蔬菜Cr元素贡献了HI值的93%(图 4), 导致HI值大于1, 表明食用足量绿叶蔬菜具有潜在健康风险.因此, 绿叶蔬菜种植园在集约化管理过程中需要考虑Cr的防控.薯类、非绿叶蔬菜类、豆类、水果类和谷类农作物的危害指数(HI)均小于1, 其健康风险处于可接受范围, 表明这5类农作物更适合集约化生产.因此, 当地居民可以食用更多的这几类农作物用于代替绿叶蔬菜, 以减少潜在的重金属摄入风险.

|
圆环表示6类农作物中重金属日摄入量平均值占比 图 3 当地居民重金属日摄入量(EDI) Fig. 3 Daily intake of heavy metals by local residents |

|
虚线表示非致癌风险警戒线(HI=1) 图 4 居民膳食摄入谷物、蔬菜和水果所致危害系数 Fig. 4 Carcinogenic risk of the consumption of crops, vegetables, and fruits by local residents |
终身致癌风险评价显示(图 5), Pb的CR值依次为: 薯类>绿叶蔬菜>非绿叶蔬菜>水果类>豆类>谷类; As和Cd的CR值依次为: 非绿叶蔬菜类>绿叶蔬菜类>豆类>薯类>水果类>谷类, 均远低于美国环保署规定的1×10⁻⁴.

|
虚线表示终身致癌风险参考值 图 5 居民膳食摄入谷类、蔬菜和水果致癌风险 Fig. 5 Hazard index of the consumption of crops, vegetables, and fruits by local residents |
本研究存在影响风险评估结果的不确定因素.首先, 将谷物和果蔬摄入的总重金属水平作为人体的真实吸收值, 以此获得的评估结果会高于实际值[41].其次, 本研究没有通过实地调查获得当地有关农作物食用的详细数据, 只是采用各类农作物食用总量, 以文献[18]推荐摄入量为数据参考, 计算暴露值.而部分地区居民农作物(主要为果蔬类)实际摄入量不同程度低于推荐量[42], 同样会导致对健康风险的过高估计.因此, 对目标地区进行更具体、更详细的重金属暴露风险评估, 需要进行更全面的实地调查.
3 结论(1) 海南集约化种植园中采集的673件植物样品中Cu、As和Hg的含量远低于国家食品卫生标准限定值, Pb、Zn、Cr和Cd的超标率分别为2.67%、3.71%、2.53%和3.71%.超标元素主要为韭菜、苋菜、小白菜、小葱和珍珠菜中的Cr, 木薯、花生、菠萝蜜和龙眼中的Pb以及辣椒和秋葵中的Cd.
(2) 采集的39种农作物污染程度主体表现为: 绿叶蔬菜类>薯类>非绿叶蔬菜类>豆类>水果类>谷类.受到重金属污染的农作物主要有绿叶蔬菜中的韭菜、苋菜、小白菜、小葱、珍珠菜和薯类中的木薯.
(3) 健康风险评估表明, 种植园绿叶蔬菜中Cr的风险系数显著高于其它5类农作物, 存在潜在非致癌风险.叶类蔬菜的危害指数高于1, 表明经口摄入足量叶类蔬菜会导致潜在健康风险. 6类农作物中Pb、As和Cd的致癌风险均低于限定值, 表明Pb、As和Cd摄入导致的致癌风险处于可接受程度.
| [1] | Hu W Y, Huang B, Shi X Z, et al. Accumulation and health risk of heavy metals in a plot-scale vegetable production system in a peri-urban vegetable farm near Nanjing, China[J]. Ecotoxicology and Environmental Safety, 2013, 98: 303-309. DOI:10.1016/j.ecoenv.2013.09.040 |
| [2] | Li F L, Yuan J, Sheng G D. Altered transfer of heavy metals from soil to Chinese cabbage with film mulching[J]. Ecotoxicology and Environmental Safety, 2012, 77: 1-6. DOI:10.1016/j.ecoenv.2011.10.019 |
| [3] | Timofeev I, Kosheleva N, Kasimov N. Health risk assessment based on the contents of potentially toxic elements in urban soils of Darkhan, Mongolia[J]. Journal of Environmental Management, 2019, 242: 279-289. |
| [4] | Kim H S, Kim Y J, Seo Y R. An overview of carcinogenic heavy metal: Molecular toxicity mechanism and prevention[J]. Journal of Cancer Prevention, 2015, 20(4): 232-240. DOI:10.15430/JCP.2015.20.4.232 |
| [5] | Wei J X, Cen K. Assessment of human health risk based on characteristics of potential toxic elements(PTEs)contents in foods sold in Beijing, China[J]. Science of the Total Environment, 2020, 703. DOI:10.1016/j.scitotenv.2019.134747 |
| [6] | Chen Y, Hu W Y, Huang B, et al. Accumulation and health risk of heavy metals in vegetables from harmless and organic vegetable production systems of China[J]. Ecotoxicology and Environmental Safety, 2013, 98: 324-330. DOI:10.1016/j.ecoenv.2013.09.037 |
| [7] | Ali M H H, Al-Qahtani K M. Assessment of some heavy metals in vegetables, cereals and fruits in Saudi Arabian markets[J]. The Egyptian Journal of Aquatic Research, 2012, 38(1): 31-37. DOI:10.1016/j.ejar.2012.08.002 |
| [8] |
徐明芳, 岳甜, 傅利军, 等. 微波消解-电感耦合等离子体-质谱法同步检测白玉菇中Pb、As、Cd及其健康风险评估[J]. 食品科学, 2020, 41(24): 333-339. Xu M F, Yue T, Fu L J, et al. Simultaneous determination of Pb, As, and Cd in white Hypsizygus marmoreus by microwave digestion-inductively coupled plasma-mass spectrometry and health risk assessment[J]. Food Science, 2020, 41(24): 333-339. DOI:10.7506/spkx1002-6630-20200613-184 |
| [9] | Tomno R M, Nzeve J K, Mailu S N, et al. Heavy metal contamination of water, soil and vegetables in urban streams in Machakos municipality, Kenya[J]. Scientific African, 2020, 9. DOI:10.1016/j.sciaf.2020.e00539 |
| [10] |
王艳敏, 周鸿, 熊丽, 等. 江西省食品中镍含量调查与健康风险评估[J]. 现代预防医学, 2020, 47(15): 2724-2728. Wang Y M, Zhou H, Xiong L, et al. Nickel content of food and health risk assessment of dietary nickel, Jiangxi[J]. Modern Preventive Medicine, 2020, 47(15): 2724-2728. |
| [11] | Liu J H, Cao L, Dou S Z. Trophic transfer, biomagnification and risk assessments of four common heavy metals in the food web of Laizhou Bay, the Bohai Sea[J]. Science of the Total Environment, 2019, 670: 508-522. DOI:10.1016/j.scitotenv.2019.03.140 |
| [12] | Li X Y, Li Z G, Lin C J, et al. Health risks of heavy metal exposure through vegetable consumption near a large-scale Pb/Zn smelter in central China[J]. Ecotoxicology and Environmental Safety, 2018, 161: 99-110. DOI:10.1016/j.ecoenv.2018.05.080 |
| [13] | DD2005-03, 生态地球化学评价样品分析技术要求(试行)[S]. |
| [14] |
杨国义, 罗薇, 高家俊, 等. 广东省典型区域蔬菜重金属含量特征与污染评价[J]. 土壤通报, 2008, 39(1): 133-136. Yang G Y, Luo W, Gao J J, et al. Heavy metal contents and pollution evaluation in vegetables in Guangdong Province[J]. Chinese Journal of Soil Science, 2008, 39(1): 133-136. DOI:10.3321/j.issn:0564-3945.2008.01.026 |
| [15] | GB 2762-2017, 食品安全国家标准食品中污染物限量[S]. |
| [16] |
陈志良, 黄玲, 周存宇, 等. 广州市蔬菜中重金属污染特征研究与评价[J]. 环境科学, 2017, 38(1): 389-398. Chen Z L, Huang L, Zhou C Y, et al. Characteristics and evaluation of heavy metal pollution in vegetables in Guangzhou[J]. Environmental Science, 2017, 38(1): 389-398. |
| [17] | Xu D C, Zhou P, Zhan J, et al. Assessment of trace metal bioavailability in garden soils and health risks via consumption of vegetables in the vicinity of Tongling mining area, China[J]. Ecotoxicology and Environmental Safety, 2013, 90: 103-111. DOI:10.1016/j.ecoenv.2012.12.018 |
| [18] | 中国营养学会. 中国居民膳食指南[M]. 北京: 人民卫生出版社, 2016. |
| [19] | United States Environmental Protection Agency(USEPA). Risk based screening table. Composite table: summary tab 0615[EB/OL]. http://www2.epa.gov/risk/risk based screening table generic tables, 2015-12-01. |
| [20] | Sawut R, Kasim N, Maihemuti B, et al. Pollution characteristics and health risk assessment of heavy metals in the vegetable bases of northwest China[J]. Science of the Total Environment, 2018, 642: 864-878. DOI:10.1016/j.scitotenv.2018.06.034 |
| [21] | Zhang X, Yang L, Li Y, et al. Impacts of lead/zinc mining and smelting on the environment and human health in China[J]. Environmental Monitoring & Assessment, 2012, 184(4): 2261-2273. |
| [22] | 刘帆. 城市再生水灌区作物重金属健康风险评估研究[D]. 北京: 中国农业科学院, 2008. |
| [23] | Antoniadis V, Antoniadis S M, Levizou E, et al. A critical prospective analysis of the potential toxicity of trace element regulation limits in soils worldwide: Are they protective concerning health risk assessment?-A review[J]. Environment International, 2019, 127: 819-847. DOI:10.1016/j.envint.2019.03.039 |
| [24] | Ullah R, Muhammad S. Heavy metals contamination in soils and plants along with the mafic-ultramafic complex(Ophiolites), Baluchistan, Pakistan: evaluation for the risk and phytoremediation potential[J]. Environmental Technology & Innovation, 2020, 19. DOI:10.1016/j.eti.2020.100931 |
| [25] | Enya O, Lin C X, Qin J H. Heavy metal contamination status in soil-plant system in the Upper Mersey Estuarine Floodplain, Northwest England[J]. Marine Pollution Bulletin, 2019, 146: 292-304. DOI:10.1016/j.marpolbul.2019.06.026 |
| [26] | 黄玉源, 黄益宗, 李秋霞, 等. 广州市污水灌溉对菜地土壤和蔬菜的影响[J]. 环境化学, 2005, 24(6): 731-732. DOI:10.3321/j.issn:0254-6108.2005.06.027 |
| [27] | Ao M, Meng B, Sapkota A, et al. The influence of atmospheric Hg on Hg contaminations in rice and paddy soil in the Xunyang Hg mining district, China[J]. Acta Geochimica, 2017, 36(2): 181-189. DOI:10.1007/s11631-017-0142-x |
| [28] | Obrist D, Agnan Y, Jiskra M, et al. Tundra uptake of atmospheric elemental mercury drives Arctic mercury pollution[J]. Nature, 2017, 547(7662): 201-204. DOI:10.1038/nature22997 |
| [29] | Sun F F, Wang F H, Wang X, et al. Soil threshold values of total and available cadmium for vegetable growing based on field data in Guangdong province, South China[J]. Journal of the Science of Food and Agriculture, 2013, 93(8): 1967-1973. DOI:10.1002/jsfa.6000 |
| [30] |
李非里, 刘丛强, 杨元根, 等. 贵阳市郊菜园土-辣椒体系中重金属的迁移特征[J]. 生态与农村环境学报, 2007, 23(4): 52-56. Li F L, Liu C Q, Yang Y G, et al. Characteristics of heavy metal transportation in vegetables soil and capsicum system in Guiyang, Southwest China[J]. Journal of Ecology and Rural Environment, 2007, 23(4): 52-56. DOI:10.3969/j.issn.1673-4831.2007.04.012 |
| [31] |
周国华, 曾道明, 贺灵, 等. 福建铁观音茶园生态地球化学特征[J]. 中国地质, 2015, 42(6): 2008-2018. Zhou G H, Zeng D M, He L, et al. Eco-geochemical characteristics of the Tieguany in tea gardens in Fujian Province[J]. Geology in China, 2015, 42(6): 2008-2018. |
| [32] | Liu B L, Ai S W, Zhang W Y, et al. Assessment of the bioavailability, bioaccessibility and transfer of heavy metals in the soil-grain-human systems near a mining and smelting area in NW China[J]. Science of the Total Environment, 2017, 609: 822-829. DOI:10.1016/j.scitotenv.2017.07.215 |
| [33] | Cui J, Wang W Q, Peng Y, et al. Effects of simulated Cd deposition on soil Cd availability, microbial response, and crop Cd uptake in the passivation-remediation process of Cd-contaminated purple soil[J]. Science of the Total Environment, 2019, 683: 782-792. DOI:10.1016/j.scitotenv.2019.05.292 |
| [34] | Shen X, Huang D Y, Ren X F, et al. Phytoavailability of Cd and Pb in crop straw biochar-amended soil is related to the heavy metal content of both biochar and soil[J]. Journal of Environmental Management, 2016, 168: 245-251. |
| [35] | Zheng S N, Wang Q, Yuan Y Z, et al. Human health risk assessment of heavy metals in soil and food crops in the Pearl River Delta urban agglomeration of China[J]. Food Chemistry, 2020, 316. DOI:10.1016/j.foodchem.2020.126213 |
| [36] | Chen H Y, Yuan X Y, Li T Y, et al. Characteristics of heavy metal transfer and their influencing factors in different soil-crop systems of the industrialization region, China[J]. Ecotoxicology and Environmental Safety, 2016, 126: 193-201. DOI:10.1016/j.ecoenv.2015.12.042 |
| [37] | Fan Y, Li H, Xue Z J, et al. Accumulation characteristics and potential risk of heavy metals in soil-vegetable system under greenhouse cultivation condition in Northern China[J]. Ecological Engineering, 2017, 102: 367-373. DOI:10.1016/j.ecoleng.2017.02.032 |
| [38] | Hu W Y, Huang B, Tian K, et al. Heavy metals in intensive greenhouse vegetable production systems along Yellow Sea of China: levels, transfer and health risk[J]. Chemosphere, 2017, 167: 82-90. DOI:10.1016/j.chemosphere.2016.09.122 |
| [39] | Shaheen N, Irfan N M, Khan I N, et al. Presence of heavy metals in fruits and vegetables: Health risk implications in Bangladesh[J]. Chemosphere, 2016, 152: 431-438. DOI:10.1016/j.chemosphere.2016.02.060 |
| [40] | 海南省地质调查院. 中国区域地质志海南志[M]. 北京: 地质出版社, 2017. |
| [41] | Pan X D, Wu P G, Jiang X G. Levels and potential health risk of heavy metals in marketed vegetables in Zhejiang, China[J]. Scientific Reports, 2016, 6. DOI:10.1038/srep20317 |
| [42] |
黄婕, 何洁仪, 梁伯衡, 等. 广州市城区居民蔬菜水果消费现状[J]. 职业与健康, 2017, 33(2): 179-182. Huang J, He J Y, Liang B H, et al. Status of vegetables and fruits consumption among urban residents in Guangzhou City[J]. Occupation and Health, 2017, 33(2): 179-182. |