 2024, Vol. 45


2. 河海大学浅水湖泊综合治理与资源开发教育部重点实验室, 南京 210098;
3. 河海大学计算机与信息学院, 南京 211100
2. Key Laboratory of Integrated Regulation and Resource Development on Shallow Lake of Ministry of Education, Hohai University, Nanjing 210098, China;
3. College of Computer and Information, Hohai University, Nanjing 211100, China
长江口作为我国第一大河口[1], 自然条件优越, 水体自净能力强[2], 是我国经济发展的重要贡献地[3], 也是高新技术产业的集群地[4, 5], 同时也是上海市及苏南地区的优质水源地[6 ~ 8].长江口作为一个河流与海洋交汇区, 受到径流和潮流的双重作用[9], 水力条件与水环境特征复杂多变.由于工业排放持续向海洋河口地区高频率、高流量地运输污染物[10], 河口环境因子变化剧烈, 长江口生态系统的结构有明显的脆弱性和敏感性[11, 12].为保证长江口地区生态环境的可持续发展, 对长江口各项水质因子的实测资料进行现状分析、建立数学模型进行水质预测具有重要意义.
化学需氧量、高锰酸盐指数、氨氮、总氮和总磷等都是地表水环境质量标准的评价指标, 也是区域水质治理的规划目标和水质管理的基础标准[13 ~ 16], 对这些水质指标进行内在关系的探究是水质评价的基础和根本.基于统计学习理论的随机森林(random forest, RF)是近几年迅速发展起来的一种分类和预测模型, 为水质评价研究提供了一条新的途径[17 ~ 19].随机森林还可以评估每个水质指标对于预测指标的重要性, 容纳了评价指标间内在关系和进行水质预测两种功能[20, 21].张颖等[22]用此分类算法对巢湖水质类别判定;邹佳奇等[23]以此方法分析水质目标约束下污染源对环境容量影响的非线性关系;王涌等[24]发现随机森林模型相较于其他模型在快速BOD预测中有明显优势.人工神经网络(artificial neural networks, ANN)作为一种学习复杂函数映射能力较强的模型, 同样在水质评价和预测中发挥着重要作用[25 ~ 27].它通过模仿人脑神经元的连接方式, 可以捕捉和建模水质数据中的复杂线性或非线性关系, 从而为决策者提供精准的水质状态评价.此外, 还有改进粒子群优化(particle swarm optimization, PSO)算法等先进的优化技术被应用于水质模型的选择和优化过程中[28].Fu等[29]使用PSO优化的支持向量回归(support vector regression, SVR)模型对采矿选矿废水COD进行预测, 提出PSO-SVR模型是铜钼矿选矿废水处理COD预测的最佳模型.
本研究利用RF算法的重要性评价功能, 选定水体自净的指标溶解氧作为目标变量, 进行长江口水质指标之间内在关系的进一步探究, 以期为长江口环境监测中水质数据的预判、环境评价领域数据合理性审核等提供参考.使用改进粒子群支持向量回归算法(PSO-SVR)、人工神经网络(ANN)和随机森林(RF)这3种机器学习模型, 对长江口溶解氧浓度进行对比预测分析, 以期为建立水质预测高精度模型提供依据.
1 材料与方法 1.1 研究区域长江口是一段由岛屿、沙洲组成的多支分汊河段, 约为120 km长, 90 km宽, 长江口区域位置如图 1所示.作为世界第三大河口、我国最大河口, 长三角不仅是我国经济发展的密集区, 也是发展高精尖技术的重要区域.自改革开放以来, 以长三角为代表的产业集聚深深影响着我国经济发展.长三角地区各项经济指标占比位居全国前列, 在创新发展中发挥着重要引领作用.长江水资源丰富, 自净能力强, 河口水质整体符合GB 3838-2002地表水Ⅱ类标准.目前, 上海80%的饮用水来自青草沙、陈行和东风西沙水源地.长江口在城市发展中发挥着重要作用[30 ~ 33].

|
图 1 长江口区域位置示意 Fig. 1 Location of the Yangtze River Estuary Region |
选择徐六泾、南通港、启东港、青龙港、南港和北港这6个长江口代表性水质监测点位作为研究对象, 选取的输入变量为水温(T)、pH、氨氮(NH4+-N)、总氮(TN)、总磷(TP)、高锰酸盐指数和5日生化需氧量(BOD)这7个水质因子, 选取的目标变量为溶解氧, 对各个监测点位自2004年以来的逐月水质监测数据进行分析.数据来源为长江水利委员会长江口水文水资源勘测局.其中, 徐六泾、南通港、南港和北港的数据为2004~2020年逐月监测数据, 启东港数据为2006~2020年逐月监测数据, 青龙港数据为2010~2020年逐月监测数据.监测资料执行《水环境监测规范》(SL219-2013)及《长江水利委员会水文局水环境监测技术补充规定》(2017年修订版)等规定, 超标限根据《地表水环境质量标准》(GB 3838-2002)Ⅲ类标准执行.
1.3 水质评价方法与预测模型综合考虑选择了机器学习中常用且建模完备的3种模型:PSO-SVR提供了一种强大的回归技术, 通过PSO的全局搜索能力进行优化;ANN通过其网络结构提供了一个灵活的非线性建模框架, 能够捕捉复杂模式;而RF是一种集成方法, 擅长处理数据的非线性和交互效应, 而不会过度拟合.因此采用PSO-SVR、ANN和RF 3种算法分别构建水质指数预测模型, 上述模型均通过Matlab 2018a构建.构建机器学习模型后, 对数据集进行拆分, 取75%的数据集样本量作为训练集, 剩余25%样本量作为测试集.3种机器学习算法原理概述如图 2所示.

|
图 2 支持向量机、人工神经网络及随机森林原理示意 Fig. 2 Particle swarm optimization-support vector regression, artificial neural networks, and random forest |
支持向量机(SVM)是基于结构风险最小化原理的机器学习算法[34], 而SVR是SVM中的一个重要的应用分支, 属于预测拟合模型[35].首先进行SVR的γ值(核函数选型)和惩罚系数α的确定.此处在传统上一般使用网格搜索法来确定γ和α值[36].类似于二分法的搜索方法可以在网格精度确定的情况下获得较为准确的选值情况, 但是类似于一维数据的二分搜索, 容易丢失数据最优极值并且计算时间较长.由于SVR最佳参数范围不定, 因此需要设计合适的全局和局部搜索能力才能兼顾计算时间和精确度.在本文中, 为优化SVR参数确定使用了优化算法PSO.对于网格搜索算法来说, 参数的全局搜索能力过强会导致搜索时间过长, 局部搜索能力过强会导致搜索精度不高.PSO则通过迭代逐步搜索全局最优解, 结合位置和速度更新就可以实现数据空间的最优解搜索.使用PSO可以更快地收敛于最优解, 为SVR的参数确定提供比较好的实现方案[37].长江口的DO浓度受到水环境中多因素相互作用的影响.在这样的环境中, 改进后的PSO-SVR机器学习模型可以胜过传统的预测模型.
1.3.2 人工神经网络模型ANNANN是一种通过模拟生物和人脑处理信息时的特性所建立的预测模型[38], 在水环境监测和预报中被广泛使用, 是技术较为成熟的高效率模型.其对数据信息的训练学习建立在神经网络的反馈机制上, 重复多次进行正向传递与反向传播后, 神经网络不断修正误差至最终误差降低到可被接受范围, 完成神经网络的学习过程, 因此神经网络的算法是一种基于误差梯度下降的学习算法[39 ~ 41].本文以约7∶3的比例将整个数据集划分为训练集和测试集, 其中训练集用于训练搭建的网络, 测试集用于验证模型的性能.本文采用softmax作为激活函数, 确定网络权值, 具体流程如下.
第一步:在0时刻初始化网络权值和节点加法器的初始偏差;一般默认初始值为[-0.5, 0.5]之间的随机数, 因此有:
|
(1) |
式中, Wij(0)为在0时刻输入节点i和输出节点j之间的权值, θj(0)为0时刻j节点加法器的偏差.
第二步:计算t时刻各处理单元的加法器和激活函数值, 得到输出节点的预测值:
|
(2) |
式中, Y'j(t)为t时刻输出节点j的预测值, Xi(t)为t时刻上层节点i输入到本层节点j的输入值.
第三步:计算输出节点的期望值Yj(t)与预测值Y'j(t)的误差ej(t):
|
(3) |
第四步:根据t时刻的误差值计算t+1时刻节点j的网络权值及加法器的偏差:
|
(4) |
|
(5) |
|
(6) |
式中, α为冲向量, η为学习率, 通常可设置为η=0.1.
第五步:调整网络权值, 得到t+1时刻的预测误差ej (t+1), 判断是否满足迭代终止条件:
|
(7) |
式中, ε为一个充分小的整数.
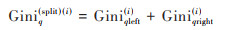
1.3.3 随机森林算法RF随机森林算法是一种组合分类器, 其本质是构建一组决策树, 共同完成分类或预测.由于该算法预测精度高, 对异常值的容忍度好, 不易过拟合, 可应用于各种分类筛选和预测[42].值得一提的是, 随机森林有一个重要的作用, 可以评估每个水质指标对于预测指标的重要性(variable importance measures, VIM)[43].因此, 随机森林可以衡量预测指标与作为自变量的水质指标之间的内在关系, 同时能够进行水质预测, 容纳了评价指标间内在关系和进行水质预测两种功能.随机森林重要性指数计算首先需要构建决策树, 本文中使用的为CART节点分裂算法, 其涉及如下计算.
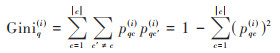
(1)第一步 第i棵树节点q的Gini指数的计算公式为:
|
(8) |
式中, c为总分类类别, pqc为节点q中类别c的出现概率.
(2)第二步 计算每个划分的Gini系数:
|
(9) |
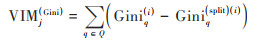
本文中需要量化不同水质因子对不同污染物的影响大小, 因此需要求得不同水质因子对应的变量重要性评分.此重要性可以由节点q分支前后Gini系数变化量表示:
|
(10) |
式中, 集合Q为Xj 在森林中出现的所有节点构成的集合.
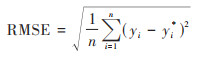
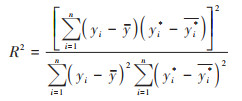
1.3.4 模型评估方法为评估模型对水质拟合的准确性, 利用验证点DO浓度的实测值和3种模型在训练集和测试集上的预测值[44 ~ 46], 分别计算了决定系数R2(coefficient of determination)以及均方误差RMSE(root mean squared error).具体计算公式如下:
|
(11) |
|
(12) |
式中, n为样本数, yi为因变量实测值, yi*为因变量预测值, y为因变量实测值的平均值, 
选择徐六泾、南通港、启东港、青龙港、南港和北港这6个监测断面, 使用随机森林算法进行长江口DO的污染驱动因子重要性指数评价.选择T、pH、高锰酸盐指数、BOD、NH4+-N、TN和TP这7个水质因子作为自变量, 得到每种水质因子对于溶解氧的重要性指数VIM, 结果如图 3所示.

|
图 3 基于随机森林的长江口溶解氧影响因子重要性指数 Fig. 3 Importance index of dissolved oxygen influencing factors in the Yangtze River Estuary based on random forests |
从结果可以看出, 在6个研究区域中温度对溶解氧的重要性指数均为最高.以徐六泾断面为例, 其溶解氧驱动因子按照重要性指数从高到低依次为T、BOD、TN、NH4+-N、pH、高锰酸盐指数和TP, T的重要性指数VIM值为8.94远超过其他水质因子, 说明T的不均匀分布对长江口DO时空分布差异影响十分显著.T对氧的转移影响较大, T上升, 水的黏滞性降低, 扩散系数提高, 这会促进氧转移.而T升高对DO饱和度上升具有抑制作用, 因此T对氧的转移有两种相反的影响, 总体表现为T降低有利于氧的转移.因此T对DO的影响更为明显, 会得到较高的重要性指数.其次, BOD和NH4+-N两个水质因子在6个断面的重要性指数均排名靠前, 说明二者对长江口溶解氧的浓度变化影响也较大.高BOD水体通常会导致DO的减少, 而较低的DO浓度可能会限制微生物的活性和有机物质的降解速率.针对DO与NH4+-N关系的相关研究表明, 地表水中二者的时间变化趋势呈负相关关系[47].
2.2 各监测断面机器学习预测结果分析选定长江口6个重点监测断面的水质指标, 即T、pH、高锰酸盐指数、BOD、NH4+-N、TN和TP, 将以上7个影响因素的数值作为输入源, 对徐六泾、南通港、启东港、青龙港、南港和北港这6个监测断面, 分别使用PSO-SVR、ANN和RF算法对DO进行预测, 得到测试集上预测值与实际值的对比数据如图4~6所示.

|
图 4 各监测点位SVR预测值与实际值对比 Fig. 4 Comparison of the predicted value with the actual value of each monitoring site based on SVR |

|
图 5 各监测点位ANN预测值与实际值对比 Fig. 5 Comparison of the predicted value with the actual value of each monitoring site based on ANN |

|
图 6 各监测点位RF预测值与实际值对比 Fig. 6 Comparison of the predicted value with the actual value of each monitoring site based on RF |
PSO-SVR模型(图 4)预测值与实际值非常接近, 表明模型能够较准确地预测DO水平.误差整体上较小, 6个监测断面的误差均在0.50及以下(表 1), 说明预测值与实际值之间的差异不大.ANN模型(图 5)预测值与实际值之间存在一定的偏差, 尤其是在一些峰值和谷值的地方.误差在这些点处较大, 这可能表明模型在捕捉数据的某些特征时存在困难.RF模型(图 6)预测值与实际值的吻合度较高, 尤其是在捕捉数据的周期性波动方面.误差普遍较低, 表明模型具有较高的预测准确性.整体上, RF模型在6个监测断面的总体平均误差为0.19, SVR和ANN模型分别为0.38和0.47.所有模型的预测值都显示出DO水平具有明显的周期性变化, 这可能与季节性因素相关, 如温度变化、水生植物的生长及衰亡和河流流量等.在各监测断面DO水平在夏季较高, 这是由于水温上升, 增加了水体的氧气扩散率, 以及光合作用的增强, 冬季DO水平降低可能与较低的水温和较小的光合作用活动有关.在选择最佳模型时, 应考虑预测准确性、模型的复杂度、训练和预测所需的时间等因素.综合来看, RF模型的整体性能在测试集上优于SVR和ANN模型.SVR模型在训练过程中通过PSO算法进行了优化, 从而提高了预测效率, 但其预测准确度与RF模型相比较低.ANN模型在预测结果中产生了一些误差较大的结果, 可能需要进一步调整网络结构或参数以改进其性能, 与RF和SVR模型相比, ANN模型的鲁棒性较弱.DO的年际变化数据存在非线性趋势、周期性和季节性等规律, RF模型在训练过程中基于决策树的集成方法建模非线性关系, 从而更好地适应了时间序列数据的特点.在预测过程中, 7个水质指标构成了高维数据空间, RF算法自动选择重要特征, 并在每棵树的节点上进行特征子集的随机选择, 从而在预测水质数据时显示出高准确性.
|
|
表 1 各监测点位PSO-SVR、ANN和RF模型溶解氧浓度预测误差/mg·L-1 Table 1 Prediction errors of DO concentration by PSO-SVR, ANN, and RF models at each monitoring site/mg·L-1 |
2.3 各监测断面机器学习预测模型性能评价
使用R2和RMSE对长江口6个监测断面机器学习模型预测性能进行评价.图 7展示了PSO-SVR、ANN和RF这3种模型在测试集上的预测值与实际值的拟合程度.PSO-SVR模型的R2值在0.884~0.973之间, RMSE值在0.225~0.560 mg·L-1之间.这表明PSO-SVR模型在大多数监测断面上都有很好的预测能力, 尤其是徐六泾、青龙港等R2值接近1的断面.ANN模型的R2值在0.719~0.954之间, RMSE值在0.345~0.833 mg·L-1之间. ANN模型在某些断面上的预测性能不如PSO-SVR模型, 如南港、北港的RMSE值达到0.723 mg·L-1和0.833 mg·L-1, 表明在该点位上预测误差较大.RF模型的R2值在0.978~0.993之间, RMSE值在0.117~0.220 mg·L-1之间.RF模型在所有断面上都表现出最优的预测能力, 具有最高的R2值和最低的RMSE值.

|
阴影部分为95%预测区间, RMSE的单位为mg·L-1 图 7 长江口6个监测断面溶解氧预测值与实际值拟合分析 Fig. 7 Correlation of prediction and observation for DO in the six sections in Yangtze Estuary |
为体现3种预测模型的稳定性和泛化能力, 分别计算了3种模型在训练集和测试集上的R2值和RMSE值.如图 8所示, 在训练集上, 每个模型对每个监测点位的DO都表现出不同的预测性能, SVR模型排名如下:南港 > 徐六泾 > 南通港 > 青龙港 > 启东港 > 北港.ANN模型排名如下:南港 > 徐六泾 > 南通港 > 北港 > 启东港 > 青龙港.RF模型排名如下:徐六泾 > 南通港 > 南港 > 青龙港 > 启东港 > 北港.计算3种模型在6个监测点位的平均R2和RMSE, 得到训练集上整体预测性能排名为:RF(R2 = 0.971;RMSE = 0.341 mg·L-1) > SVR(R2 = 0.884;RMSE = 0.707 mg·L-1) > ANN(R2 = 0.792;RMSE = 0.967 mg·L-1).在测试集上, SVR模型排名如下:徐六泾 > 青龙港 > 南通港 > 北港 > 南港 > 启东港.ANN模型排名如下:徐六泾 > 启东港 > 南通港 > 青龙港 > 南港 > 北港.RF模型排名如下:徐六泾 > 南通港 > 北港 > 青龙港 > 南港 > 启东港.3种模型在测试集上整体预测性能排名为:RF(R2 = 0.986;RMSE = 0.165 mg·L-1) > SVR(R2 = 0.951;RMSE = 0.332 mg·L-1) > ANN(R2 = 0.800;RMSE = 0.633 mg·L-1).PSO-SVR模型R2值在训练集和测试集上分布较为集中, 表明模型具有较好的稳定性和泛化能力.RMSE值在训练集和测试集上也较为集中, 但在测试集上略有升高.ANN模型的R2值和RMSE值在训练集和测试集上的分布较为分散, 表明模型在不同断面上的性能变化较大, 可能需要针对不同的数据特点进行调整.RF模型的R2值在训练集上非常高, 但在测试集上略有下降.RMSE值在训练集上非常低, 在测试集上有所增加, 但增幅有限, 说明模型具有良好的泛化能力.

|
图 8 3种模型在训练集和测试集上的R2值和RMSE值分布 Fig. 8 Distribution of R2 and RMSE values for the three models on the training and the test sets |
综合来看, RF模型在所有监测断面上均表现出最佳的预测能力, 具有最高的R2值和最低的RMSE值, 无论是在训练集还是测试集上都显示出优异的性能和泛化能力.PSO-SVR模型在大多数监测断面上也表现良好, 其预测性能略逊于RF模型, 但稳定性和泛化能力都较好.ANN模型在某些监测断面上的表现不如另外两个模型, 可能需要进一步优化其网络结构或参数来提高预测精度和稳定性.
3 结论(1)基于对长江口6个监测点位2004~2020年水质数据的挖掘和分析, 使用随机森林重要性评价, 探究了长江口水质因子间的内在关系, 结果显示T、BOD和NH4+-N在6个断面的重要性指数均排名靠前, 说明三者对长江口溶解氧的浓度时空分布影响较大.
(2)使用PSO-SVR、ANN和RF模型对长江口6个监测断面的水质中的DO进行了预测分析.结果显示, PSO-SVR模型预测误差相对较小, ANN模型在一些极值点存在较大偏差, 而RF模型在各监测断面表现出高准确性和低误差, 尤其是在捕捉数据周期性波动方面.RF模型在6个监测断面的总体平均误差为0.19, SVR和ANN模型分别为0.38和0.47.整体来看, RF模型的性能优于PSO-SVR和ANN模型, 尽管使用PSO算法优化了SVR, 提高了其预测效率, 但预测精确度仍不如RF模型.ANN模型则表现出较弱的鲁棒性.研究还发现, DO水平显示出明显的季节性变化, 夏季较高, 冬季降低, 这与水温变化、水生植物活动和河流流量相关.RF模型以其能够建模非线性关系和自动筛选重要特征, 在高维数据空间中预测水质表现出了高准确性.
(3)对3种机器学习模型在测试集上的预测性能的评估结果显示, RF模型在所有监测断面上显示出最佳的预测能力, 具有最高的R2值(0.978~0.993)和最低的RMSE值(0.117~0.220 mg·L-1).PSO-SVR模型整体上也表现出良好的预测性能, 其R2值在0.884~0.973之间, RMSE值在0.225~0.560 mg·L-1之间, 尤其在徐六泾、青龙港等R2值接近1的断面表现最好.ANN模型的预测性能相对较弱, 其R2值在0.719~0.954之间, RMSE值在0.345~0.833 mg·L-1之间, 尤其在南港、北港的RMSE值达到0.723和0.833 mg·L-1, 说明这些地方的预测误差较大.考虑预测模型的稳定性和泛化能力, 3种模型在训练集和测试集的R2值和RMSE值均进行了评估.训练集上的整体预测性能排名是RF(R2 = 0.971;RMSE = 0.341 mg·L-1) > PSO-SVR(R2 = 0.884;RMSE = 0.707 mg·L-1) > ANN(R2 = 0.792;RMSE = 0.967 mg·L-1).测试集上的整体预测性能排名为RF(R2 = 0.986;RMSE = 0.165 mg·L-1) > PSO-SVR(R2 = 0.951;RMSE = 0.332 mg·L-1) > ANN(R2 = 0.800;RMSE = 0.633 mg·L-1).因此, RF模型在所有监测断面上均表现出最佳预测能力, 具有最高的R2值和最低的RMSE值, 无论是在训练集还是测试集上都显示出优异的性能和泛化能力.PSO-SVR模型在大多数监测断面上也表现良好, 其预测性能略逊于RF模型, 但稳定性和泛化能力都较好.而ANN模型在某些监测断面上的表现不如另外两个模型, 可能需要进一步优化其网络结构或参数来提高预测精度和稳定性.
| [1] | Zhao C, Hou Y F, Wang Y T, et al. Unraveling the photochemical reactivity of dissolved organic matter in the Yangtze river estuary: integrating incubations with field observations[J]. Water Research, 2023, 245. DOI:10.1016/J.WATRES.2023.120638 |
| [2] | Pan T, Fan Y Y, Shao L, et al. Multiple accounting and driving factors of water resources use: a case study of Shanghai[J]. Journal of Environmental Management, 2022, 313. DOI:10.1016/J.JENVMAN.2022.114929 |
| [3] | Wang Z F, Shao H Q. Spatiotemporal differences in and influencing factors of urban carbon emission efficiency in China's Yangtze River Economic Belt[J]. Environmental Science and Pollution Research, 2023, 30(58): 121713-121733. DOI:10.1007/s11356-023-30674-7 |
| [4] | Liu Z Y, Xu C, Johnson A C, et al. Exploring the source, migration and environmental risk of perfluoroalkyl acids and novel alternatives in groundwater beneath fluorochemical industries along the Yangtze River, China[J]. Science of the Total Environment, 2022, 827. DOI:10.1016/J.SCITOTENV.2022.154413 |
| [5] | Lu X H, Fan Y M, Hu Y S, et al. Spatial distribution characteristics and source analysis of shallow groundwater pollution in typical areas of Yangtze River Delta[J]. Science of the Total Environment, 2024, 906. DOI:10.1016/J.SCITOTENV.2023.167369 |
| [6] | Lu Y Y, Li Y, Fang G H, et al. Ecological risk assessment and management for riverfront development along the Yangtze River in Jiangsu Province, China[J]. Ecological Indicators, 2023, 155. DOI:10.1016/J.ECOLIND.2023.111075 |
| [7] | Wang N, Wang N, Qi D, et al. Comprehensive overview of antibiotic distribution, risk and priority: a study of large-scale drinking water sources from the lower Yangtze River[J]. Journal of Environmental Management, 2023, 344. DOI:10.1016/J.JENVMAN.2023.118705 |
| [8] | Peng L, Deng X Z, Li Z H. An extended input-output analysis of links between industrial production and water pollutant discharge in the Yangtze River Economic Belt[J]. Journal of Cleaner Production, 2023, 390. DOI:10.1016/J.JCLEPRO.2023.136115 |
| [9] | Tan E H, Hsu T C, Zou W B, et al. Quantitatively deciphering the roles of sediment nitrogen removal in environmental and climatic feedbacks in two subtropical estuaries[J]. Water Research, 2022, 224. DOI:10.1016/J.WATRES.2022.119121 |
| [10] | Wang Q, Xu H W, Yin J, et al. Significance of the great protection of the Yangtze River: riverine input contributes primarily to the presence of PAHs and HMs in its estuary and the adjacent sea[J]. Marine Pollution Bulletin, 2023, 186. DOI:10.1016/J.MARPOLBUL.2022.114366 |
| [11] | Guo H Y, Zhang X G, Zhang Y, et al. Recruitment patterns and environmental sensitivity of glass eels of Anguilla japonica in the Yangtze Estuary, China[J]. Biology, 2024, 13(1). DOI:10.3390/BIOLOGY13010056 |
| [12] | Qu W, Zuo Y Q, Zhang Y X, et al. Structure and assembly process of fungal communities in the Yangtze River Estuary[J]. Frontiers in Microbiology, 2024, 14. DOI:10.3389/FMICB.2023.1220239 |
| [13] |
赵艳民, 秦延文, 马迎群, 等. 基于PSR的长江口生态系统的健康评价[J]. 环境工程, 2021, 39(10): 207-212. Zhao Y M, Qin Y W, Ma Y Q, et al. Assessment of ecosystem health of the Yangtze River Estuary based on the pressure-state-response model[J]. Environmental Engineering, 2021, 39(10): 207-212. |
| [14] | Aldrees A, Khan M, Taha T A B, et al. Evaluation of water quality indexes with novel machine learning and SHapley Additive ExPlanation (SHAP) approaches[J]. Journal of Water Process Engineering, 2024, 58. DOI:10.1016/J.JWPE.2024.104789 |
| [15] | 夏青, 刘和平, 刘锋, 等. 中华人民共和国国家标准GB3838—88地面水环境质量标准修订说明[J]. 环境科学研究, 1988, 1(5): 1-95. |
| [16] | Barroso G R, Pinto C C, Gomes L N L, et al. Assessment of water quality based on statistical analysis of physical-chemical, biomonitoring and land use data: Manso River supply reservoir[J]. Science of the Total Environment, 2024, 912. DOI:10.1016/J.SCITOTENV.2023.169554 |
| [17] |
辛泊达, 吕连宏, 王培, 等. 基于随机森林模型的臭氧浓度时空变化特征及关键影响因子识别: 以滁州市为例[J]. 环境科学, 2024, 45(9): 5117-5126. Xin B D, Lü L H, Wang P, et al. Spatio-temporal variation characteristics of ozone and identification of key influencing factors based on random forest model: a case study of Chuzhou city[J]. Environmental Science, 2024, 45(9): 5117-5126. |
| [18] |
杨晓彤, 康平, 王安怡, 等. 基于随机森林模型的四川盆地臭氧污染预测[J]. 环境科学, 2024, 45(5): 2507-2515. Yang X T, Kang P, Wang A Y, et al. Prediction of ozone pollution in Sichuan basin based on random forest model[J]. Environmental Science, 2024, 45(5): 2507-2515. |
| [19] | Alnahit A O, Mishra A K, Khan A A. Stream water quality prediction using boosted regression tree and random forest models[J]. Stochastic Environmental Research and Risk Assessment, 2022, 36(9): 2661-2680. DOI:10.1007/s00477-021-02152-4 |
| [20] | Mousavi S Z, Momeni S A, Dehdashti B, et al. Advanced treatment of industrial estate effluent using ozone-membrane processes based on optimized random forest model[J]. Journal of Water Process Engineering, 2022, 48. DOI:10.1016/J.JWPE.2022.102897 |
| [21] | Deluca N M, Mullikin A, Brumm P, et al. Using geospatial data and random forest to predict PFAS contamination in fish tissue in the Columbia River Basin, United States[J]. Environmental Science & Technology, 2023, 57(37): 14024-14035. |
| [22] |
张颖, 高倩倩. 基于随机森林分类算法的巢湖水质评价[J]. 环境工程学报, 2016, 10(2): 992-998. Zhang Y, Gao Q Q. Water quality evaluation of Chaohu Lake based on random forest method[J]. Chinese Journal of Environmental Engineering, 2016, 10(2): 992-998. |
| [23] |
邹佳奇, 张亦飞, 方欣, 等. 基于随机森林的入海污染源对海湾环境容量的影响排序研究[J]. 海洋环境科学, 2021, 40(5): 675-682. Zou J Q, Zhang Y F, Fang X, et al. Impact ranking of pollution source discharge on the bay environmental capacity based on the random forest algorithm[J]. Marine Environmental Science, 2021, 40(5): 675-682. |
| [24] |
王涌, 陆卫, 左楚涵, 等. 基于改进随机森林模型的水质BOD快速预测研究[J]. 传感技术学报, 2021, 34(11): 1482-1488. Wang Y, Lu W, Zuo C H, et al. Research on water quality BOD prediction based on improved random forest model[J]. Chinese Journal of Sensors and Actuators, 2021, 34(11): 1482-1488. |
| [25] | Mohan I, Sahoo A, Panda A K, et al. Screening of modified kaolin catalysts in the catalytic pyrolysis of waste high-density polyethylene: kinetics and thermodynamic analysis, artificial neural network prediction, batch pyrolysis study and characterization of liquid fuel[J]. Journal of Environmental Chemical Engineering, 2023, 11(5). DOI:10.1016/J.JECE.2023.111039 |
| [26] | Joseph L P, Deo R C, Casillas-Pérez D, et al. Short-term wind speed forecasting using an optimized three-phase convolutional neural network fused with bidirectional long short-term memory network model[J]. Applied Energy, 2024, 359. DOI:10.1016/J.APENERGY.2024.122624 |
| [27] | Wu Z C, Tian Y P, Li M Z, et al. Prediction of air pollutant concentrations based on the long short-term memory neural network[J]. Journal of Hazardous Materials, 2024, 465. DOI:10.1016/J.JHAZMAT.2023.133099 |
| [28] | Qiao J W, Li S Z, Liu M, et al. A modified particle swarm optimization algorithm for a vehicle scheduling problem with soft time windows[J]. Scientific Reports, 2023, 13(1). DOI:10.1038/S41598-023-45543-Z |
| [29] | Fu X H, Zheng Q X, Jiang G M, et al. Water quality prediction of copper-molybdenum mining-beneficiation wastewater based on the PSO-SVR model[J]. Frontiers of Environmental Science & Engineering, 2023, 17(8). DOI:10.1007/s11783-023-1698-9 |
| [30] | Chen Z L, Zhang H B, Yi Y B, et al. Dissolved organic matter composition and characteristics during extreme flood events in the Yangtze River Estuary[J]. Science of the Total Environment, 2024, 914. DOI:10.1016/J.SCITOTENV.2023.169827 |
| [31] | Lin J N, Liao L Z, Sun T, et al. Spatial and temporal variability and risk assessment of organophosphate esters in seawater and sediments of the Yangtze River estuary[J]. Marine Pollution Bulletin, 2024, 198. DOI:10.1016/J.MARPOLBUL.2023.115904 |
| [32] | Huang J N, Xu L, Wen B, et al. Characteristics and risks of microplastic contamination in aquaculture ponds near the Yangtze Estuary, China[J]. Environmental Pollution, 2024, 343. DOI:10.1016/J.ENVPOL.2024.123288 |
| [33] | Zeng Y C, Wang H, Liang D F, et al. Shape- and polymer-considered simulation to unravel the estuarine microplastics fate[J]. Journal of Hazardous Materials, 2024, 461. DOI:10.1016/J.JHAZMAT.2023.132679 |
| [34] | Li F F, Wang P, Fan T J, et al. Prioritization of the ecotoxicological hazard of PAHs towards aquatic species spanning three trophic levels using 2D-QSTR, read-across and machine learning-driven modelling approaches[J]. Journal of Hazardous Materials, 2024, 465. DOI:10.1016/J.JHAZMAT.2023.133410 |
| [35] | Wu W C, Chen K C, Tsotsas E. Prediction of particle mixing in rotary drums by a DEM data-driven PSO-SVR model[J]. Powder Technology, 2024, 434. DOI:10.1016/J.POWTEC.2024.119365 |
| [36] |
闫丹丹, 黄玉, 王冬梅, 等. 基于紫外荧光水质传感器和机器学习的总氮和总有机碳估算[J]. 环境科学学报, 2023, 43(10): 155-165. Yan D D, Huang Y, Wang D M, et al. Estimation of total nitrogen and total organic carbon based on UV fluorescence water quality sensor and machine learning[J]. Acta Scientiae Circumstantiae, 2023, 43(10): 155-165. |
| [37] | Obi C C, Nwabanne J T, Igwegbe C A, et al. Intelligent algorithms-aided modeling and optimization of the deturbidization of abattoir wastewater by electrocoagulation using aluminium electrodes[J]. Journal of Environmental Management, 2024, 353. DOI:10.1016/J.JENVMAN.2024.120161 |
| [38] | Kenekar V V, Ghugare S B, Patil-Shinde V. Multi-objective optimization of high-shear wet granulation process for better granule properties and fluidized bed drying characteristics[J]. Powder Technology, 2023, 420. DOI:10.1016/J.POWTEC.2023.118373 |
| [39] | Nerona D J, Abella N C M, Jundam G A G C, et al. Response surface and artificial neural network modeling for optimization of process parameter in Cu(Ⅱ) adsorption uptake of sodium-activated Philippine natural zeolite[J]. Journal of Water Process Engineering, 2024, 58. DOI:10.1016/J.JWPE.2024.104851 |
| [40] | Rahiman M K, S S, Rex P, et al. Internal combustion engine fuel synthesis, suitability, physical property evaluation using mixing models and backpropagation ANN algorithm[J]. Engineering Applications of Artificial Intelligence, 2024, 132. DOI:10.1016/J.ENGAPPAI.2024.107970 |
| [41] | Satish N, Anmala J, Rajitha K, et al. A stacking ANN ensemble model of ML models for stream water quality prediction of Godavari River Basin, India[J]. Ecological Informatics, 2024, 80. DOI:10.1016/J.ECOINF.2024.102500 |
| [42] | Tian Y, Wang S, Pei L W, et al. Electrochemical mechanism of synchronous ammonia and nitrate removal based on multi-objective optimization by coupling random forest with genetic algorithm[J]. Science of the Total Environment, 2023, 901. DOI:10.1016/J.SCITOTENV.2023.166039 |
| [43] | Liu X F, Zhang L, Yang F H, et al. Determining reclaimed water quality thresholds and farming practices to improve food crop yield: a meta-analysis combined with random forest model[J]. Science of the Total Environment, 2023, 862. DOI:10.1016/J.SCITOTENV.2022.160774 |
| [44] | Gao Z Y, Chen J Y, Wang G Q, et al. A novel multivariate time series prediction of crucial water quality parameters with Long Short-Term Memory (LSTM) networks[J]. Journal of Contaminant Hydrology, 2023, 259. DOI:10.1016/J.JCONHYD.2023.104262 |
| [45] | Uddin M G, Nash S, Rahman A, et al. A comprehensive method for improvement of water quality index (WQI) models for coastal water quality assessment[J]. Water Research, 2022, 219. DOI:10.1016/J.WATRES.2022.118532 |
| [46] | Zanoni M G, Majone B, Bellin A. A catchment-scale model of river water quality by Machine Learning[J]. Science of the Total Environment, 2022, 838. DOI:10.1016/J.SCITOTENV.2022.156377 |
| [47] | Huang R, Meng T Y, Liu G G, et al. Simultaneous nitrification and denitrification in membrane bioreactor: Effect of dissolved oxygen[J]. Journal of Environmental Management, 2022, 323. DOI:10.1016/J.JENVMAN.2022.116183 |