 2024, Vol. 45


生态系统服务(ecosystem services, ESs)是指生态系统与生态过程所形成及所维持的人类赖以生存的自然环境条件与效用, 它不仅为人类提供食物和其它生活原料, 更重要的是维持了人类赖以生存的生命支持系统[1]. 然而, 一项全球分析显示, 由于人类活动, 自然生态系统提供的生态系统服务已经减少了60%[2], 这将对人类福祉产生负面影响[3]. 如何优化和管理生态系统服务, 并可持续利用自然资本已经成为当务之急[4], 其中, 明确生态系统服务空间分布格局, 揭示其驱动因素是优化和管理生态系统服务的关键步骤, 是促进国家和区域层面可持续发展的重要前提.
近年来, 国内外学者针对生态系统服务综合评估做了很多研究, 更多集中在生态系统服务的时空演变上, 包括生态系统服务的时空变化[5 ~ 7]、价值化[8 ~ 10]、生态安全[11 ~ 13]和供需匹配[14 ~ 16]等, 但影响生态系统服务空间分布的因素仍需要进一步探索研究. 目前, 生态系统服务空间分布影响因素的主要方法包括:相关性分析[17]、普通最小二乘模型(ordinary least square, OLS)、地理加权回归模型(geographical weighted regression, GWR)[18]、地理探测器[19]和其他统计模型. 相关性分析和OLS模型无法探究多因素对生态系统服务空间格局的影响机制, GWR模型也往往会出现局部多重共线性问题从而导致结果不稳定并且该方法忽略了因子间的交互作用, 而地理探测器可以消除和忽视输入因子的多重共线性, 可以探索空间中各种因素的异质性和解释力[20]. 国内众多学者基于地理探测器对交通碳排放[21]、土壤重金属[22]、NPP[23]和生态系统服务[24, 25]的空间分布的驱动因子进行分析, 该方法已经成功应用于各个领域, 具有普适性.
东北地区是我国乃至东北亚地区重要的生态屏障[26], 其中东北森林带是国家“两屏三带”生态安全战略格局的重要组成部分[27], 该区域生态系统服务的重要性不可忽视. 近年来, 针对东北地区生态系统服务生态工程实施成效[28 ~ 30]、权衡/协同关系[27, 31]及价值化[32, 33]的研究非常多, 探讨东北地区植被时空变化[34]、粮食作物覆盖类型[35]和城市化[36]等驱动因子的研究也非常之多, 而将两者结合探究东北地区生态系统服务空间分布驱动因素的研究却很少, 深入探究和分析生态系统服务的驱动因素对于更好地指导生态系统服务管理决策是十分必要的.
因此, 本研究采用InVEST、RWEQ和RUSLE模型量化分析了东北地区2020年固碳(carbon sequestration, CS)服务、土壤保持(soil conservation, SC)服务、生境质量(habitat quality, HQ)、防风固沙(wind prevention and sand fixation, WPSF)服务以及水源涵养(water yield, WY)服务的空间分布, 采用地理探测器分析了影响生态系统服务空间分布的驱动因子的解释力、交互作用和最适宜范围, 以期为东北地区生态系统服务保护与提升以及后续林业政策的实施提供科学的参考依据.
1 材料与方法 1.1 研究区概况东北地区包括黑龙江省、吉林省、辽宁省和内蒙古自治区东四盟(包括呼伦贝尔、兴安、通辽和赤峰)[31], 其地理位置范围为114°~130°E, 40°~55°N, 东西跨度1 300 km, 南北距离1 400 km[37], 自南向北横跨中温带与寒温带, 属温带季风气候, 夏季温热短暂, 冬季干燥寒冷且漫长[28], 降水主要集中在4~10月, 年降水量在300~1 000 mm之间. 东北地区地质类型丰富, 海拔在-277~2 667 m之间(图 1), 地势差异明显, 呈三面环山, 内部平原的分布格局[38], 以平原、高原和山地为主. 作为我国最大的天然林区, 森林资源丰富, 其中, 针叶树种包括红松(Pinus koraiensis)、兴安落叶松(Larix gmelinii)和樟子松(Pinus sylvestris var. mongolica)等, 阔叶树种包括白桦(Betula platyphylla)、水曲柳(Fraxinus mandshurica)和胡桃楸(Juglans mandshurica)等[39].

|
图 1 东北地区随机样点分布示意 Fig. 1 Distribution of random samples in Northeast China |
土地利用数据来源于资源环境科学与数据中心(https://www.resdc.cn/), 为Landsat 8数据, 分辨率为1 km. 陆地实际蒸散发数据采用MOD16A2/ET产品, 分辨率为500 m. NDVI数据采用MOD13Q1产品, 分辨率为250 m. DEM数据来源于地理空间数据云(http://www.gscloud.cn/search)的SRTMDEM原始高程数据, 分辨率为90 m.
1.2.2 气象数据逐月降水量[40]、平均气温[40]以及风速[41, 42]数据来源于国家科技基础条件平台——国家地球系统科学数据中心(http://www.geodata.cn/), 分辨率均为1 km. 太阳总辐射[43]数据来源于国家青藏高原科学数据中心(http://data.tpdc.ac.cn), 分辨率为10 km. 雪深[44 ~ 46]数据来源于时空三极环境大数据平台(http://poles.tpdc.ac.cn/).
1.2.3 其他数据土壤属性[47]数据来源于国家青藏高原科学数据中心(http://data.tpdc.ac.cn/zh-hans/), 分辨率为1∶100万. 碳密度数据参考文献[48 ~ 50]并结合1∶400万中国植被分布图得到. 中国国内生产总值(gross domestic product, GDP)空间分布公里网格数据集来源于资源环境科学数据注册与出版系统[51]. 中国人口空间分布公里网格数据集来源于资源环境科学数据注册与出版系统[52].
以上数据时相均为2020年, 空间分辨率重采样为1 km, 坐标系为Krasovsky_1940_Albers.综合考虑研究区生态系统特征以及经济发展情况并参考相关文献[53, 54], 选取各驱动因子. 本研究采用R软件“GD”包最优参数地理探测器模型(OPGD模型)进行连续变量离散化, 对驱动因子选择出最合适的分类等级后在ArcGIS 10.6中采用非监督离散化方法中的自然断点法进行数据离散化, 也是目前最常用的离散化方法[22, 55], 各驱动因子分级见表 1, 空间分布如图 2所示. 本研究在ArcGIS 10.6软件中随机生成2 000个随机样点, 随即样点间距为1 km.
|
|
表 1 驱动因子来源及分级标准 Table 1 Grading standards and resource of driving factors |

|
X1~X8具体含义见表 1 图 2 各驱动因子空间分布 Fig. 2 Spatial distribution of drivers |
(1)碳储量估算 采用InVEST模型碳储量模块计算碳储量, 计算方法如式(1)所示.

|
(1) |
式中, Ctot为总碳储量;Cabove为地上部分的碳储量;Cbelow为地下部分的碳储量;Csoil为土壤碳储量;Cdead为枯落物碳储量, 单位均为t·hm-2.
(2)水源涵养量估算 基于水量平衡方程计算水源涵养量, 计算方法如式(2)所示.
|
(2) |
式中, WY(x)为单位栅格含水量(mm);P(x)为单位栅格降水量(mm);AET(x)为单位栅格实际蒸散量(mm).
(3)土壤保持量估算 采用在国内取得较好适应性的修正的通用水土流失方程(RUSLE)计算, 其计算方法如式(3)所示.
|
(3) |
式中, X为单位面积土壤保持量(t·hm-2);R表示降雨侵蚀力因子[MJ·mm·(hm2·h)-1];K表示土壤可蚀性因子[t·h·(MJ·mm)-1];L表示坡长因子(无量纲);S表示坡度因子(无量纲);C表示植被覆盖因子(无量纲);P表示工程措施因子(无量纲).
(4)固沙量估算 采用修正的水土风蚀方程(RWEQ)计算固沙量, 其计算方式如式(4).
|
(4) |
式中, SR为固沙量(t·km-2);SL潜为潜在风力侵蚀量(t·km-2);SL为实际风力侵蚀量(t·km-2).
(5)生境质量估算 采用InVEST模型生境质量模块来估算生境质量, 其计算公式如式(5)所示.
|
(5) |
式中, Hj为土地利用类型j的生境适应性;Dxjz为土地利用类型j中栅格像元x的总威胁等级;k为半饱和常数, 一般为最大退化度的1/2, 本研究取0.5;z为常数, 一般取2.5.
1.3.2 生态系统服务驱动因子采用地理探测器来探测生态系统服务空间分布的驱动因子, 该模型包括4个模块[22]:
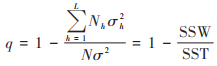
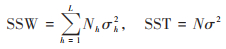
(1)因子探测 探测驱动因子X对生态系统服务变化的影响大小, 解释力用q表示. 计算公式如式(6)和式(7)所示.
|
(6) |
|
(7) |
式中, h = 1, 2, …, L为因子X的分类;N和Nh分别为全区和层h的单元数;σh2和σ2分别为层h和全区的Y值方差;SSW与SST分别为层内方差之和与区域总方差. q值范围[0, 1], 值越大表示驱动因子对生态系统服务的解释力越强.
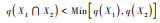
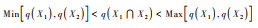
(2)交互探测 识别驱动因子对生态系统服务的影响是否相互独立. 交互作用关系分为5类, 具体分类如表 2所示.
|
|
表 2 两因子间的交互作用类型 Table 2 Interaction type of two factors |
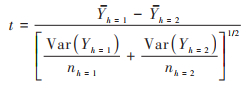
(3)风险探测 判断两个驱动因子子区域之间的属性均值是否有显著差别, 找出生态系统服务高值区域, 用t统计量来检验, 计算公式如式(8)所示.
|
(8) |
式中, Yh为子区域h生态系统服务的属性均值;nh为子区域h内的样本数量;Var为方差.
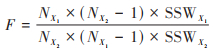
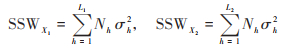
(4)生态探测 判断两个因子X1与X2对生态系统服务空间分布哪个更具有影响力, 以F统计量来衡量, 计算公式如式(9)和式(10)所示.
|
(9) |
|
(10) |
式中, NX1和NX2分别为两个指标X1和X2的样本数量;SSWX1和SSWX2分别为两个X1和X2形成分层的层内方差之和;L1和L2分别为变量X1和X2分层数目.
2 结果与分析 2.1 生态系统服务时空变化特征生态系统服务在空间分布上存在明显的异质性(图 3), 其中, 生境质量、固碳服务和土壤保持服务在空间分布上基本一致. 生境质量、碳储存和土壤保持高值主要分布在内蒙古自治区东四盟北部、黑龙江省北部和中北部、吉林省东部、辽宁省东部, 低值主要分布在黑龙江省西南部和东部、吉林省西部、辽宁省西部. 水源涵养高值主要集中分布在辽宁省东南部, 黑龙江省和吉林省东部也有部分高值分布, 低值主要分布在内蒙古自治区东四盟、黑龙江省北部. 防风固沙服务高值主要分布在内蒙古自治区东四盟, 内蒙古自治区东四盟长年遭受风沙侵蚀, 沙漠化严重, 而防风固沙服务高值的分布在空间上和三北防护林工程中防风固沙功能区基本重合.

|
图 3 生态系统服务空间分布 Fig. 3 Spatial distribution of ecosystem services |
根据因子探测结果(表 3), 土地利用类型、坡度和DEM对固碳服务和生境质量空间分布的解释力最强, 其中, 土地利用类型均为主导因子, q值分别为0.52和0.64;坡度、植被覆盖度和年降水量对土壤保持服务空间分布的解释力最强, 其中, 坡度为主导因子, q值为0.31;植被覆盖度、年平均气温和年降水量对防风固沙服务空间分布的解释力最强, 植被覆盖度为主导因子, q值为0.24;年降水量、年平均气温和GDP对水源涵养服务空间分布的解释力最强, 年降水量为主导因子, q值为0.64. 自然因子一直是影响研究区生态系统服务空间分布的主导因子, 其中水源涵养服务还容易受到人为因子GDP的影响.
|
|
表 3 东北地区生态系统服务因子探测结果1) Table 3 Results of ecosystem service factor detection in Northeast China |
2.2.2 驱动因子交互作用以及显著性差异
根据交互探测和生态探测结果(图 4), 各驱动因子交互都存在增强效应, 说明当因子间相互作用时, 对生态系统服务空间分布的解释力会增强.

|
X1~X8具体含义见表 1;圆圈表示交互力大小, 圆圈越大表示交互力越大, 圈中数字表示交互力的q值 图 4 东北地区生态系统服务驱动因子的交互作用以及显著性差异 Fig. 4 Interactions and significant differences in drivers of ecosystem services in Northeast China |
固碳服务、土壤保持服务以及生境质量各驱动因子主要表现为双因子增强, 固碳服务交互作用最显著的是坡度与土地利用类型, 与其他因子存在显著差异, q值为0.66;土壤保持服务交互作用最显著的是年平均气温和土地利用类型, q值为0.59;生境质量交互作用最显著的为坡度和土地利用类型, q值为0.70. 防风固沙和水源涵养服务主要表现为非线性增强, 其中防风固沙服务交互作用最显著的是年平均气温与年降水量, q值为0.41;水源涵养服务交互作用最显著的是年降水量与植被覆盖度, 与其他因子存在显著差异, q值为0.64.
2.2.3 生态系统服务适宜性范围根据风险探测结果(图 5), 确定了每种生态系统服务的最适宜因子(本研究选择影响作用排名前25%的因素). 其中, 生态系统固碳服务最适宜因子范围的为林地和坡度15°~20°;土壤保持服务最适宜因子范围为植被覆盖度24%~36%和坡度0°~1.5°;生境质量的最适宜因子范围为林地以及坡度大于25°;防风固沙服务最适宜因子范围为植被覆盖度92%~100%和年平均气温8.57~10.60℃;水源涵养服务最适宜因子范围为年降水量1 037~1 244 mm和年平均气温10.60~15.14℃.

|
X1~X8表示驱动因子名称, 具体见表 1, 横坐标表示不同的驱动因子, 纵坐标表示生态系统服务物质量 图 5 东北地区生态系统服务与各驱动因子分级变化 Fig. 5 Ecosystem services and hierarchical changes in drivers in Northeast China |
本研究量化了东北地区5种生态系统服务的空间分布特征, 利用地理探测器识别了区域生态系统服务存在明显空间异质性的驱动因子, 地理探测器能够更直观、更快速和更有效地衡量各因子的贡献, 没有较强的模型假设, 解决了传统方法在分析类别变量时的局限性[56], 弥补了全局性分析的不足.
3.1 生态系统服务空间分布与驱动因素相较于人为因子, 自然因子对生态系统服务空间分布的影响更大. 其中, 土地利用类型对固碳服务和生境质量的空间分布解释力最强, 林地和陡峭区域均有利于固碳服务和生境质量的提升, 因此固碳服务和生境质量高值主要分布在大小兴安岭以及长白山脉等林区. 林区森林覆盖度高, 生物多样性丰富, 具有较高的生态价值, 海拔高且地势陡峭, 人为干扰少, 生态系统稳定[57], 森林进行光合作用时吸收二氧化碳, 有较高的固碳能力, 同时天然林资源保护工程和退耕还林还草工程有效提升了生境质量[58]. 土壤保持服务的空间分布与固碳服务和生境质量基本一致, 但驱动因子却存在较大差异, 坡度对土壤保持服务空间分布的解释力最强, 土壤保持服务最适宜的坡度为0°~1.5°, 但是年平均气温与土地利用类型交互作用影响力大于单因子作用, 导致土壤保持服务高值主要分布在大小兴安岭以及长白山脉等陡峭的林区. 这些区域年平均气温为5~15℃, 适宜植被的生长, 并且由于天然林资源保护工程在东北地区的实施, 林区植被覆盖度高, 林下植被和草地可以拦截部分降雨, 从而减少水土流失. 水源涵养服务主导因子为年降水量, 主导交互因子仍为年降水量与其他因子的交互, 由水源涵养服务的计算公式也可以明显看出水源涵养量与年降水量直接相关. 东北地区东部林地面积广, 降水丰富并且温度适宜, 因此在良好的水热环境下, 促进了植被生长, 导致了水源涵养服务高值主要分布在东北地区东部, 其中, 辽宁省沿海受东南季风带来丰富水分的影响[59], 水源涵养服务最高值集中分布在辽宁省东南部. 防风固沙服务的主导因子为植被覆盖度, 但是年平均气温与年降水量的交互作用大于单因子作用, 其最适宜年平均温度8.63~10.66℃, 最适宜年降水量为213~368 mm, 内蒙古自治区东四盟处于干旱半干旱带, 并且受季风影响, 导致其沙漠化严重, 沙尘暴频发, 适宜的温度和降水可以有效减少风沙化. 内蒙古自治区东四盟的主要土地利用类型为草地, 草原植被低矮, 植被背风面可以阻挡流沙, 能够有效降低近地面的风沙流动[60], 因此防风固沙服务高值主要分布在内蒙古自治区东四盟.
3.2 区域生态管理与规划建议不同的生态系统服务其主导因子有所不同, 因此对于不同的生态系统服务应进行针对性管理与提升, 充分考虑各驱动因子对生态系统服务的主导性、交互性以及适宜范围. 当地政府要实现东北地区生态系统修复和生态系统服务的可持续发展, 必须重视各因素的交互作用, 实施综合治理措施. 首先, 针对空间分布基本一致的生境质量、固碳服务和土壤保持服务, 建立生态红线, 增强植被保护, 保护高坡森林, 调整森林结构, 增加生物多样性以增加植被覆盖度, 控制城市面积扩张, 减少人为干扰以免生物多样性进一步丧失. 在满足环境承载力的基础上, 进一步发展生态旅游, 建立或扩建自然保护区, 在促进当地财政收入的同时, 也可以为这些生态系统服务的维持提供经济激励. 其次, 针对水源涵养服务, 根据其主导因子(年降水量、年平均气温和GDP), 推动生态修复项目, 包括滩涂湿地恢复等, 控制温室气体的排放, 限制工业污染排放. 最后, 针对防风固沙服务, 加强三北防护林保护工程建设, 增强植被覆盖度, 构建生态屏障, 提高对气候和自然灾害的抵御能力.
本研究基于模型对5种生态系统服务质量进行估算, 模型中部分参数通过参考相关研究得到, 虽然整体结果与变化趋势与已有研究的结果基本一致[28, 30, 31], 但是参数选择以及基础数据分辨率的不同增加了结果的不确定性. 生态系统服务变化是一个复杂的过程, 未来研究中应该将更多的驱动因子考虑在内, 例如, 地貌类型、季风、造林面积和生态用地占比等.
4 结论(1)生境质量、碳储存和土壤保持高值主要分布在内蒙古自治区东四盟北部、黑龙江省北部和中北部、吉林省东部、辽宁省东部, 水源涵养高值主要分布在辽宁省东南部, 防风固沙服务高值主要分布在内蒙古自治区东四盟.
(2)林地对固碳服务和生境质量的空间分布解释力最强, 坡度对土壤保持服务的空间分布解释力最强, 年平均气温对防风固沙服务的空间分布解释力最强, 年降水量对水源涵养服务的空间分布解释力最强.
(3)各驱动因子之间的交互作用表现为非线性增强和双因子增强, 且主导交互因子的解释力均强于主导单因子. 不同的生态系统服务其最适宜因子范围也不同, 总体来看, 高植被覆盖度和适宜的温度最有利于生态系统服务的提升.
| [1] |
欧阳志云, 王如松, 赵景柱. 生态系统服务功能及其生态经济价值评价[J]. 应用生态学报, 1999, 10(5): 635-640. Ouyang Z Y, Wang R S, Zhao J Z, et al. Ecosystem services and their economic valuation[J]. Chinese Journal of Applied Ecology, 1999, 10(5): 635-640. DOI:10.3321/j.issn:1001-9332.1999.05.034 |
| [2] |
李若男, 刘睿. 生态系统服务评估在政策中的应用研究进展[J]. 环境保护科学, 2023, 49(2): 7-17. Li R N, Liu R. Research progress on application of ecosystem service assessment in policy[J]. Environmental Protection Science, 2023, 49(2): 7-17. |
| [3] | Carpenter S R, Mooney H A, Agard J, et al. Science for managing ecosystem services: Beyond the millennium ecosystem assessment[J]. Proceedings of the National Academy of Sciences of the United States of America, 2009, 106(5): 1305-1312. |
| [4] | Ayompe L M, Schaafsma M, Egoh B N. Towards sustainable palm oil production: the positive and negative impacts on ecosystem services and human wellbeing[J]. Journal of Cleaner Production, 2021, 278. DOI:10.1016/j.jclepro.2020.123914 |
| [5] |
钟绍卓, 孙浩源. 不同情景下祁连山国家级自然保护区生态系统服务时空变化及权衡与协同关系[J]. 水土保持研究, 2023, 30(5): 358-369. Zhong S Z, Sun H Y. Assessment on spatiotemporal variation and synergies/tradeoffs relationships of ecosystem services in Qilian Mountain National Nature Reserve under different scenarios[J]. Research of Soil and Water Conservation, 2023, 30(5): 358-369. |
| [6] |
杨强强, 章翩, 邱小琮, 等. 宁夏回族自治区生态系统服务时空变化及其权衡研究[J]. 中国环境科学, 2023, 43(10): 5453-5465. Yang Q Q, Zhang P, Qiu X C, et al. Spatiotemporal changes and trade-off analysis of ecosystem services in Ningxia Hui Autonomous Region[J]. China Environmental Science, 2023, 43(10): 5453-5465. DOI:10.3969/j.issn.1000-6923.2023.10.043 |
| [7] |
刘永婷, 杨钊, 章翩, 等. 安徽省生态系统服务时空变化及权衡-协同关系[J]. 水土保持研究, 2023, 30(2): 413-421. Liu Y T, Yang Z, Zhang P, et al. Spatiotemporal change and trade-off/synergy relationships among multiple ecosystem services in Anhui province[J]. Research of Soil and Water Conservation, 2023, 30(2): 413-421. |
| [8] |
陈飞燕, 刘艳晓, 张倩, 等. 河南省生态系统服务价值的时空变化研究[J]. 信阳师范学院学报(自然科学版), 2023, 36(2): 173-179. Chen F Y, Liu Y X, Zhang Q, et al. Study on the spatio-temporal change of ecosystem service value in Henan province[J]. Journal of Xinyang Normal University (Natural Science Edition), 2023, 36(2): 173-179. |
| [9] |
戚丽萍, 栾兆擎, 魏勉, 等. 基于土地利用的江苏省各市生态系统服务价值时空变化研究[J]. 南京林业大学学报(自然科学版), 2023, 47(4): 200-208. Qi L P, Luan Z Q, Wei M, et al. Spatial and temporal variations of ecosystem service values in Jiangsu province based on land-use change[J]. Journal of Nanjing Forestry University (Natural Sciences Edition), 2023, 47(4): 200-208. |
| [10] |
魏家星, 倪雨淳, 寿田园, 等. 基于水-陆耦合生态系统服务的生态安全格局构建研究——以长三角生态绿色一体化发展示范区为例[J]. 生态学报, 2023, 43(13): 5305-5319. Wei J X, Ni Y C, Shou T Y, et al. Construction of ecological security pattern based on land-water coupling ecosystem services: a case study of Yangtze River Delta Ecological Greening Development Demonstration Area[J]. Acta Ecologica Sinica, 2023, 43(13): 5305-5319. |
| [11] |
陈田田, 黄强, 王强. 基于生态系统服务供需关系的成渝城市群生态安全分区识别[J]. 山地学报, 2022, 40(5): 727-740. Chen T T, Huang Q, Wang Q. Ecological security zoning identification of the Chengdu-Chongqing Urban Agglomeration based on supply-demand relation of ecosystem services[J]. Mountain Research, 2022, 40(5): 727-740. |
| [12] |
徐嘉, 许大为, 曲琛. 基于生态系统服务重要性的国土空间生态安全格局研究——以哈尔滨市域为例[J]. 西北林学院学报, 2023, 38(4): 304-312. Xu J, Xu D W, Qu C. Spatial ecological security pattern construction based on ecosystem service function evaluation——a case study of Harbin[J]. Journal of Northwest Forestry University, 2023, 38(4): 304-312. |
| [13] |
高明惠, 李成, 赵虎. 江苏省生态系统服务供需格局与影响因素[J]. 水土保持研究, 2023, 30(5): 315-324. Gao M H, Li C, Zhao H. Spatiotemporal pattern of supply-demand of ecosystem services and influencing factors in Jiangsu province[J]. Research of Soil and Water Conservation, 2023, 30(5): 315-324. |
| [14] |
郅宏宇, 张磊. 黄河流域生态系统服务供需匹配及生态管理分区研究[J]. 环境污染与防治, 2023, 45(5): 730-735. Zhi H Y, Zhang L. Supply and demand matching of ecosystem services and ecological management zoning in the Yellow River basin[J]. Environmental Pollution & Control, 2023, 45(5): 730-735. |
| [15] |
方朝阳, 蔡振饶, 赵华飞, 等. 南昌市主城区生态系统服务供需匹配的城乡梯度特征研究[J]. 生态与农村环境学报, 2023, 39(6): 713-722. Fang C Y, Cai Z R, Zhao H F, et al. Urban-rural gradient feature of matching ecosystem services supply and demand in the main area of Nanchang[J]. Journal of Ecology and Rural Environment, 2023, 39(6): 713-722. |
| [16] | Yu Y Y, Li J, Han L Q, et al. Research on ecological compensation based on the supply and demand of ecosystem services in the Qinling-Daba Mountains[J]. Ecological Indicators, 2023, 154. DOI:10.1016/j.ecolind.2023.110687 |
| [17] | Yohannes H, Soromessa T, Argaw M, et al. Spatio-temporal changes in habitat quality and linkage with landscape characteristics in the Beressa watershed, Blue Nile basin of Ethiopian highlands[J]. Journal of Environmental Management, 2021, 281. DOI:10.1016/j.jenvman.2020.111885 |
| [18] | Zhu C M, Zhang X L, Zhou M M, et al. Impacts of urbanization and landscape pattern on habitat quality using OLS and GWR models in Hangzhou, China[J]. Ecological Indicators, 2020, 117. DOI:10.1016/j.ecolind.2020.106654 |
| [19] | Zhang X, Lyu C, Fan X, et al. Spatiotemporal variation and influence factors of habitat quality in Loess Hilly and Gully Area of Yellow River Basin: a case study of Liulin County, China[J]. Land, 2022, 11(1). DOI:10.3390/land11010127 |
| [20] | Zhou Y, Li X H, Liu Y S. Land use change and driving factors in rural China during the period 1995-2015[J]. Land Use Policy, 2020, 99. DOI:10.1016/j.landusepol.2020.105048 |
| [21] |
赵红星, 石璟晶, 何瑞春, 等. "一带一路"沿线省域交通碳排放影响因素时空异质性[J]. 环境科学, 2024, 45(8): 4636-4647. Zhao H X, Shi J J, He R C, et al. Spatio-temporal heterogeneity of factors influencing transportation carbon emissions in provinces along the Belt and Road[J]. Environmental Science, 2024, 45(8): 4636-4647. |
| [22] |
龚仓, 王顺祥, 陆海川, 等. 基于地理探测器的土壤重金属空间分异及其影响因素分析研究进展[J]. 环境科学, 2023, 44(5): 2799-2816. Gong C, Wang S X, Lu H C, et al. Research progress on spatial differentiation and influencing factors of soil heavy metals based on geographical detector[J]. Environmental Science, 2023, 44(5): 2799-2816. |
| [23] |
邵嘉豪, 李晶, 闫星光, 等. 基于地理探测器的山西省2000~2020年NPP时空变化特征及驱动力分析[J]. 环境科学, 2023, 44(1): 312-322. Shao J H, Li J, Yan X G, et al. Analysis of spatiotemporal variation characteristics and driving forces of NPP in Shanxi province from 2000 to 2020 based on Geodetector[J]. Environmental Science, 2023, 44(1): 312-322. |
| [24] |
郑亚平, 张俊华, 田惠文, 等. 大别山区生境质量时空特征及自然-人为因素驱动机制[J]. 环境科学, 2024, 45(4): 2268-2279. Zheng Y P, Zhang J H, Tian H W, et al. Spatio-temporal characteristics of habitat quality and natural-human driven mechanism in Dabie Mountain area[J]. Environmental Science, 2024, 45(4): 2268-2279. |
| [25] |
黄欣, 彭双云, 王哲, 等. 基于地理探测器的云南省生态系统产水服务的空间异质性及驱动因素[J]. 应用生态学报, 2022, 33(10): 2813-2821. Huang X, Peng S Y, Wang Z, et al. Spatial heterogeneity and driving factors of ecosystem water yield service in Yunnan province, China based on Geodetector[J]. Chinese Journal of Applied Ecology, 2022, 33(10): 2813-2821. |
| [26] |
孙滨峰, 赵红, 逯非, 等. 东北森林带森林生态系统固碳服务空间特征及其影响因素[J]. 生态学报, 2018, 38(14): 4975-4983. Sun B F, Zhao H, Lu F, et al. Spatial and temporal patterns of carbon sequestration in the Northeastern Forest Regions and its impact factors analysis[J]. Acta Ecologica Sinica, 2018, 38(14): 4975-4983. |
| [27] |
齐麟, 张月, 许东, 等. 东北森林屏障带生态系统服务权衡与协同关系[J]. 生态学杂志, 2021, 40(11): 3401-3411. Qi L, Zhang Y, Xu D, et al. Trade-offs and synergies of ecosystem services in forest barrier belt of Northeast China[J]. Chinese Journal of Ecology, 2021, 40(11): 3401-3411. |
| [28] |
张斯屿. 东北天然林保护工程森林态系统服务功能变化评估(1992—2015)[D]. 长春: 中国科学院大学(中国科学院东北地理与农业生态研究所), 2019. Zhang S Y. Evaluation of forest ecosystem service change in NFPP area in Northeast China from 1992 to 2015[D]. Changchun: University of Chinese Academy of Sciences (Northeast Institute of Geography and Agroecology, Chinese Academy of Sciences), 2019. |
| [29] |
李慧颖. 基于遥感和InVEST模型的辽宁省退耕还林工程生态效应评估[D]. 长春: 吉林大学, 2019. Li H Y. The evaluation on ecological effects of the project of returning farmland to forest in Liaoning province, based on remote sensing and InVEST model[D]. Changchun: Jilin University, 2019. |
| [30] |
相恒星, 王宗明, 毛德华. 东北地区天然林资源保护工程生态保护成效分析[J]. 中国科学院大学学报, 2021, 38(3): 314-322. Xiang H X, Wang Z M, Mao D H. Ecological effect of natural forest protection project in Northeast China[J]. Journal of University of Chinese Academy of Sciences, 2021, 38(3): 314-322. |
| [31] |
祁宁, 赵君, 杨延征, 等. 基于服务簇的东北地区生态系统服务权衡与协同[J]. 生态学报, 2020, 40(9): 2827-2837. Qi N, Zhao J, Yang Y Z, et al. Quantifying ecosystem service trade-offs and synergies in Northeast China based on ecosystem service bundles[J]. Acta Ecologica Sinica, 2020, 40(9): 2827-2837. |
| [32] |
肖骁, 穆治霖, 赵雪雁, 等. 基于RS/GIS的东北地区森林生态系统服务功能价值评估[J]. 生态学杂志, 2017, 36(11): 3298-3304. Xiao X, Mu Z L, Zhao X Y, et al. RS/GIS-based evaluation of forest ecosystem service value in Northeast China[J]. Chinese Journal of Ecology, 2017, 36(11): 3298-3304. |
| [33] |
刘家福, 席兰兰, 张尧, 等. 基于CA-Markov与InVEST模型的吉林省生态系统服务价值模拟及预测[J]. 水土保持通报, 2020, 40(6): 153-159. Liu J F, Xi L L, Zhang Y, et al. A study on simulation and prediction of ecosystem service value in Jilin province based on CA-Markov and InVEST model[J]. Bulletin of Soil and Water Conservation, 2020, 40(6): 153-159. |
| [34] |
吴金华. 东北地区植被时空动态变化检测及驱动因子量化研究[D]. 北京: 中国环境科学研究院, 2021. Wu J H. The spatial and temporal dynamic change detection of vegetation and the quantification of driving factors in Northeast China[D]. Beijing: Chinese Research Academy of Environment Sciences, 2021. |
| [35] |
杨喆, 褚琳, 肖燚彬, 等. 2017—2021年东北地区主要粮食作物覆盖类型时空演变及其影响因素[J]. 资源科学, 2023, 45(5): 966-979. Yang Z, Chu L, Xiao Y B, et al. Spatiotemporal changes and driving forces of main grain crop planting types in Northeast China from 2017 to 2021[J]. Resources science, 2023, 45(5): 966-979. |
| [36] | 丛东来, 樊千, 邱晖. 基于分位数回归的东北地区城市化驱动因子分析[J]. 商业经济研究, 2015(13): 138-140. |
| [37] |
王绍强, 周成虎, 刘纪远, 等. 东北地区陆地碳循环平衡模拟分析[J]. 地理学报, 2001, 56(4): 390-400. Wang S Q, Zhou C H, Liu J Y, et al. Simulation analyses of terrestrial carbon cycle balance model in Northeast China[J]. Acta Geographica Sinica, 2001, 56(4): 390-400. |
| [38] |
石淞, 李文, 丁一书, 等. 东北地区植被时空演变及影响因素分析[J]. 中国环境科学, 2023, 43(1): 276-289. Shi S, Li W, Ding Y S, et al. Spatiotemporal evolution and influencing factors of vegetation in Northeast China[J]. China Environmental Science, 2023, 43(1): 276-289. |
| [39] |
杜倩, 魏晨辉, 梁陈涛, 等. 中国东北地区12个建群树种对气候变化响应的MaxEnt模型分析[J]. 生态学报, 2022, 42(23): 9712-9725. Du Q, Wei C H, Liang C T, et al. Future climatic adaption of 12 dominant tree species in Northeast China under 3 climatic scenarios by using MaxEnt modeling[J]. Acta Ecologica Sinica, 2022, 42(23): 9712-9725. |
| [40] | Peng S Z, Ding Y X, Liu W Z, et al. 1 km monthly temperature and precipitation dataset for China from 1901 to 2017[J]. Earth System Science Data, 2019, 11(4): 1931-1946. |
| [41] | Jing W L, Yang Y P, Yue X F, et al. A spatial downscaling algorithm for satellite-based precipitation over the Tibetan Plateau based on NDVI, DEM, and Land Surface Temperature[J]. Remote Sensing, 2016, 8(8). DOI:10.3390/rs8080655 |
| [42] |
荆文龙, 冯敏, 杨雅萍. 一种NCEP/NCAR再分析气温数据的统计降尺度方法[J]. 地球信息科学学报, 2013, 15(6): 819-828. Jing W L, Feng M, Yang Y P. A statistical downscaling approach of NCEP/NCAR reanalysis temperature data[J]. Journal of Geo-information Science, 2013, 15(6): 819-828. |
| [43] |
王开存. 均一化中国陆表气候观测格点数据集(地表太阳辐射、地表风速、相对湿度和陆表蒸散)[DB/OL]. 国家青藏高原科学数据中心, https://doi.org/10.11888/Atmos.tpdc.272817, 2022. Wang K C. Homogeneous grid dataset of Chinaese land surface observation (surface solar radiation, surface wind speed, relative humidity and land surface evapotranspiration)[DB/EL]. National Tibetan Plateau/Third Pole Environment Data Center, https://doi.org/10.11888/Atmos.tpdc.272817, 2022. |
| [44] | Che T, Li X, Jin R, et al. Snow depth derived from passive microwave remote-sensing data in China[J]. Annals of Glaciology, 2008, 49: 145-154. |
| [45] | Dai L Y, Che T, Ding Y J. Inter-calibrating SMMR, SSM/I and SSMI/S data to improve the consistency of snow-depth products in China[J]. Remote Sensing, 2015, 7(6): 7212-7230. |
| [46] | Dai L Y, Che T, Ding Y J, et al. Evaluation of snow cover and snow depth on the Qinghai–Tibetan Plateau derived from passive microwave remote sensing[J]. The Cryosphere, 2017, 11(4): 1933-1948. |
| [47] | Fischer G, Nachtergaele F, Prieler S, et al. Global agro-ecological zones assessment for agriculture (GAEZ 2008)[DB/EL]. IIASA, Laxenburg, Austria and FAO, Rome, Italy. http://poles.tpdc.ac.cn/zh-hans/data/literature/172b6155-896d-4ac2-8349-df1b3cf72993/, 2008. |
| [48] |
包玉斌. 基于InVEST模型的陕北黄土高原生态服务功能时空变化研究[D]. 西安: 西北大学, 2015. Bao Y B. Temporal and spatial change of ecological services on Loess Plateau of Shaanxi by InVEST model[D]. Xi'an: Northwest University, 2015. |
| [49] |
王治良. 嫩江流域湿地自然保护区空缺(GAP)分析[D]. 长春: 中国科学院大学(中国科学院东北地理与农业生态研究所), 2016. Wang Z L. GAP analysis of wetland nature reserve in Nenjiang River Basin, Northeast China[D]. Changchun: University of Chinese Academy of Sciences (Northeast Institute of Geography and Agroecology, Chinese Academy of Sciences), 2016. |
| [50] | Lai L, Huang X J, Yang H, et al. Carbon emissions from land-use change and management in China between 1990 and 2010[J]. Science Advances, 2016, 2(11). DOI:10.1126/sciadv.1601063 |
| [51] | 徐新良. 中国GDP空间分布公里网格数据集[DB/OL]. 资源环境科学数据注册与出版系统. https://doi.org/10.12078/2017121102, 2017. |
| [52] | 徐新良. 中国人口空间分布公里网格数据集[DB/OL]. 资源环境科学数据注册与出版系统. https://doi.org/10.12078/2017121101, 2017. |
| [53] |
何刘洁, 郑博福, 万炜, 等. 长江经济带生态系统服务权衡与协同及其驱动因素[J]. 环境科学, 2024, 45(6): 3318-3328. He L J, Zheng B F, Wan W, et al. Trade-off and synergy of ecosystem services in the Yangtze River Economic Belt and its driving factors[J]. Environmental Science, 2024, 45(6): 3318-3328. |
| [54] |
王彬宇, 王玲, 陈俊辰, 等. 四湖流域生态功能分区及其影响因素识别[J]. 应用生态学报, 2023, 34(10): 2757-2766. Wang B Y, Wang L, Chen J C, et al. Identification of ecological functional zoning and its influencing factors in the Sihu Lake Basin, China[J]. Chinese Journal of Applied Ecology, 2023, 34(10): 2757-2766. |
| [55] | Cai Z C, Zhang Z, Zhao F, et al. Assessment of eco-environmental quality changes and spatial heterogeneity in the Yellow River Delta based on the remote sensing ecological index and geo-detector model[J]. Ecological Informatics, 2023, 77. DOI:10.1016/j.ecoinf.2023.102203 |
| [56] |
王劲峰, 徐成东. 地理探测器: 原理与展望[J]. 地理学报, 2017, 72(1): 116-134. Wang J F, Xu C D. Geodetector: Principle and prospective[J]. Acta Geographica Sinica, 2017, 72(1): 116-134. |
| [57] |
古圳威, 刘京, 陈怡, 等. 陕西渭北旱塬区生境质量及碳储量时空演变分析与模拟[J]. 环境科学, 2023, 44(8): 4666-4678. Gu Z W, Liu J, Chen Y, et al. Analysis and simulation of the spatiotemporal evolution of habitat quality and carbon storage in the Weibei Dry Plateau Region of Shaanxi[J]. Environmental Science, 2023, 44(8): 4666-4678. |
| [58] |
陈实, 黄银兰, 金云翔. 退耕还林(草)工程实施前后黄河中游生境质量时空变化分析[J]. 干旱区研究, 2023, 40(3): 456-468. Chen S, Huang Y L, Jin Y X. Spatiotemporal changes of habitat quality before and after the implementation of Grain for Green Project in the middle reaches of the Yellow River[J]. Arid Zone Research, 2023, 40(3): 456-468. |
| [59] | Li J W, Dong S C, Li Y, et al. Effects of land use change on ecosystem services in the China–Mongolia–Russia economic corridor[J]. Journal of Cleaner Production, 2022, 360. DOI:10.1016/j.jclepro.2022.132175 |
| [60] |
王彦武, 罗玲, 张峰, 等. 民勤县绿洲边缘固沙林防风蚀效应研究[J]. 西北林学院学报, 2018, 33(4): 64-70. Wang Y W, Luo L, Zhang F, et al. Windbreak effect of sand-fixation forest on the edge of oasis in Minqin[J]. Journal of Northwest Forestry University, 2018, 33(4): 64-70. |