 2024, Vol. 45


2. 哈尔滨工业大学城市水资源与水环境国家重点实验室,哈尔滨 150090
2. State Key Laboratory of Urban Water Resource and Environment, Harbin Institute of Technology, Harbin 150090, China
我国污水处理设施不断完善, 至2020年, 共有11 055座城镇污水处理厂(wastewater treatment plants, WWTPs), 年污水处理量557.28亿m3[1]. 污水处理会造成大量的温室气体排放, 分别是消耗化石燃料、电力和化学药剂产生的二氧化碳(CO2), 及来自于生物化学反应过程的非CO2温室气体——甲烷(CH4)和氧化亚氮(N2O). CH4产生于污水处理厌氧区或污泥厌氧消化过程, N2O产生于污水或污泥处理的生物脱氮环节. 经粗略估计, 2030年中国污水处理行业的温室气体排放总量(以CO2当量计)将达到3.65亿t, 占全国温室气体排放总量的2.95%[2], 故不容忽略. N2O性质稳定, 能存在于大气中长达114 a之久, 其全球变暖潜能值约为CO2的265倍[3]. 笔者的前期研究表明, 随着能源结构的绿色化, 包含生物脱氮过程中WWTPs的N2O排放产生的气候变化环境影响占比可高达53.62%[4]. 因此, 以准确量化为基础的污水处理N2O排放控制与消减对实现温室气体减排目标至关重要.
WWTPs中N2O排放的量化方法有3种, 分别为排放因子法、实测法和数学模型计算法. 排放因子法是排放清单研究最常用的方法之一, 也被用于污水处理过程中的温室气体排放核算. 联合国政府间气候变化专门委员会(IPCC)通过对13篇文献的30条数据整理[5], 给出了集中式好氧处理系统的排放因子(以N2O-N/Ninfluent计)为:0.016(0.000 16~0.045)kg·kg-1. 然而, 该系数除离散程度较大导致均值的代表性较差外, 还存在以下两个问题. 一是该系数基于进水总氮(TN)负荷进行线性拟合获得, 即默认N2O的排放量与进水TN负荷成正相关, 必须以所有WWTPs具有相同的TN去除率为假设条件, 这显然是不合理的. 二是IPCC引用了部分错误文献数据, de Hass等[6]和中国城镇供水排水协会[7]经过校正后, 将N2O的平均排放因子(以N2O-N/Ninfluent计)分别修正为0.011 kg·kg-1和0.009 kg·kg-1. 可见IPCC提供的排放因子会高估N2O的排放量. 当排放因子(以N2O/Ninfluent计)每提高0.010 kg·kg-1, WWTPs温室气体排放量的核算结果会增加30%[8]. 因此, N2O的排放因子不但具有个体差异性, 而且其取值的合理性对于WWTPs制定温室气体的排放控制与消减方案也非常重要.
通过实测法获得数据对于具体WWTPs的N2O排放研究的重要性是毋庸置疑的. 实测法分为离线监测和在线监测. 离线监测为先用气体采样袋、气体通量罩或静态箱采集代表性点位的样品, 然后在实验室利用检测仪器定量分析气体样品中的N2O含量, 并计算出全厂的排放量[9]. 例如, Czepiel等[10]和Sun等[11]通过每周或每月取样, 研究了传统活性污泥(CAS)、厌氧-缺氧-好氧(AAO)和序批式活性污泥(SBR)WWTPs中不同处理单元的N2O的排放通量. 然而, 离线监测面临两大问题, 分别是现场样品采集手段不同带来的误差和短期低频率采样无法捕捉N2O的动态变化[12,13]. 多点布设的在线监测可全面检测N2O排放的动态变化[14,15], 但其复杂的测量方法和昂贵的设备使得其并未在国内推广.
动态数学模型作为一种优秀的工具, 可基于N2O产生的生物途径, 对不同污水处理设施的N2O排放进行精确量化, 以评估不同运行条件对温室气体排放的影响[16,17]. Ni等[18]和Solís等[19]均成功预测了生产规模的WWTPs的N2O排放, 并筛选出影响N2O排放的具体参数. 但由于机制模型参数较多, 校准和验证过程需要大量的长期数据, 故在实际应用中存在挑战[20]. 然而, 当具有高度动态和长期的实际WWTPs数据时, 采用模型法不仅可以捕捉N2O排放的动态变化, 还可以拟合其与进出水水质和运行条件的关系, 构建适用于该厂和同工艺近似运行条件的WWTPs的排放因子, 进而为污水处理行业温室气体控制策略的制定提供重要的帮助.
综上, 本文首先基于文献统计了现有的N2O排放因子, 对可能导致N2O排放因子差异的因素进行了区域和工艺归因, 进而修正并分类细化可用于年排放量快速核算的排放因子. 以我国最具代表性的AAO工艺WWTP为案例分析, 采用数学模型全面量化实际WWTP中N2O的动态排放行为, 证明N2O排放具有高度的时间变化性、与TN去除率之间的相关性以及运行良好的WWTP低N2O的排放可能性. 最后, 建立了N2O排放因子与TN去除率之间的数学关系, 以适用于逐日或逐月核算WWTP的N2O排放量, 以期为其他WWTPs精确量化N2O的排放提供参考.
1 材料与方法 1.1 基于文献统计的N2O排放因子数据库为了更好地统计目前WWTPs中N2O的排放情况, 本研究以中国知网和谷歌学术(Google Scholar)作为主要的学术数据库, 搜索2000年至今与WWTPs的N2O排放相关论文. 检索中文文献时主要用到的词汇有:废水/污水处理厂、氧化亚氮、N2O、排放因子、温室气体、碳排放和碳足迹. 检索英文文献主要用到的词汇包括:“wastewater”“wastewater treatment plant”“nitrous oxide”“N2O”“emission factor”“GHG”“greenhouse gas” “carbon emission” “carbon footprint”. 为了保证本研究纳入的文献是最相关的、最完整的和最科学的, 制定了如下的文献筛选标准. ①文章的研究主题和内容与WWTPs的N2O排放密切相关;②WWTPs为全规模WWTPs而非实验型污水处理设备;③N2O排放量均为WWTPs的实测数据而非经验估算值. 通过文献检索和筛选程序, 本文最终确定52篇符合要求的研究文献, 涵盖126个有效的实证研究, 提取的数据包括:“题目” “作者” “国家” “出版年份”“引用次数” “出版期刊” “N2O排放因子” “TN去除率” “进水流量” “进水TN浓度” “处理工艺”等.
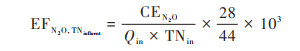
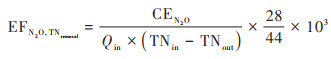
1.2 N2O排放因子的标准化表达转化为使得上述文献提取出的N2O排放量具有可比性, 需对N2O排放量进行标准化处理. 其中IPCC定义的N2O排放因子为基于进水TN负荷(以N2O-N/Ninfluent计, 下同, kg·kg-1), 其他常用的表达式包括:基于进水氨氮(NH4+-N)负荷或污染物(NH4+-N和TN)去除量等[21,22]. 目前, 国内最常见的两种表示方式为基于进水TN负荷的N2O排放因子(EFN2O, TNinfluent, 以N2O-N/Ninfluent计, 下同, kg·kg-1)和基于TN去除量的N2O排放因子(EFN2O, TNremoval, 以N2O-N/Nremoval计, 下同, kg·kg-1)[7,23]. 前者有助于消除进水氮负荷差异, 尤其是不同WWTPs之间的差异, 使排放因子可比较;后者更有助于考虑污水处理过程差异和TN去除效果, 对具体污水处理工艺和实际操作条件进行温室气体排放评估[24]. 因此, 本文将上述52篇文献的126个有效数据分别转化为EFN2O, TNinfluent和EFN2O, TNremoval用于后续统计研究, 具体转化计算过程见公式(1)和公式(2).
|
(1) |
|
(2) |
式中, CEN2O为WWTPs污水处理过程N2O的排放量, kg·d-1;Qin为WWTPs的进水量, m3·d-1;TNin为WWTPs进水TN质量浓度, mg·L-1;TNout为WWTPs出水TN质量浓度, mg·L-1;28/44为转换系数(以N2O-N/N2O计).
1.3 基于指数拟合的案例WWTP的N2O排放分析 1.3.1 案例WWTP概况本案例WWTP位于哈尔滨市, 采用AAO工艺, 总处理水量为1.0×10⁵ m3·d-1. 二级生化处理出水进入砂滤池深度净化排放, 剩余污泥经过浓缩脱水后(含水率60%)填埋. WWTP的设计参数、内外回流的设置、进水组分和模型建立详细过程见Abulimiti等[4]的研究.
1.3.2 N2O模型的建立与校准采用加拿大Dynamita公司的SUMO软件和内嵌的Sumo-4N活性污泥模型建立WWTPs数字孪生模型. 该模型描述了7种细菌生成路径, 可动态模拟构筑物的N2O排放, 主要考虑氨氧化细菌(AOB)的双路径途径[25]. 包括:①AOB的羟胺(NH2OH)氧化途径(NN途径), AOB将铵根(NH4+)经过氨氮加氧酶(AMO)催化下生成NH2OH, NH2OH在羟胺氧化还原酶(HAO)催化下生成亚硝基自由基(NOH)或一氧化氮(NO)中间体, 进而产生N2O. ②AOB的自养反硝化途径(ND途径), AOB在亚硝酸盐还原酶(Nir)和NO还原酶(Nor)催化下, 以亚硝酸根(NO2-)为末端电子受体逐步还原为N2O. 此外, 本案例对Sumo-4N模型包含的384个动态参数和化学计量参数, 以及15个水质成分参数进行了初步筛选, 得出35个关键动力学参数和15个水质成分参数, 其余的采用默认参数. 通过对这50个关键参数进行敏感性分析, 进一步筛选出对水质指标影响较大的参数. 本研究采用单灵敏度分析, 通过相对灵敏度因子(|RSF|)与0.1比较, |RSF| ≥ 0.1时认为参数影响较大[26]. 表 1揭示了对水质影响较大的关键参数, 为后续校准提供依据. 其中, μAOB对出水NH4+-N的|RSF|大小为1.43, frSU, SCCOD对化学需氧量(COD)的|RSF|大小为2.35, 均属于非常敏感.
|
|
表 1 关键参数的敏感性及影响因素 Table 1 Sensitivity and influencing factors of key parameters |
进水数据为2020年6月至2021年5月共计365 d的在线测量仪器实测数据, 其中进水污染物的质量浓度:ρ(COD)、ρ(TN)、ρ(NH4+-N)和ρ[总磷(TP)]的范围为186~1 945、17.10~112.60、1.30~62.19和1.48~19.46 mg·L-1, 进水数据均为每2 h测量一次. 经稳态模拟校准和动态模拟验证后, 结果如图 1所示. COD和TN的|RSF|波动在9%以内, TP的|RSF|波动在14.2%以内. 虽然传感器在低质量浓度下存在精度不足的问题, 导致NH4+-N数据拟合误差较大, 但总体上模型预测与实测数据吻合较好, 可用于N2O排放预测.

|
图 1 案例WWTP出水NH4+-N、TP、TN和COD的模拟校核结果 Fig. 1 Simulation calibration results for NH4+-N, TP, TN, and COD in the effluent from the case WWTP |
N2O排放量可以通过进水TN负荷或TN去除量来预测[22]. Valkova等[27]研究发现TN去除率与EFN2O, TNinfluent呈负相关, 相关系数高达0.86. 本研究先基于案例WWTP获得的两组4 379个全年动态模拟N2O排放因子(EFN2O, TNinfluent和EFN2O, TNremoval)的散点数据, 分别与TN去除率进行线性拟合, 寻找TN去除率与两者之间的关系. 后依据Valkova等[27]的方法, 采用分类平均值的拟合方法来评估N2O排放因子与TN去除率之间的关系. 该方法首先将TN去除率精确到两位有效数字后, 按TN去除率对两组(每组4 379个)EFN2O, TNinfluent和EFN2O, TNremoval进行分类, 把具有相同TN去除率的排放因子的散点划分成一个子集, 依次计算各TN去除率(47%~94%)对应的子集中N2O的平均排放因子:基于进水TN负荷的N2O平均排放因子(EFN2O, TNinfluent)和基于TN去除量的N2O平均排放因子(EFN2O, TNremoval). 然后将EFN2O, TNinfluent和EFN2O, TNremoval与所对应的TN去除率建立指数关系, 得到指数回归方程预测N2O的排放量. 最后, 通过与现有文献中的国内WWTPs实测排放因子进行对比, 验证排放因子的合理性, 并依据《污水处理厂低碳运行评价技术规范》的TN去除率划分范围[28], 计算不同TN去除率范围下EFN2O, TNremoval的平均值, 以便于快速计算N2O的排放量.
2 结果与讨论 2.1 基于文献统计的各国WWTPs的N2O排放因子在52篇有效文献中, 有1篇文献的研究横跨2个大洲, 其余51篇文献的研究位于单个大洲. 13篇文献的研究位于中国, 6篇位于除中国外的亚洲地区, 24篇位于欧洲地区, 3篇位于北美地区, 2篇位于南美地区, 5篇位于大洋洲地区. 可见, 中国区域内WWTPs针对N2O排放的研究较为丰富, 欧洲对N2O的重视程度更大, 其它地区对该问题的关注较少.
本文统计全球尺度下EFN2O, TNinfluent的范围为0.000 01~0.080 00 kg·kg-1, 平均值为0.007 77 kg·kg-1, 与IPCC给出的推荐值(0.016 00 kg·kg-1)相比, 降低了51.44%. 表 2汇总了已发表文献中19个国家的N2O排放实测因子, 除瑞士外, 其余国家的EFN2O, TNinfluent平均值均小于IPCC的推荐值. 中国现有活动统计的EFN2O, TNinfluent的平均值为0.011 33 kg·kg-1, 这个值是IPCC推荐值的70.81%, 高于52篇文献平均值的45.82%. 若使用IPCC推荐的排放因子很可能会高估N2O的排放量, 进而增加了WWTPs的碳足迹. 鉴于IPCC的推荐值是基于2018及以前的13篇文献整理所得的, 且部分数据来自于实验室研究, 而非实际运行的WWTPs[6], 其普适性有待进一步地商榷. 本研究利用Kruskal-Wallis(K-W)检验统计国家地域因素对N2O排放因子的影响, 发现地域因素对N2O排放因子的影响具有显著性差异(P = 0.025 < 0.05), 这可能是由各国WWTPs的水质或运行条件存在差异所导致的.
|
|
表 2 基于文献统计的各国EFN2O, TNinfluent/kg·kg-1 Table 2 EFN2O, TNinfluent by country based on literature statistics/kg·kg-1 |
无论是在全球尺度下, 还是各国的统计数据均显示EFN2O, TNinfluent的值变化很大, 标准差为0.012 27. 排放因子对最终温室气体核算结果产生显著影响. 例如, Maktabifard等[29]通过对6个WWTPs的不确定性水平分析, 发现以最高和最低的N2O排放因子计算后, 碳足迹相差131%~233%. 可见, 采用统一的缺省排放因子不能准确评估WWTPs的N2O排放情况. 因此, 各国宜针对本土WWTPs的实际运行情况, 开展长期监测活动或模型模拟计算, 分类制定适合本土的N2O排放因子.
对目前已发表的基于我国特大城市实际WWTPs的统计发现, WWTPs所在的省市不同, N2O排放因子也不相同(表 3). 同样用K-W检验得出中国省市地域因素对EFN2O, TNinfluent有显著影响(P = 0.031 < 0.05). 其中, 北京EFN2O, TNinfluent的平均值最高, 为0.018 21 kg·kg-1, 是其它城市的1.89~27.18倍, 主要是由于北京的统计值包含5个SBR工艺WWTPs, 其EFN2O, TNinfluent分别为(0.018 60、0.065 20、0.019 50、0.056 00和0.026 90 kg·kg-1), 而其他城市(除青岛外)均未包含该工艺. 文献报道SBR的排放因子远高于其他工艺的排放因子[79], 进而拉高了北京市的平均值, 并使标准差高达0.020 54. 因此, 除地域等因素的影响外, 工艺对N2O排放也会有较大影响.
|
|
表 3 基于文献统计的中国特大城市WWTPs实测EFN2O, TNinfluent/kg·kg-1 Table 3 Measured EFN2O, TNinfluent from Chinese mega-city WWTPs based on literature statistics / kg·kg-1 |
2.2 基于文献统计的不同工艺对N2O排放的影响
IPCC指南中并未区分不同工艺的差异性, 采用统一的排放因子, 这在国家层面的温室气体核算中是可行的. 但是对于低碳协同降污的工艺比选, 采用统一的排放因子不能区分工艺类型之间的差异[7]. 因此, 需要在数据收集的基础上, 建立可靠的排放因子数据库, 将排放因子与处理工艺和运行参数等严格相关, 实现N2O排放量的准确计算. 然而, 这项任务极具挑战性.
图 2(a)显示了实际运行WWTPs不同工艺条件下EFN2O, TNinfluent变化情况. 结果表明不同工艺之间的排放因子差异较大, 这部分可以归因于工艺的特定运行和控制参数的不同[79]. 基于文献汇总AAO工艺的EFN2O, TNinfluent平均值为0.005 31(0.000 35~0.019 50)kg·kg-1. 与其他工艺相比, SBR具有较高的EFN2O, TNinfluent, 平均值为0.021 18(0.001 33~0.065 20)kg·kg-1, 这与间歇运行时NH4+和NO2-浓度的突然变化, 或者与缺氧池沉降以及好氧阶段累积的溶解态N2O的突然释放有关[80]. 图 2(a)中AO工艺的EFN2O, TNinfluent变化较大(0.000 02~0.030 00 kg·kg-1), 可能是由于所统计的AO工艺水厂的TN去除率差别较大, 在45.00%~94.62%之间. 此外, 厌氧过程反硝化的不完全也会造成N2O的排放. 人工湿地(ET)的EFN2O, TNinfluent最低, 平均值为0.003 44(0.000 04~0.014 00)kg·kg-1, 这可能在于多为溶解态的N2O被生物硝化, 继而导致较低的N2O释放. 本文通过K-W检验发现N2O排放因子与工艺具有渐进显著性(P = 0.065), 这是因为大部分工艺对脱氮除磷都具有相似的效果. 但是对两组工艺进行Mann-Whitney U test(MWU)检验时, 发现除曝气生物滤池(BF)外, 其余工艺与SBR之间均有显著性差异(P < 0.05). 因此, 在对WWTPs温室气体核算时, 建议对SBR工艺进行单独测量和核算, 以便更加准确地评估WWTPs的温室气体排放情况.

|
数值为该工艺的平均值;CAS:传统活性污泥工艺, AAO:厌氧-缺氧-好氧工艺, AO:厌氧-好氧工艺, SBR:序批式反应器, BF:曝气生物滤池, ET:人工湿地 图 2 不同工艺的集中式WWTPs的N2O排放因子 Fig. 2 N2O emission factors for different processes in centralized WWTPs |
此外, 在所有的工艺分类下, EFN2O, TNinfluent的变化幅度小于EFN2O, TNremoval(图 2). 这是因为相同工艺不同操作条件下, 或同一WWTP的不同进水条件下均会导致不同的TN去除率. 将进水TN负荷与EFN2O, TNinfluent和EFN2O, TNremoval做皮尔逊相关性分析发现, 进水TN负荷与两个N2O排放因子并无显著相关性(R2 = -0.020和R2=-0.027). 相反, 将TN去除率与EFN2O, TNinfluent和EFN2O, TNremoval进行相关性分析发现, TN去除率与EFN2O, TNinfluent并无相关性(R2 = -0.043), 与EFN2O, TNremoval呈弱负相关(R2 = -0.261), 相关性显著(P < 0.01). 因此, 考虑到不同工艺对TN的去除效果不同, 笔者认为, N2O产生于生物脱氮过程, EFN2O, TNremoval比EFN2O, TNinfluent更符合生物处理化学计量学. 为了进一步验证TN去除率与EFN2O, TNremoval和EFN2O, TNinfluent之间的关系, 本研究将以一个实际AAO工艺WWTP为案例进行分析, 寻找合适的数学关系, 用于建立N2O精确核算的方法学.
2.3 基于指数拟合的案例WWTP的N2O排放因子 2.3.1 N2O的排放量的动态变化如图 3(a)所示, 案例WWTP的N2O逐月排放量存在较大变化, 在12月最高, 为440.4 kg, 约是最低值8月值(153.3 kg)的3倍, 次峰值在4月(390.4 kg). 这是因为12月的进水ρ(COD)和ρ(TN)的平均值最高, 分别为679.35 mg·L-1和47.63 mg·L-1. 相关性分析发现进水ρ(TN)与N2O排放量的相关系数呈中度正相关(R2 = 0.409). 在污水处理中, 会有一部分TN通过AOB和NOB等菌群的共同作用转化为N2O, 因此氮负荷的增加有利于AOB的生长, 且有利于好氧反应器中N2O的形成[81]. 相反, 8月进水ρ(COD)和ρ(TN)的平均值分别为415.06 mg·L-1和40.32 mg·L-1, 对比其他月份处于较低水平. 4月N2O的激增可能与春季生物处理过程中NO2-的积累有关(R2 = 0.350). NO2-的积累会造成硝化过程不平衡, 进而引起不完全反硝化过程中N2O的峰值排放[9].

|
图 3 基于动态模拟下案例WWTP的N2O排放量 Fig. 3 N2O emissions from the case WWTP based on dynamic simulation |
但基于动态模拟统计全年WWTPs的N2O排放时可以观察到明显的季节性, 冬季和春季(11月至次年5月)的排放量大于夏季(6~8月), 这可能和该区域部分工厂季节性生产及居民的季节性城乡二元居住有关. 用K-W检验分析各季节条件下的N2O排放情况发现, 季节性对N2O排放具有显著影响(P=0.000 < 0.05). 其中冬季和春季进水ρ(COD)平均值分别为530.82 mg·L-1和555.20 mg·L-1, 进水ρ(TN)平均值分别为42.92 mg·L-1和45.81 mg·L-1, 均高于夏季进水污染物[ρ(COD)为469.95 mg·L-1, ρ(TN)为40.92 mg·L-1]. 进水污染物的激增容易导致反硝化不充分和NO2-的积累. Gruber等[62]研究发现没有季节性排放差异的或低N2O排放因子(EFN2O, TNinfluent在0.002~0.005 kg·kg-1之间)的WWTPs, 其出水中NO2-的浓度非常低, 以上WWTPs都具备反硝化工艺条件且全年进行充分反硝化. 可见为了避免NO2-的积累, 全年反硝化似乎是一种有效的策略. 本案例中, 排放峰值月份(4、11和12月)对总排放量的贡献占比高达36.61%, 这表明迫切需要深入探究WWTPs季节性排放差异的原因[41]. 这也意味着制定减排策略应以至少1年的数据活动为基础并进行测试[82].
N2O排放的月内变化见图 3(b), 月内的日差异均较大. 例如1月, N2O的日排放量的范围在2.30~64.14 kg·d-1之间, 最高值是最低值的27.89倍. 这些变化再次证明冬季低温条件下硝化作用的不平衡会导致NH4+和NO2-离子的积累, 进而引起N2O的剧烈变化[64]. Daelman等[52]对WWTPs进行长期监测时也观察到了N2O排放具有较大的季节性变化和日变化. 采用动态模拟估算案例WWTP全年N2O排放量(以CO2当量计, 下同)为981.4 t, 约为根据IPCC推荐排放因子计算的N2O排放量(8 901.3 t)的11%, 这再一次论证了采用IPCC的排放因子可能会高估N2O的排放情况, 更无法捕捉N2O排放的季节性变化和日变化. 相反, 通过长期数控校准的动态模型不仅可以有效反映WWTPs中N2O的动态变化, 还可以对WWTPs中N2O排放进行准确核算.
2.3.2 N2O排放因子的线性拟合与分类指数拟合模型通过动态模拟得出案例WWTP的EFN2O, TNremoval范围为0.000 28~0.013 31 kg·kg-1, EFN2O, TNinfluent的范围为0.000 24~0.009 35 kg·kg-1, 且EFN2O, TNinfluent的值均低于EFN2O, TNremoval. Foley等[35]的研究报道发现与实现部分反硝化的WWTPs相比, 实现几乎完全脱氮(高TN去除)的WWTPs会有更低的N2O排放因子. 本研究和Gruber等[62]对瑞士WWTPs的监测均揭示了N2O排放因子与TN去除率之间能建立相关性, 且进出水TN质量浓度具有较高的数据可用性. 因此, 本文将EFN2O, TNremoval和EFN2O, TNinfluent两类散点数据与TN去除率进行线性拟合(图 4). 由于数据的复杂性和非线性特征, EFN2O, TNremoval和EFN2O, TNinfluent虽和TN去除率呈负相关, 但线性相关性很低, R2分别为0.082和0.012. 可见, 这种拟合方法效果不佳.

|
图 4 基于动态模拟的案例WWTP的N2O排放因子与TN去除率的线性拟合模型 Fig. 4 Linear fitting model of N2O emission factor and TN removal rate in the case WWTP based on dynamic simulation |
基于分类平均值的指数拟合方法结果如图 5所示:与散点线性拟合相比, EFN2O, TNremoval和EFN2O, TNinfluent与TN去除率指数拟合效果更好, 相关系数(R2)分别为0.965和0.892. 此外, EFN2O, TNremoval与TN去除率的相关系数更接近于1, 能更准确地反映N2O排放因子与TN去除率之间的关系, 可作为优先选择的函数模型进行后续N2O排放的核算与预测. Gruber等[62]将个别亚硝酸盐积累导致N2O排放的WWTPs数据从相关分析中剔除后, N2O的排放因子与脱氮效率之间的负相关性明显增强. 这均证实了指数拟合方法的有效性和准确性. 随着TN去除率从47%增加到94%, 案例WWTP的N2O排放因子逐渐降低, EFN2O, TNremoval从0.004 43 kg·kg-1降到0.000 50 kg·kg-1, 该趋势与Valkova等[27]基于10个WWTPs的20组测量数据得到的结论相似. 因此, N2O排放的进一步减缓策略不仅应侧重于减少生物反应过程N2O的产生, 还可以通过提高WWTPs的TN去除效率来实现.

|
图 5 基于动态模拟的案例WWTP的N2O排放因子分类平均值的指数拟合模型 Fig. 5 Exponential fitting model for the classification average of N2O emission factors in the case WWTP based on dynamic simulation |
本研究通过对AAO工艺的实际WWTP构建数学模型模拟计算得出具有强相关性(R2 = 0.965)的EFN2O, TNremoval分类指数模型, 模型的平均排放因子为0.002 39 kg·kg-1, 以N2O-N/Ninfluent计为0.001 51 kg·kg-1, 是IPCC推荐值的9.4%. 此外, 本案例WWTP的N2O平均排放因子与目前已发表文献中我国实际11座AAO工艺WWTPs的基于TN去除量N2O平均排放因子较为接近(0.002 23 kg·kg-1)[23], 证明了案例WWTP排放因子的合理性. 为使本研究所得出的强指数方程y=0.039 7·e-0.046 5x, R2 = 0.965在WWTPs温室气体核算中能快速获取N2O排放因子, 本文根据TN去除率进行分类, 计算各TN去除范围下EFN2O, TNremoval的平均值(表 4). 例如, 当TN去除率(η)在70%~75%之间时, EFN2O, TNremoval的平均值为0.001 40 kg·kg-1. 案例WWTP运行稳定, 多数时间的TN去除率处于60%~87%, 出水ρ(TN)小于12 mg·L-1, EFN2O, TNremoval为0.000 69~0.002 44 kg·kg-1, 低于已发表AAO工艺WWTPs的平均值, 说明具有较高TN去除率且运行良好的AAO工艺具有较低的N2O排放. 本研究所提供的基于数学模型的动态模拟和分类指数拟合方法可供同类WWTPs参考.
|
|
表 4 不同TN去除率范围下案例WWTP的EFN2O, TNremoval平均值 Table 4 Mean values of EFN2O, TNremoval for the case WWTP with different ranges of TN removal rates |
3 结论
(1)基于126个实证研究的文献统计数据显示, 虽然地域因素对N2O排放因子具有显著性影响, 但全球各地区WWTPs的N2O排放因子普遍低于IPCC推荐值. 我国WWTPs的EFN2O, TNinfluent为0.000 35~0.065 20 kg·kg-1. 不同污水处理工艺的N2O排放因子差异显著, SBR工艺的N2O排放因子可达AAO工艺的4倍以上.
(2)皮尔逊相关性分析表明, 在126个统计数据中仅有EFN2O, TNremoval与WWTPs的TN去除率呈弱负相关. 采用EFN2O, TNremoval更符合生物处理化学计量学, 可以为N2O的精确核算提供方法学建立的依据.
(3)经过长期数字孪生模型校准的案例WWTP存在明显的季节性变化和日变化, 且N2O排放量仅为根据IPCC推荐排放因子计算值的11%. 表明动态模型不仅可准确核算N2O排放, 还可以通过捕捉WWTPs中N2O排放的动态变化来分析高排放的原因, 进而制定合理的减排策略.
(4)与基于散点线性拟合相比, 基于分类平均值的指数拟合方法可以更准确地反映N2O排放因子与TN去除率之间的负相关关系. 其中, EFN2O, TNremoval与TN去除率具有强指数关系(R2 = 0.965)可通过指数方程对N2O的排放量进行预测和核算.
| [1] |
翟明洋, 周长波, 李晟昊, 等. 污水处理行业温室气体核算模型开发及减排潜力分析[J]. 中国环境管理, 2022, 14(6): 57-64. Zhai M Y, Zhou C B, Li S H, et al. Development of greenhouse gas accounting model and emission reduction potential analysis in wastewater treatment industry[J]. Chinese Journal of Environmental Management, 2022, 14(6): 57-64. |
| [2] | Feng J C, Yan J Y, Wang Y, et al. Methane mitigation: learning from the natural marine environment[J]. The Innovation, 2022, 3(5). DOI:10.1016/j.xinn.2022.100297 |
| [3] |
郝晓地, 杨振理, 于文波, 等. 污水处理过程N2O排放: 过程机制与控制策略[J]. 环境科学, 2023, 44(2): 1163-1173. Hao X D, Yang Z L, Yu W B, et al. N2O emission from the processes of wastewater treatment: mechanisms and control strategies[J]. Environmental Science, 2023, 44(2): 1163-1173. |
| [4] | Abulimiti A, Wang X H, Kang J H, et al. The trade-off between N2O emission and energy saving through aeration control based on dynamic simulation of full-scale WWTP[J]. Water Research, 2022, 223. DOI:10.1016/j.watres.2022.118961 |
| [5] | IPCC. 2019 Refinement to the 2006 IPCC guidelines for national greenhouse gas inventories[R]. Switzerland: Intergovernmental Panel on Climate Change, 2019. |
| [6] | de Haas D, Andrews J. Nitrous oxide emissions from wastewater treatment - revisiting the IPCC 2019 refinement guidelines[J]. Environmental Challenges, 2022, 8. DOI:10.1016/j.envc.2022.100557 |
| [7] |
中国城镇供水排水协会. 城镇水务系统碳核算与减排路径技术指南[M]. 北京: 中国建筑工业出版社, 2022. China Urban Water Association. Guidelines for carbon accounting and emission reduction in the urban water sector[M]. Beijing: China Architecture & Building Press, 2022. |
| [8] |
王淑莹, 委燕, 马斌, 等. 控制污水生物处理过程中N2O的释放[J]. 环境科学与技术, 2014, 37(7): 78-84. Wang S Y, Wei Y, Ma B, et al. Control of nitrous oxide emissions in biological wastewater treatment process[J]. Environmental Science & Technology, 2014, 37(7): 78-84. |
| [9] | Sun S C, Bao Z Y, Li R Y, et al. Reduction and prediction of N2O emission from an anoxic/oxic wastewater treatment plant upon DO control and model simulation[J]. Bioresource Technology, 2017, 244: 800-809. DOI:10.1016/j.biortech.2017.08.054 |
| [10] | Czepiel P, Crill P, Harriss R. Nitrous oxide emissions from municipal wastewater treatment[J]. Environmental Science & Technology, 1995, 29(9): 2352-2356. |
| [11] | Sun S C, Cheng X, Li S, et al. N2O emission from full-scale urban wastewater treatment plants: a comparison between A2O and SBR[J]. Water Science and Technology, 2013, 67(9): 1887-1893. DOI:10.2166/wst.2013.066 |
| [12] | Kyung D, Kim M, Chang J, et al. Estimation of greenhouse gas emissions from a hybrid wastewater treatment plant[J]. Journal of Cleaner Production, 2015, 95: 117-123. DOI:10.1016/j.jclepro.2015.02.032 |
| [13] | Vasilaki V, Volcke E I P, Nandi A K, et al. Relating N2O emissions during biological nitrogen removal with operating conditions using multivariate statistical techniques[J]. Water Research, 2018, 140: 387-402. DOI:10.1016/j.watres.2018.04.052 |
| [14] | Harris E, Joss A, Emmenegger L, et al. Isotopic evidence for nitrous oxide production pathways in a partial nitritation-anammox reactor[J]. Water Research, 2015, 83: 258-270. DOI:10.1016/j.watres.2015.06.040 |
| [15] | Li M, Wu H M, Zhang J, et al. Nitrogen removal and nitrous oxide emission in surface flow constructed wetlands for treating sewage treatment plant effluent: effect of C/N ratios[J]. Bioresource Technology, 2017, 240: 157-164. DOI:10.1016/j.biortech.2017.02.054 |
| [16] | Ni B J, Ye L, Law Y, et al. Mathematical modeling of nitrous oxide (N2O) emissions from full-scale wastewater treatment plants[J]. Environmental Science & Technology, 2013, 47(14): 7795-7803. |
| [17] | Peng L, Ni B J, Law Y, et al. Modeling N2O production by ammonia oxidizing bacteria at varying inorganic carbon concentrations by coupling the catabolic and anabolic processes[J]. Chemical Engineering Science, 2016, 144: 386-394. DOI:10.1016/j.ces.2016.01.033 |
| [18] | Ni B J, Yuan Z G. Recent advances in mathematical modeling of nitrous oxides emissions from wastewater treatment processes[J]. Water Research, 2015, 87: 336-346. DOI:10.1016/j.watres.2015.09.049 |
| [19] | Solís B, Guisasola A, Pijuan M, et al. Systematic calibration of N2O emissions from a full-scale WWTP including a tracer test and a global sensitivity approach[J]. Chemical Engineering Journal, 2022, 435. DOI:10.1016/j.cej.2022.134733 |
| [20] | Kumar A, Thanki A, Padhiyar H, et al. Greenhouse gases emission control in WWTS via potential operational strategies: a critical review[J]. Chemosphere, 2021, 273. DOI:10.1016/j.chemosphere.2021.129694 |
| [21] | Yan X, Li L, Liu J X. Characteristics of greenhouse gas emission in three full-scale wastewater treatment processes[J]. Journal of Environmental Sciences, 2014, 26(2): 256-263. DOI:10.1016/S1001-0742(13)60429-5 |
| [22] | Hua H, Jiang S Y, Yuan Z W, et al. Advancing greenhouse gas emission factors for municipal wastewater treatment plants in China[J]. Environmental Pollution, 2022, 295. DOI:10.1016/j.envpol.2021.118648 |
| [23] | Su Q, Dai H C, Xie S Y, et al. Water⁃energy⁃carbon nexus: greenhouse gas emissions from integrated urban drainage systems in China[J]. Environmental Science & Technology, 2023, 57(5): 2093-2104. |
| [24] | Xi J R, Gong H, Zhang Y J, et al. The evaluation of GHG emissions from Shanghai municipal wastewater treatment plants based on IPCC and operational data integrated methods (ODIM)[J]. Science of the Total Environment, 2021, 797. DOI:10.1016/j.scitotenv.2021.148967 |
| [25] | Pocquet M, Wu Z, Queinnec I, et al. A two pathway model for N2O emissions by ammonium oxidizing bacteria supported by the NO/N2O variation[J]. Water Research, 2016, 88: 948-959. DOI:10.1016/j.watres.2015.11.029 |
| [26] | Ruiz L M, Rodelas P, Pérez J I, et al. Sensitivity analyses and simulations of a full-scale experimental membrane bioreactor system using the activated sludge model No. 3 (ASM3)[J]. Journal of Environmental Science and Health, 2015, 50(3): 317-324. DOI:10.1080/10934529.2015.981122 |
| [27] | Valkova T, Parravicini V, Saracevic E, et al. A method to estimate the direct nitrous oxide emissions of municipal wastewater treatment plants based on the degree of nitrogen removal[J]. Journal of Environmental Management, 2021, 279. DOI:10.1016/j.jenvman.2020.111563 |
| [28] |
T/CAEPI 49-2022, 污水处理厂低碳运行评价技术规范[S]. T/CAEPI 49-2022, Technical specification for low-carbon operation evaluation of sewage treatment plant[S]. |
| [29] | Maktabifard M, Zaborowska E, Makinia J. Energy neutrality versus carbon footprint minimization in municipal wastewater treatment plants[J]. Bioresource Technology, 2020, 300. DOI:10.1016/j.biortech.2019.122647 |
| [30] | Ahn J H, Kim S, Park H, et al. N2O emissions from activated sludge processes, 2008⁃2009: results of a national monitoring survey in the United States[J]. Environmental Science & Technology, 2010, 44(12): 4505-4511. |
| [31] | Brannon E Q, Moseman-Valtierra S M, Lancellotti B V, et al. Comparison of N2O emissions and gene abundances between wastewater nitrogen removal systems[J]. Journal of Environmental Quality, 2017, 46(5): 931-938. DOI:10.2134/jeq2017.03.0092 |
| [32] | Townsend-Small A, Pataki D E, Tseng L Y, et al. Nitrous oxide emissions from wastewater treatment and water reclamation plants in southern California[J]. Journal of Environmental Quality, 2011, 40(5): 1542-1550. DOI:10.2134/jeq2011.0059 |
| [33] | Mander Ü, Maddison M, Soosaar K, et al. The impact of a pulsing water table on wastewater purification and greenhouse gas emission in a horizontal subsurface flow constructed wetland[J]. Ecological Engineering, 2015, 80: 69-78. DOI:10.1016/j.ecoleng.2014.09.075 |
| [34] | S⊘vik A K, Augustin J, Heikkinen K, et al. Emission of the greenhouse gases nitrous oxide and methane from constructed wetlands in Europe[J]. Journal of Environmental Quality, 2006, 35(6): 2360-2373. DOI:10.2134/jeq2006.0038 |
| [35] | Foley J, de Haas D, Yuan Z G, et al. Nitrous oxide generation in full-scale biological nutrient removal wastewater treatment plants[J]. Water Research, 2010, 44(3): 831-844. DOI:10.1016/j.watres.2009.10.033 |
| [36] | Pan Y T, van den Akker B, Ye L, et al. Unravelling the spatial variation of nitrous oxide emissions from a step-feed plug-flow full scale wastewater treatment plant[J]. Scientific Reports, 2016, 6(1). DOI:10.1038/srep20792 |
| [37] | Spérandio M, Pocquet M, Guo L S, et al. Evaluation of different nitrous oxide production models with four continuous long-term wastewater treatment process data series[J]. Bioprocess and Biosystems Engineering, 2016, 39(3): 493-510. DOI:10.1007/s00449-015-1532-2 |
| [38] | Ye L, Ni B J, Law Y, et al. A novel methodology to quantify nitrous oxide emissions from full-scale wastewater treatment systems with surface aerators[J]. Water Research, 2014, 48: 257-268. DOI:10.1016/j.watres.2013.09.037 |
| [39] | Brotto A C, Kligerman D C, Andrade S A, et al. Factors controlling nitrous oxide emissions from a full-scale activated sludge system in the tropics[J]. Environmental Science and Pollution Research, 2015, 22(15): 11840-11849. DOI:10.1007/s11356-015-4467-x |
| [40] | de Mello W Z, Ribeiro R P, Brotto A C, et al. Nitrous oxide emissions from an intermittent aeration activated sludge system of an urban wastewater treatment plant[J]. Química Nova, 2013, 36(1): 16-20. DOI:10.1590/S0100-40422013000100004 |
| [41] | Chen X M, Mielczarek A T, Habicht K, et al. Assessment of full-scale N2O emission characteristics and testing of control concepts in an activated sludge wastewater treatment plant with alternating aerobic and anoxic phases[J]. Environmental Science & Technology, 2019, 53(21): 12485-12494. |
| [42] | Yoshida H, Mønster J, Scheutz C. Plant-integrated measurement of greenhouse gas emissions from a municipal wastewater treatment plant[J]. Water Research, 2014, 61: 108-118. DOI:10.1016/j.watres.2014.05.014 |
| [43] | MUDP. MUDP Lattergaspulje-Dataopsamling på måling og reduktion af lattergasemissioner fra renseanlæg [R]. Copenhagen: Danish Environmental Protection Agency, 2020. |
| [44] | Tumendelger A, Alshboul Z, Lorke A. Methane and nitrous oxide emission from different treatment units of municipal wastewater treatment plants in Southwest Germany[J]. PLoS One, 2019, 14(1). DOI:10.1371/journal.pone.0209763 |
| [45] | Bollon J, Filali A, Fayolle Y, et al. N2O emissions from full-scale nitrifying biofilters[J]. Water Research, 2016, 102: 41-51. DOI:10.1016/j.watres.2016.05.091 |
| [46] | Filali A, Bollon J, Molle P, et al. High-frequency measurement of N2O emissions from a full-scale vertical subsurface flow constructed wetland[J]. Ecological Engineering, 2017, 108: 240-248. DOI:10.1016/j.ecoleng.2017.08.037 |
| [47] | Mikola A, Heinonen M, Kosonen H, et al. N2O emissions from secondary clarifiers and their contribution to the total emissions of the WWTP[J]. Water Science and Technology, 2014, 70(4): 720-728. DOI:10.2166/wst.2014.281 |
| [48] | Kosonen H, Heinonen M, Mikola A, et al. Nitrous oxide production at a fully covered wastewater treatment plant: results of a long-term online monitoring campaign[J]. Environmental Science & Technology, 2016, 50(11): 5547-5554. |
| [49] | Bae W B, Park Y, Chandran K, et al. Temporal triggers of N2O emissions during cyclical and seasonal variations of a full-scale sequencing batch reactor treating municipal wastewater[J]. Science of the Total Environment, 2021, 797. DOI:10.1016/j.scitotenv.2021.149093 |
| [50] | Hwang K L, Bang C H, Zoh K D. Characteristics of methane and nitrous oxide emissions from the wastewater treatment plant[J]. Bioresource Technology, 2016, 214: 881-884. DOI:10.1016/j.biortech.2016.05.047 |
| [51] | Lim Y, Kim D J. Quantification method of N2O emission from full-scale biological nutrient removal wastewater treatment plant by laboratory batch reactor analysis[J]. Bioresource Technology, 2014, 165: 111-115. DOI:10.1016/j.biortech.2014.03.021 |
| [52] | Daelman M R J, van Voorthuizen E M, van Dongen U G J M, et al. Seasonal and diurnal variability of N2O emissions from a full-scale municipal wastewater treatment plant[J]. Science of the Total Environment, 2015, 536: 1-11. DOI:10.1016/j.scitotenv.2015.06.122 |
| [53] | van Dijk E J H, van Loosdrecht M C M, Pronk M. Nitrous oxide emission from full-scale municipal aerobic granular sludge[J]. Water Research, 2021, 198. DOI:10.1016/j.watres.2021.117159 |
| [54] | Vieira A, Marques R, Galinha C, et al. Nitrous oxide emissions from a full-scale biological aerated filter (BAF) subject to seawater infiltration[J]. Environmental Science and Pollution Research, 2019, 26(20): 20939-20948. DOI:10.1007/s11356-019-05470-x |
| [55] | Liu C X, Xu K Q, Inamori R, et al. Pilot-scale studies of domestic wastewater treatment by typical constructed wetlands and their greenhouse gas emissions[J]. Frontiers of Environmental Science & Engineering in China, 2009, 3(4): 477-482. |
| [56] | Masuda S H, Sano I, Hojo T, et al. The comparison of greenhouse gas emissions in sewage treatment plants with different treatment processes[J]. Chemosphere, 2018, 193: 581-590. DOI:10.1016/j.chemosphere.2017.11.018 |
| [57] | Qi W K, Song Y, Peng Y Z, et al. Greenhouse gas emissions from a sewage contact oxidation emergency treatment plant after destruction by an earthquake and tsunami[J]. Science of the Total Environment, 2019, 687: 634-641. DOI:10.1016/j.scitotenv.2019.06.012 |
| [58] | Christensson M, Ekström S, Chan A A, et al. Experience from start-ups of the first ANITA Mox plants[J]. Water Science and Technology, 2013, 67(12): 2677-2684. DOI:10.2166/wst.2013.156 |
| [59] | Delre A, Mønster J, Scheutz C. Greenhouse gas emission quantification from wastewater treatment plants, using a tracer gas dispersion method[J]. Science of the Total Environment, 2017, 605-606: 258-268. DOI:10.1016/j.scitotenv.2017.06.177 |
| [60] | Johansson A E, Klemedtsson Å K, Klemedtsson L, et al. Nitrous oxide exchanges with the atmosphere of a constructed wetland treating wastewater: parameters and implications for emission factors[J]. Tellus B: Chemical and Physical Meteorology, 2011, 55(3): 737-750. |
| [61] | Gruber W, Villez K, Kipf M, et al. N2O emission in full-scale wastewater treatment: proposing a refined monitoring strategy[J]. Science of the Total Environment, 2020, 699. DOI:10.1016/j.scitotenv.2019.134157 |
| [62] | Gruber W, von Känel L, Vogt L, et al. Estimation of countrywide N2O emissions from wastewater treatment in Switzerland using long-term monitoring data[J]. Water Research X, 2021, 13. DOI:10.1016/j.wroa.2021.100122 |
| [63] | Ribera-Guardia A, Bosch L, Corominas L, et al. Nitrous oxide and methane emissions from a plug-flow full-scale bioreactor and assessment of its carbon footprint[J]. Journal of Cleaner Production, 2019, 212: 162-172. DOI:10.1016/j.jclepro.2018.11.286 |
| [64] | Rodríguez-Caballero A, Aymerich I, Poch M, et al. Evaluation of process conditions triggering emissions of green-house gases from a biological wastewater treatment system[J]. Science of the Total Environment, 2014, 493: 384-391. DOI:10.1016/j.scitotenv.2014.06.015 |
| [65] | Rodríguez-Caballero A, Aymerich I, Marques R, et al. Minimizing N2O emissions and carbon footprint on a full-scale activated sludge sequencing batch reactor[J]. Water Research, 2015, 71: 1-10. DOI:10.1016/j.watres.2014.12.032 |
| [66] | Spinelli M, Eusebi A L, Vasilaki V, et al. Critical analyses of nitrous oxide emissions in a full scale activated sludge system treating low carbon-to-nitrogen ratio wastewater[J]. Journal of Cleaner Production, 2018, 190: 517-524. DOI:10.1016/j.jclepro.2018.04.178 |
| [67] | Aboobakar A, Cartmell E, Stephenson T, et al. Nitrous oxide emissions and dissolved oxygen profiling in a full-scale nitrifying activated sludge treatment plant[J]. Water Research, 2013, 47(2): 524-534. DOI:10.1016/j.watres.2012.10.004 |
| [68] | Bao Z Y, Sun S C, Sun D Z. Assessment of greenhouse gas emission from A/O and SBR wastewater treatment plants in Beijing, China[J]. International Biodeterioration & Biodegradation, 2016, 108: 108-114. |
| [69] | Li H J, Peng D C, Liu W B, et al. N2O generation and emission from two biological nitrogen removal plants in China[J]. Desalination and Water Treatment, 2016, 57(25): 11800-11806. DOI:10.1080/19443994.2015.1046145 |
| [70] |
李惠娟, 彭党聪, 刘文博, 等. 不同污水处理工艺非二氧化碳温室气体的释放[J]. 环境科学, 2017, 38(4): 1640-1646. Li H J, Peng D C, Liu W B, et al. Non-CO2 greenhouse gas release from different biological wastewater treatment processes[J]. Environmental Science, 2017, 38(4): 1640-1646. |
| [71] | Ren Y G, Wang J H, Li H F, et al. Nitrous oxide and methane emissions from different treatment processes in full-scale municipal wastewater treatment plants[J]. Environmental Technology, 2013, 34(21): 2917-2927. DOI:10.1080/09593330.2012.696717 |
| [72] | Sun S C, Cheng X, Sun D Z. Emission of N2O from a full-scale sequencing batch reactor wastewater treatment plant: characteristics and influencing factors[J]. International Biodeterioration & Biodegradation, 2013, 85: 545-549. |
| [73] | Sun S C, Bao Z Y, Sun D Z. Study on emission characteristics and reduction strategy of nitrous oxide during wastewater treatment by different processes[J]. Environmental Science and Pollution Research, 2015, 22(6): 4222-4229. DOI:10.1007/s11356-014-3654-5 |
| [74] |
王金鹤, 张建. 城镇污水处理厂SBR工艺中N2O的释放通量研究[J]. 山东建筑大学学报, 2012, 27(1): 43-46, 54. Wang J H, Zhang J. Nitrous oxide emissions from SBR wastewater treatment systems[J]. Journal of Shandong Jianzhu University, 2012, 27(1): 43-46, 54. |
| [75] | Wang Y Y, Fang H Y, Zhou D, et al. Characterization of nitrous oxide and nitric oxide emissions from a full-scale biological aerated filter for secondary nitrification[J]. Chemical Engineering Journal, 2016, 299: 304-313. DOI:10.1016/j.cej.2016.04.050 |
| [76] | Wang Y Y, Lin X M, Zhou D, et al. Nitric oxide and nitrous oxide emissions from a full-scale activated sludge anaerobic/anoxic/oxic process[J]. Chemical Engineering Journal, 2016, 289: 330-340. DOI:10.1016/j.cej.2015.12.074 |
| [77] |
王金鹤. 城镇污水处理厂中温室气体的释放研究[D]. 济南: 山东大学, 2011. Wang J H. Research on the greenhouse gas emissions from full-scale municipal wastewater treatment plants[D]. Jinan: Shandong University, 2011. |
| [78] |
孙世昌. 城市污水处理典型工艺N2O的释放特征及减排策略研究[D]. 北京: 北京林业大学, 2014. Sun S C. Study on characteristics and reduction s trategies of N2O emission from typical urban wastewater treatment processes[D]. Beijing: Beijing Forestry University, 2014. |
| [79] | Vasilaki V, Massara T M, Stanchev P, et al. A decade of nitrous oxide (N2O) monitoring in full-scale wastewater treatment processes: a critical review[J]. Water Research, 2019, 161: 392-412. DOI:10.1016/j.watres.2019.04.022 |
| [80] | Pijuan M, Torà J, Rodríguez-Caballero A, et al. Effect of process parameters and operational mode on nitrous oxide emissions from a nitritation reactor treating reject wastewater[J]. Water Research, 2014, 49: 23-33. DOI:10.1016/j.watres.2013.11.009 |
| [81] | Mannina G, Rebouças T F, Cosenza A, et al. A plant-wide wastewater treatment plant model for carbon and energy footprint: model application and scenario analysis[J]. Journal of Cleaner Production, 2019, 217: 244-256. DOI:10.1016/j.jclepro.2019.01.255 |
| [82] | Duan H R, van den Akker B, Thwaites B J, et al. Mitigating nitrous oxide emissions at a full-scale wastewater treatment plant[J]. Water Research, 2020, 185. DOI:10.1016/j.watres.2020.116196 |