 2024, Vol. 45


2. 中国科学院西北生态环境资源研究院, 兰州 730000;
3. 贵州医科大学环境污染与疾病监控教育部重点实验室, 贵阳 550025
2. Northwest Institute of Eco-Environment and Resources, Chinese Academy of Sciences, Lanzhou 730000, China;
3. Key Laboratory of Environmental Pollution Monitoring and Disease Control, Ministry of Education, Guizhou Medical University, Guiyang 550025, China
空气污染是当前全球疾病和死亡的第四大风险因素, 尤其是PM2.5[1]. 暴露于PM2.5环境中会增加缺血性心脏病、中风、慢性阻塞性肺病、下呼吸道感染和肺癌等特定疾病的死亡风险[2 ~ 4], 即使在低暴露水平下也会对健康造成有害影响[5]. 基于最新科学研究证据, 世界卫生组织(WHO)更新了《全球空气质量指南(2021)》[6], 进一步将PM2.5年均指导值由10 μg·m-3收紧为5 μg·m-3. 高浓度的PM2.5对我国人群健康造成的负担更为严重. 根据全球疾病负担(global burden of disease, GBD)研究, 2019年PM2.5污染导致全球约414万人过早死亡, 其中超过1/4来自中国, 明显高于其他国家[7]. 为应对日益严峻的公共健康风险, 自2013年以来, 我国相继出台了《大气污染防治行动计划》(2013~2017年)和《打赢蓝天保卫战三年行动计划》(2018~2020年), 旨在减少大气PM2.5浓度. 随着清洁空气政策的实施, 我国空气质量得到了明显改善[8 ~ 10]. 然而, 仍有80%和99%的人口分别暴露在PM2.5年均浓度超过我国环境空气质量二级标准(35 μg·m-3)和WHO 2005年空气质量指南(10 μg·m-3)的环境中[11].
近年来, 国内不少学者估计了PM2.5浓度变化对健康负担的影响, 主要集中在全国层面[2, 8, 9, 12 ~ 14]以及京津冀[15 ~ 17]、长三角[18]和珠三角[19, 20]等一些发达地区. 由于污染排放和人口密度等方面存在较大差异, 不同地区的空气污染特征及归因死亡情况可能会显著不同[2, 21]. 例如, Xiao等[10]对我国PM2.5相关死亡负担进行评估发现, 2013~2020年我国PM2.5归因死亡从175万人下降至139万人;魏彤等[18]研究发现, 2013~2019年长三角地区PM2.5归因死亡人数整体呈下降趋势;而蔡清楠等[19]研究发现, 珠三角地区PM2.5相关过早死亡人数在2013~2018年期间不断增加. 因此, 有必要具体评估不同地区PM2.5对健康的影响, 而目前我国西北地区的相关研究较为缺乏. 此外, 虽然有研究采用不同的暴露-响应函数考虑了特定疾病的PM2.5归因死亡, 但大多数研究没有区分其他相关因素对PM2.5归因死亡变化的作用. 除了PM2.5暴露浓度, PM2.5归因死亡还受到人口总量、基线死亡率和年龄结构等多种因素的影响[22]. 通过分析各种驱动因素的相对贡献, 可以有效阐明PM2.5归因死亡变化的主要原因[23].
甘肃省位于中国西北部, 地处黄土高原、青藏高原、内蒙古高原交汇地带, 沙尘暴发生频繁[24], 加之重工业和经济的快速发展, 因此经常受到人为和自然来源颗粒物污染的影响. 为加强大气污染防治, 甘肃省提出了《甘肃省大气污染防治行动计划实施意见》《甘肃省打赢蓝天保卫战三年行动作战方案》等清洁空气政策, 但该地区PM2.5污染及其健康影响的时空变化特征尚不清楚. 为评价区域清洁空气行动带来的健康效益, 本研究利用优化的全球暴露死亡模型系统评估了甘肃省2013~2020年PM2.5污染水平时空变化及相关的健康效应, 同时分析了人口总量、基线死亡率、老龄化程度和PM2.5浓度对健康负担的相对贡献, 旨在更好地为制定区域精细化空气污染控制政策提供依据.
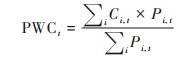
1 材料与方法 1.1 PM2.5浓度数据甘肃省2013~2020年的PM2.5年均浓度数据来自中国大气成分近实时追踪数据集(TAP, http://tapdata.org.cn/), 其空间分辨率为1 km× 1 km. TAP数据集融合了地面观测、模式模拟和卫星遥感等多源数据, 既保证了时空覆盖的完整性, 又具备了高分辨率和高精度的特点, 详细的PM2.5预测模型见文献[25]. 该数据集已在多项研究中得到应用[10, 26, 27]. 为了更准确地比较甘肃省不同年份的人群暴露水平, 还计算了每年的PM2.5人口加权平均浓度, 公式如下:
|
(1) |
式中, PWCt表示第t年的PM2.5人口加权平均浓度, Ci, t和Pi, t分别表示第i个网格单元、第t年的PM2.5浓度和暴露人口数.
1.2 人口和基线死亡率数据2013~2020年的人口分布数据来自LandScan全球人口数据集(https://landscan.ornl.gov/), 其空间分辨率为30弧秒(约1 km× 1 km). 为了提高数据的准确性, 根据《甘肃发展年鉴2021》[28]中的各城市人口统计数据, 对每年的LandScan人口分布进行了调整. 2013~2020年的年龄结构数据及各年龄组的疾病基线死亡率数据(见1.3节的年龄分组)来自中国死因监测数据集[29], 选择其中的西部地区数据应用于甘肃省.
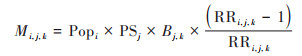
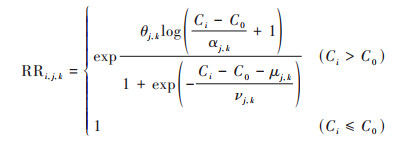
1.3 健康负担评估本研究采用最新优化的全球暴露死亡模型(global exposure mortality model, GEMM)[4]评估长期暴露于PM2.5导致的健康负担. GEMM模型考虑了5种特定疾病的过早死亡:缺血性心脏病(ischemic heart disease, IHD)、中风(stroke)、慢性阻塞性肺病(chronic obstructive pulmonary disease, COPD)、肺癌(lung cancer, LC)和下呼吸道感染(lower respiratory infection, LRI). 计算公式为:
|
(2) |
|
(3) |
式中, i、j和k分别表示网格单元、年龄组(25~29、30~34、35~39、40~44、45~49、50~54、55~59、60~64、65~69、70~74、75~79和≥80岁)和5种特定疾病. Mi, j, k表示PM2.5暴露导致的第i个网格单元, 第j个年龄组中, 某种疾病k的过早死亡人数;Popi表示第i个网格单元的暴露人口数;PSj表示第j年龄组占暴露人口数的比例;Bj, k表示第j年龄组中, 疾病k的基线死亡率;RRi, j, k表示相对危险度;Ci为第i个网格单元的PM2.5浓度值(μg·m-3);C0表示理论最低风险浓度(2.4 μg·m-3)[1, 14];θ、α、μ和ν为PM2.5暴露-响应函数的拟合参数, 分疾病和年龄组的参数取值详见Burnett等[4]的研究.
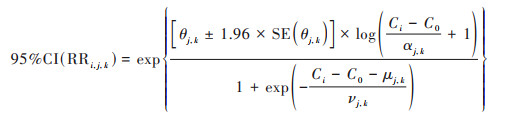
考虑到模型中相对危险度RRi, j, k的不确定性, 在GEMM模型中使用标准误差计算RRi, j, k的95%置信区间, 即:
|
(4) |
式中, SE(θj, k)表示θj, k的标准偏差, 其值见Burnett等[4]的研究.
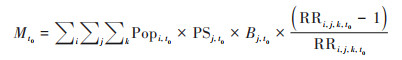
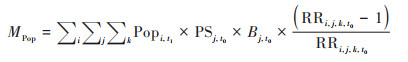
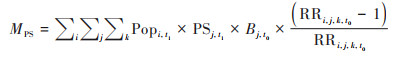
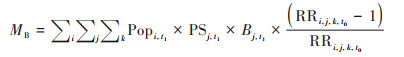
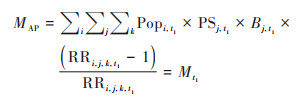
1.4 驱动因素分解本研究进一步采用全球疾病负担(GBD)研究[3]使用的分解方法, 量化了人口规模、年龄结构、基线死亡率和PM2.5浓度等4个驱动因素对PM2.5归因死亡变化的影响. 分解方法通过将每个因素依次输入公式(2)来估计归因死亡的变化, 每个连续步骤之间的归因死亡差值即为各驱动因素变化的贡献值. 考虑到输入顺序对估计结果的影响, 本研究计算了24种可能的输入顺序, 并将4个驱动因素贡献的平均值作为最终结果. 以人口规模、年龄结构、基线死亡率和PM2.5浓度输入顺序为例, 计算如下:
|
(5) |
|
(6) |
|
(7) |
|
(8) |
|
(9) |
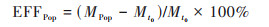
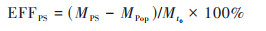
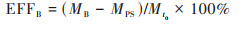
式中, t0和t1分别表示起始年(2013年)和结束年(2020年). Mt0和Mt1分别表示起始年和结束年PM2.5暴露导致的死亡人数. MPop、MPS、MB和MAP分别表示人口规模、年龄结构、基线死亡率和PM2.5浓度变化引起的死亡人数, 其对PM2.5归因死亡变化的贡献值为:
|
(10) |
|
(11) |
|
(12) |
|
(13) |
式中, EFFPop、EFFPS、EFFB和EFFAP分别表示人口规模变化、年龄结构变化、基线死亡率变化和PM2.5浓度变化对PM2.5归因死亡变化的贡献值.
2 结果与讨论 2.1 PM2.5浓度和暴露人口 2.1.1 PM2.5浓度图 1显示了2013~2020年甘肃省PM2.5年均浓度的时空分布变化. 2013~2020年, PM2.5高浓度区域主要集中在中东部的兰州、庆阳、白银地区, 以及西北部河西地区, 而南部的甘南和陇南地区浓度较低. 其中, 中东部地区来自工业、交通等人为排放的大气污染物较多[30];河西地区位于我国西部沙尘通道, 与腾格里沙漠、巴丹吉林沙漠和库姆塔格沙漠接壤, 受到沙尘源的影响较大[24, 31];而甘南和陇南地区的经济发展主要以生态旅游、农产品加工等绿色产业为主, 大气污染物排放总量较低[30].

|
图 1 2013~2020年甘肃省PM2.5浓度空间分布变化 Fig. 1 Spatial distribution of PM2.5 concentration in Gansu Province from 2013 to 2020 |
2013~2020年, 研究区域内的PM2.5人口加权平均浓度分别为40.87、38.60、41.14、39.28、36.04、33.91、28.06和26.74 μg·m-3, 整体呈下降趋势, 下降幅度达34.57%. 其中, 2013~2017年和2017~2020年的下降幅度分别为11.76%和25.83%, 低于同期全国平均水平[10]. 由于人为污染物排放量大幅减少, 兰州、平凉、庆阳、定西、天水和陇南的PM2.5浓度下降幅度较大, 而甘南和河西部分地区的下降幅度较小. 2014~2015年, PM2.5人口加权平均浓度有所上升, 主要受到沙尘天气的影响. 据统计, 2015年研究区发生沙尘天气的次数较2014年增加了11次[32], 导致河西地区浓度明显上升. 尽管甘肃省的PM2.5污染普遍有所改善, 但绝大多数地区仍超过了15 μg·m-3.
2.1.2 暴露人口利用网格化PM2.5浓度与人口数据, 统计了不同PM2.5浓度下的人口累计分布(图 2). 总的来说, 2013~2020年, 生活在PM2.5年均浓度超过国家环境空气质量二级浓度限值(35 μg·m-3)地区的人口比例显著下降. 具体地, 2013年, 甘肃省有72.89%的人口居住在PM2.5年均浓度高于35 μg·m-3的地区;2017年和2020年, 这一比例分别下降至49.95%和11.61%. 这表明甘肃省采取的清洁空气政策取得了显著的成效, 使得PM2.5高暴露人口大幅减少. 尽管甘肃省暴露于35 μg·m-3以上地区的人口比例下降幅度明显高于全国[23]及中东部地区[22], 但直到2020年, 仅有1.60%的人口生活在PM2.5年均浓度低于国家一级浓度限值(15 μg·m-3)的地区.

|
图 2 2013、2017和2020年甘肃省不同PM2.5污染水平的人口累计分布 Fig. 2 Cumulative distribution of population exposed to different PM2.5 pollution levels in Gansu Province in 2013, 2017, and 2020 |
利用GEMM模型估算了2013~2020年甘肃省归因于PM2.5污染的健康负担, 如图 3所示. 甘肃省PM2.5归因死亡人数从2013年的12 826(95%CI:7 840~17 408)人下降至2017年的12 482(95%CI:7 933~16 704)人, 再降至2020年的9 814(95%CI:6 407~13 036)人. 由此可知, 随着PM2.5浓度的降低, 2017~2020年可避免的PM2.5归因死亡人数(下降2 668人, 21.37%)显著大于2013~2017年(下降344人, 2.69%). Xiao等[10]研究指出, 由于PM2.5暴露-响应曲线呈非线性, 在低污染水平下减少污染暴露会带来更大的健康效益. 这意味着如果继续实施严格的污染控制措施, 可以实现更显著的健康效益[23].

|
图 3 2013~2020年甘肃省PM2.5归因死亡人数 Fig. 3 PM2.5-attributed deaths in Gansu Province from 2013 to 2020 |
从特定疾病的PM2.5归因死亡来看, 2013年, stroke和COPD归因死亡人数最多, 分别占29.78%和28.23%;其次是IHD, 占23.88%;LRI的占比最低, 为7.02%(图 4). 与2013年相比, 2020年IHD归因死亡人数从3 063(95%CI:2 800~3 321)人增加至3 434(95%CI:3 130~3 733)人, 其占比上升至34.99%, 成最主要的死因;stroke、COPD、LC和LRI归因死亡人数呈下降趋势, 其中stroke和COPD归因死亡占比分别下降至25.36%和19.57%. 平均而言, IHD和stroke是PM2.5归因死亡的主要原因. 这与全国及其他地区的研究结果相似[19, 33, 34], 主要由于我国IHD和stroke(心脑血管疾病)发病率和死亡率普遍偏高, 导致其归因死亡人数高于其他3种疾病(呼吸系统疾病). 然而, 不同的是, 甘肃省的COPD归因死亡比例高于其他地区, 可能与西部地区COPD基线死亡率更高有关[29]. 此外, IHD归因死亡上升的趋势表明, 随着不健康生活方式和人口老龄化加剧, IHD的死亡负担在未来可能会进一步增加[35]. 因此, 为减少IHD归因死亡, 需要降低PM2.5污染暴露水平, 同时改善医疗条件和转变生活方式, 以降低IHD的基线死亡率.

|
图 4 2013和2020年甘肃省不同疾病PM2.5归因死亡贡献 Fig. 4 Contribution of PM2.5-attributed deaths from different diseases in Gansu Province in 2013 and 2020 |
分年龄别的PM2.5归因死亡负担如图 5所示. 随着年龄的增长, PM2.5归因死亡人数显著增加. 2013年和2020年, 甘肃省60岁及以上人群的归因死亡人数分别为10 436(95%CI:6 272~14 273)人和8 172(95%CI:5 267~10 924)人, 占总死亡人数的81.37%和83.27%, 其中80岁及以上人群归因死亡分别占到32.00%和35.97%;相比之下, 25~44岁人群的归因死亡占比仅为4.52%和3.09%, 45~59岁人群的归因死亡占比为14.11%和13.64%. 针对各年龄组不同疾病归因死亡, 呼吸系统疾病表现出比心血管疾病更大的年龄差异, 尤其是COPD归因死亡, 其占比随年龄增长而大幅上升, 在80岁及以上人群中成最主要的死亡负担. 总的来说, 尽管老年人群(≥60岁)在总人口中的占比相对较小[29], 但其归因死亡占绝大部分, 并且呈逐渐上升趋势, 说明老年人群更容易受到空气污染的影响, 老年人较高的基线死亡率是死亡负担较高的主要原因[33, 36]. 为了减轻健康负担, 除保护老年人免受空气污染的影响外, 提高老年人健康状况也很重要, 特别是中西部经济欠发达地区[37].

|
图 5 2013和2020年甘肃省分年龄别的PM2.5归因死亡人数及比例 Fig. 5 Number and proportion of PM2.5-attributed deaths by age group in Gansu Province in 2013 and 2020 |
图 6显示了2013~2020年甘肃省PM2.5归因死亡的空间分布. 可以看出, PM2.5归因死亡存在显著的空间差异. 虽然河西地区PM2.5浓度相对较高, 但由于该地区多为荒漠戈壁地带, 人口稀少, 大部分区域的归因死亡人数几乎为0[图 6(a)];而PM2.5浓度较高且人口密度较大的中部和东部地区的归因死亡人数较多, 尤其是兰州的归因死亡最高可达500人·(100 km2)-1;南部地区甘南的PM2.5浓度和人口密度均较低, 因而归因死亡人数也很低. 此外, 归因死亡高值区主要与各城市人口密集的中心城区相对应. 2013~2020年, 大部分地区的PM2.5归因死亡均有所减少, 尤其是PM2.5下降幅度较大的天水、陇南和平凉, 归因死亡人数下降较多[图 6(b)]. 值得注意的是, 兰州和临夏部分地区以及河西等一些局部零星地区的归因死亡人数呈上升趋势, 这可能一方面与其城市人口显著增加有关[28];另一方面也与PM2.5浓度变化幅度有关.

|
图 6 2013~2020年甘肃省PM2.5归因死亡空间分布 Fig. 6 Spatial distribution of PM2.5-attributed deaths in Gansu Province from 2013 to 2020 |
在市州层面(图 7), 兰州的PM2.5归因死亡人数显著高于其他城市, 平均每年达到2 334人, 占甘肃省PM2.5归因死亡的19.29%[图 7(a)];天水、定西和庆阳的归因死亡人数次之, 平均每年为1 132~1 469人, 合计占甘肃省归因死亡的31.45%;由于嘉峪关、金昌和甘南的人口密度远低于其他地区, 因此归因死亡人数最少, 合计仅占甘肃省归因死亡的4.69%;河西地区的酒泉和张掖的归因死亡也较低, 均在500人以下. 此外, 2013~2020年, 嘉峪关的PM2.5归因死亡人数有所上升, 而其余城市都有不同程度的下降[图 7(b)]. 具体而言, 天水的归因死亡人数在2013~2020年下降最多(553人), 其次为陇南、定西和平凉;2017~2020年各城市减少的归因死亡人数均明显高于2013~2017年, 其中兰州、临夏、甘南和酒泉的归因死亡人数在2013~2017年有所上升, 2017~2020年则下降, 尤其是兰州在2017~2020年的归因死亡下降人数仅次于天水和陇南. 由于PM2.5归因死亡与人口分布存在极显著的正相关关系[38], 因此在人口稠密的城市加大控制PM2.5污染的力度, 有利于减轻健康负担. 例如, 作为甘肃省人口密度最大的兰州市, 尽管其人口在2013~2020年明显增加, 但PM2.5浓度的大幅下降仍可以促使归因死亡人数降低.

|
图 7 2013~2020年甘肃省各城市PM2.5归因死亡人数及变化 Fig. 7 Number and change of PM2.5-attributed deaths in cities of Gansu Province from 2013 to 2020 |
根据1.4节的分解方法, 比较了4个驱动因素对PM2.5归因死亡变化的贡献程度, 如图 8所示. 2013~2020年, PM2.5浓度下降是甘肃省归因死亡人数减少的主要因素, 减少了28.55%. 基线死亡率的降低也对归因死亡人数的减少起到部分作用, 减少了9.84%, 但不足以抵消人口老龄化带来的负面影响. 甘肃省人口总量从2013年的2 537.13万人下降至2020年的2 501.02万人, 对归因死亡人数减少的贡献很小(1.26%). 与PM2.5浓度、基线死亡率和人口规模不同, 年龄结构是引起归因死亡人数增加的因素. 2013~2020年, 甘肃省60岁及以上人群占人口总量的比例从14.51%上升至18.00%[29], 导致归因死亡人数增加了16.16%, 这与之前的研究结果基本一致[9, 39]. 总的来说, PM2.5浓度下降和人口老龄化是造成归因死亡人数变化的两个最主要原因. 在人口老龄化不可避免的情况下, 改善空气质量仍是减轻健康负担的最主要途径[40]. 《世界人口展望2022》[41]数据显示, 我国人口老龄化程度将进一步加重, 到2030年, 60岁及以上人口占比将达到26.19%(80岁以上人口占3.50%), 到2060年将达到41.91%(80岁以上人口占12.62%). 因此, 未来人口老龄化将对PM2.5相关健康负担带来严峻挑战, 需要采取更严格的清洁空气政策来大幅降低污染物浓度, 以更大程度地抵消人口老龄化带来的影响.

|
图 8 2013~2020年甘肃省PM2.5归因死亡人数变化的驱动因素 Fig. 8 Driving factors of PM2.5-attributed deaths in Gansu Province from 2013 to 2020 |
各驱动因素对特定疾病归因死亡的贡献略有不同. 2013~2020年, PM2.5浓度下降虽然可明显减轻IHD健康负担, 但无法抵消基线死亡率增加和人口老龄化带来的负面影响, 从而导致IHD归因死亡人数增加. 对于stroke和LC, PM2.5浓度下降的作用大于人口老龄化带来的负面影响, 因而归因死亡人数有所减少. 然而, 对于COPD和LRI, 基线死亡率下降的贡献明显大于PM2.5浓度下降的贡献, 两者共同促使归因死亡人数大幅下降.
2.4 不确定性分析本研究对PM2.5污染相关过早死亡的估计存在一些不确定性和局限性. 由于目前的流行病学证据有限, PM2.5与健康结果之间的暴露-响应函数是导致不确定性的主要来源[33]. 以往的研究主要使用综合暴露-响应(integrated exposure-response, IER)模型估计PM2.5造成的过早死亡, 但该模型仅纳入欧美地区的队列研究信息, 可能低估了PM2.5浓度较高地区的健康负担. 相比之下, GEMM模型考虑了较高水平的空气污染, 并加入了中国队列研究信息, 估计的全球归因死亡负担比IER模型高120%[4]. Wu等[33]和Tang等[36]的研究也发现, 使用GEMM模型估计的PM2.5归因死亡人数高于IER模型. 因此, 使用基于中国特定队列研究的暴露-响应模型可能更适合, 但其准确性还需进一步科学论证[42, 43]. 其次, 暴露-响应函数假设PM2.5的毒性仅受浓度大小的影响, 忽略了PM2.5来源和化学成分的影响. 然而, 由于PM2.5是较为复杂的大气颗粒物, 其健康影响会因来源和成分而有所不同[8, 33, 42], 目前缺乏PM2.5特定来源的相对风险函数[44]. 再次, 本研究没有考虑25岁以下人群和由PM2.5暴露引起的其他疾病死亡[42, 45], 可能低估了PM2.5对健康的影响. 然而, 先前的研究表明[46], 由于25岁以下人群5种特定疾病的基线死亡率很小, 其归因死亡可能不会对评估结果产生实质性影响. Maji等[42]利用GEMM的非意外死亡(包含非传染性疾病和LRI)模型发现, 2019年我国PM2.5造成的死亡负担中, 约20%由5种主要疾病以外的死因引起. 此外, 由于基础数据缺乏, 本研究使用西部地区的基线死亡率和年龄结构数据代表整个研究区, 这可能会导致估计结果存在一些差异.
3 结论(1) 2013~2020年, 甘肃省的人口加权PM2.5年均浓度下降了34.57%, 从40.87 μg·m-3降至26.74 μg·m-3. 暴露于PM2.5年均浓度超过国家二级标准限值的人口比例从2013年的72.89%显著下降至2020年的11.61%, 但仍有98.40%的人口居住在PM2.5年均浓度超过国家一级标准限值的地区.
(2) 2013~2020年, 甘肃省因PM2.5导致的死亡人数下降了3 012人, 降幅为23.48%, 主要发生在2017~2020年. 2013年, stroke和COPD是PM2.5归因死亡的主要原因, 而2020年则以IHD和stroke为主. 60岁及以上老年人群的PM2.5归因死亡远高于60岁以下人群. 与河西地区相比, 甘肃省中东部地区的PM2.5归因死亡人数较多, 尤以兰州市最多;除嘉峪关市外, 大多数地区PM2.5归因死亡人数呈下降趋势.
(3) 研究期间, 在不同驱动因素中, PM2.5浓度下降对减轻甘肃省健康负担的贡献最大, 使归因死亡人数减少了28.55%. 然而, 人口老龄化是增加健康负担的重要因素, 导致归因死亡人数增加了16.16%. 随着人口老龄化趋势的不断加剧, 需要采取更有针对性的措施, 大幅降低污染物浓度并改善当地医疗条件, 以避免更多的归因死亡.
| [1] | GBD 2019 Risk Factors Collaborators. Global burden of 87 risk factors in 204 countries and territories, 1990-2019: a systematic analysis for the Global Burden of Disease Study 2019[J]. The Lancet, 2020, 396(10258): 1223-1249. DOI:10.1016/S0140-6736(20)30752-2 |
| [2] | Wang Z G, Hu B F, Zhang C, et al. How the Air Clean Plan and carbon mitigation measures co-benefited China in PM2.5 reduction and health from 2014 to 2020[J]. Environment International, 2022, 169. DOI:10.1016/j.envint.2022.107510 |
| [3] | Cohen A J, Brauer M, Burnett R, et al. Estimates and 25-year trends of the global burden of disease attributable to ambient air pollution: an analysis of data from the Global Burden of Diseases Study 2015[J]. The Lancet, 2017, 389(10082): 1907-1918. DOI:10.1016/S0140-6736(17)30505-6 |
| [4] | Burnett R, Chen H, Szyszkowicz M, et al. Global estimates of mortality associated with long-term exposure to outdoor fine particulate matter[J]. Proceedings of the National Academy of Sciences of the United States of America, 2018, 115(38): 9592-9597. |
| [5] | Brunekreef B, Strak M, Chen J, et al. Mortality and morbidity effects of long-term exposure to low-level PM2.5, BC, NO2, and O3: an analysis of European cohorts in the ELAPSE project[R]. Boston: Health Effects Institute, 2021. |
| [6] | World Health Organization (WHO). WHO global air quality guidelines: particulate matter (PM2.5 and PM10), ozone, nitrogen dioxide, sulfur dioxide and carbon monoxide[R]. Geneva: World Health Organization, 2021. |
| [7] | Fuller R, Landrigan P J, Balakrishnan K, et al. Pollution and health: a progress update[J]. The Lancet Planetary Health, 2022, 6(6): e535-e547. DOI:10.1016/S2542-5196(22)00090-0 |
| [8] | Zhang Q, Zheng Y X, Tong D, et al. Drivers of improved PM2.5 air quality in China from 2013 to 2017[J]. Proceedings of the National Academy of Sciences of the United States of America, 2019, 116(49): 24463-24469. |
| [9] | Yue H B, He C Y, Huang Q X, et al. Stronger policy required to substantially reduce deaths from PM2.5 pollution in China[J]. Nature Communications, 2020, 11(1). DOI:10.1038/s41467-020-15319-4 |
| [10] | Xiao Q Y, Geng G N, Xue T, et al. Tracking PM2.5 and O3 pollution and the related health burden in China 2013-2020[J]. Environmental Science & Technology, 2022, 56(11): 6922-6932. |
| [11] | Cheng J, Tong D, Zhang Q, et al. Pathways of China's PM2.5 air quality 2015-2060 in the context of carbon neutrality[J]. National Science Review, 2021, 8(12). DOI:10.1093/nsr/nwab078 |
| [12] | Li J, Liu H, Lv Z F, et al. Estimation of PM2.5 mortality burden in China with new exposure estimation and local concentration-response function[J]. Environmental Pollution, 2018, 243: 1710-1718. DOI:10.1016/j.envpol.2018.09.089 |
| [13] | Liu M, Saari R K, Zhou G X, et al. Recent trends in premature mortality and health disparities attributable to ambient PM2.5 exposure in China: 2005-2017[J]. Environmental Pollution, 2021, 279. DOI:10.1016/j.envpol.2021.116882 |
| [14] | Geng G N, Zheng Y X, Zhang Q, et al. Drivers of PM2.5 air pollution deaths in China 2002-2017[J]. Nature Geoscience, 2021, 14(9): 645-650. DOI:10.1038/s41561-021-00792-3 |
| [15] |
张茹婷, 陈传敏, 刘松涛, 等. 京津冀地区"煤改电"对PM2.5污染的健康效益评估[J]. 环境科学, 2023, 44(12): 6541-6555. Zhang R T, Chen C M, Liu S T, et al. Health benefit assessment of coal to electricity policy on PM2.5 pollution in Beijing-Tianjin-Hebei region[J]. Environmental Science, 2023, 44(12): 6541-6555. |
| [16] |
陈菁, 彭金龙, 徐彦森. 北京市2014~2020年PM2.5和O3时空分布与健康效应评估[J]. 环境科学, 2021, 42(9): 4071-4082. Chen J, Peng J L, Xu Y S. Spatiotemporal distribution and health impacts of PM2.5 and O3 in Beijing, from 2014 to 2020[J]. Environmental Science, 2021, 42(9): 4071-4082. |
| [17] | Xu M, Qin Z F, Zhang S H, et al. Health and economic benefits of clean air policies in China: a case study for Beijing-Tianjin-Hebei region[J]. Environmental Pollution, 2021, 285. DOI:10.1016/j.envpol.2021.117525 |
| [18] |
魏彤, 李政蕾, 陈昱, 等. 长三角居民PM2.5暴露水平下降的健康效益评估[J]. 中国环境科学, 2023, 43(6): 3211-3219. Wei T, Li Z L, Chen Y, et al. Assessment of the health benefits of declining PM2.5 levels in the Yangtze River Delta[J]. China Environmental Science, 2023, 43(6): 3211-3219. |
| [19] |
蔡清楠, 车扬子, 孙凌瑜, 等. 珠三角地区PM2.5浓度估算及其健康效应评估[J]. 生态学报, 2021, 41(22): 8977-8990. Cai Q N, Che Y Z, Sun L Y, et al. PM2.5 concentration prediction and its health effect in the Pearl River Delta of China[J]. Acta Ecologica Sinica, 2021, 41(22): 8977-8990. |
| [20] | Lu X C, Chen Y, Huang Y Q, et al. Exposure and mortality apportionment of PM2.5 between 2006 and 2015 over the Pearl River Delta region in southern China[J]. Atmospheric Environment, 2020, 231. DOI:10.1016/j.atmosenv.2020.117512 |
| [21] | Li Y, Zhao X G, Liao Q, et al. Specific differences and responses to reductions for premature mortality attributable to ambient PM2.5 in China[J]. Science of the Total Environment, 2020, 742. DOI:10.1016/j.scitotenv.2020.140643 |
| [22] |
张梦娇, 苏方成, 徐起翔, 等. 2013~2017年中国PM2.5污染防治的健康效益评估[J]. 环境科学, 2021, 42(2): 513-522. Zhang M J, Su F C, Xu Q X, et al. Health impact attributable to the control of PM2.5 pollution in China during 2013-2017[J]. Environmental Science, 2021, 42(2): 513-522. |
| [23] | Li Y, Liao Q, Zhao X G, et al. Premature mortality attributable to PM2.5 pollution in China during 2008-2016: underlying causes and responses to emission reductions[J]. Chemosphere, 2021, 263. DOI:10.1016/j.chemosphere.2020.127925 |
| [24] | Guan Q Y, Cai A, Wang F F, et al. Spatio-temporal variability of particulate matter in the key part of Gansu Province, Western China[J]. Environmental Pollution, 2017, 230: 189-198. DOI:10.1016/j.envpol.2017.06.045 |
| [25] | Geng G N, Xiao Q Y, Liu S G, et al. Tracking air pollution in China: near real-time PM2.5 retrievals from multisource data fusion[J]. Environmental Science & Technology, 2021, 55(17): 12106-12115. |
| [26] | Chen L, Liao H, Zhu J, et al. Increases in ozone-related mortality in China over 2013-2030 attributed to historical ozone deterioration and future population aging[J]. Science of the Total Environment, 2023, 858. DOI:10.1016/j.scitotenv.2022.159972 |
| [27] | Chen J, Guo L Q, Liu H M, et al. Modification effects of ambient temperature on associations of ambient ozone exposure before and during pregnancy with adverse birth outcomes: a multicity study in China[J]. Environment International, 2023, 172. DOI:10.1016/j.envint.2023.107791 |
| [28] | 甘肃省统计局, 国家统计局甘肃调查总队. 甘肃发展年鉴2021[M]. 北京: 中国统计出版社, 2021. |
| [29] | 中国疾病预防控制中心慢性非传染性疾病预防控制中心, 国家卫生健康委统计信息中心. 中国死因监测数据集(2013~2020)[M]. 北京: 中国科学技术出版社: 2015-2021. |
| [30] |
郭春晔, 王颖, 刘灏, 等. 甘肃省区域颗粒物时空分布特征及传输路径[J]. 中国环境科学, 2021, 41(9): 3990-4000. Guo C Y, Wang Y, Liu H, et al. Spatial and temporal distribution characteristics and transport path analysis of regional particulate matter over Gansu Province[J]. China Environmental Science, 2021, 41(9): 3990-4000. |
| [31] | Han L Y, Zhang Z C, Zhang Q, et al. Desertification assessments in the Hexi corridor of northern China's Gansu Province by remote sensing[J]. Natural Hazards, 2015, 75(3): 2715-2731. DOI:10.1007/s11069-014-1457-0 |
| [32] | 甘肃省生态环境厅. 2015年甘肃省环境状况公报[EB/OL]. http://sthj.gansu.gov.cn/sthj/c114873/201606/7fda13e13cb24bffa76152edbbdf78a0.shtml, 2016-06-05. |
| [33] | Wu W J, Yao M H, Yang X C, et al. Mortality burden attributable to long-term ambient PM2.5 exposure in China: using novel exposure-response functions with multiple exposure windows[J]. Atmospheric Environment, 2021, 246. DOI:10.1016/j.atmosenv.2020.118098 |
| [34] | Zheng S, Schlink U, Ho K F, et al. Spatial distribution of PM2.5-related premature mortality in China[J]. GeoHealth, 2021, 5(12). DOI:10.1029/2021GH000532 |
| [35] |
李勇, 廖琴, 赵秀阁, 等. PM2.5污染对我国健康负担和经济损失的影响[J]. 环境科学, 2021, 42(4): 1688-1695. Li Y, Liao Q, Zhao X G, et al. Influence of PM2.5 pollution on health burden and economic loss in China[J]. Environmental Science, 2021, 42(4): 1688-1695. |
| [36] | Tang R, Zhao J, Liu Y F, et al. Air quality and health co-benefits of China's carbon dioxide emissions peaking before 2030[J]. Nature Communications, 2022, 13(1). DOI:10.1038/s41467-022-28672-3 |
| [37] | Xu F J, Huang Q X, Yue H B, et al. The challenge of population aging for mitigating deaths from PM2.5 air pollution in China[J]. Nature Communications, 2023, 14(1). DOI:10.1038/s41467-023-40908-4 |
| [38] | Liao Q, Jin W Q, Tao Y, et al. Health and economic loss assessment of PM2.5 pollution during 2015-2017 in Gansu Province, China[J]. International Journal of Environmental Research and Public Health, 2020, 17(9). DOI:10.3390/ijerph17093253 |
| [39] | Liu Y, Tong D, Cheng J, et al. Role of climate goals and clean-air policies on reducing future air pollution deaths in China: a modelling study[J]. The Lancet Planetary Health, 2022, 6(2): e92-e99. DOI:10.1016/S2542-5196(21)00326-0 |
| [40] | Ding D, Xing J, Wang S X, et al. Estimated contributions of emissions controls, meteorological factors, population growth, and changes in baseline mortality to reductions in ambient PM2.5 and PM2.5-related Mortality in China, 2013-2017[J]. Environmental Health Perspectives, 2019, 127(6). DOI:10.1289/EHP4157 |
| [41] | United Nations. World population prospects 2022[R]. New York: United Nations, 2022. |
| [42] | Maji K J. Substantial changes in PM2.5 pollution and corresponding premature deaths across China during 2015-2019: a model prospective[J]. Science of the Total Environment, 2020, 729. DOI:10.1016/j.scitotenv.2020.138838 |
| [43] | Xue T, Zhu T, Zheng Y X, et al. Change in the number of PM2.5-attributed deaths in China from 2000 to 2010: comparison between estimations from census-based epidemiology and pre-established exposure-response functions[J]. Environment International, 2019, 129: 430-437. DOI:10.1016/j.envint.2019.05.067 |
| [44] | Shin H H, Cohen A J, Pope C A, et al. Meta-analysis methods to estimate the shape and uncertainty in the association between long-term exposure to ambient fine particulate matter and cause-specific mortality over the global concentration range[J]. Risk Analysis, 2016, 36(9): 1813-1825. DOI:10.1111/risa.12421 |
| [45] | Chan T C, Zhang Z L, Lin B C, et al. Long-term exposure to ambient fine particulate matter and chronic kidney disease: a cohort study[J]. Environmental Health Perspectives, 2018, 126(10). DOI:10.1289/EHP3304 |
| [46] | Wang Q, Wang J N, He M Z, et al. A county-level estimate of PM2.5 related chronic mortality risk in China based on multi-model exposure data[J]. Environment International, 2018, 110: 105-112. DOI:10.1016/j.envint.2017.10.015 |