 2024, Vol. 45


2. 信阳师范大学河南省水土环境污染协同防治重点实验室, 信阳 464000;
3. 中国科学院大气物理研究所大气边界层物理和大气化学国家重点实验室, 北京 100029;
4. 郑州大学化学学院, 郑州 450001
2. Henan Key Laboratory for Synergistic Prevention of Water and Soil Environmental Pollution, Xinyang Normal University, Xinyang 464000, China;
3. State Key Laboratory of Atmospheric Boundary Layer Physics and Atmospheric Chemistry, Institute of Atmospheric Physics, Chinese Academy of Sciences, Beijing 100029, China;
4. College of Chemistry, Zhengzhou University, Zhengzhou 450001, China
随着我国工业化进程和城市扩张加快, 以细颗粒物(PM2.5)和臭氧(O3)为特征的大气污染问题突出[1 ~ 4]. 为减轻区域PM2.5污染, 我国采取了一系列严格的污染减排和控制措施. 经过努力, 我国PM2.5浓度显著下降[5, 6]. 然而O3浓度呈升高趋势, 成为一些城市/区域在暖季的首要污染物[7 ~ 10]. O3浓度超标威胁人类健康、生态系统和农作物产量[11, 12].
对流层中的O3主要来自挥发性有机物(VOCs)和氮氧化物(NOx)的光化学反应, VOCs和NOx浓度深刻影响O3浓度, PM2.5也与O3有复杂的耦合关系. PM2.5浓度降低增加了光通量, 增强了光化学反应, 导致O3浓度升高[13]. PM2.5浓度降低可能减缓了HO2自由基的气溶胶沉降, 进而刺激了O3的生成[14]. O3生消也受太阳辐射、风速和相对湿度(RH)等气象要素影响[15 ~ 17]. O3观测时间序列通常包含了气象信息与污染源信息. 将两者信息分离, 分别解析气象条件和污染排放对O3浓度变化的贡献, 对准确评估污染控制措施有重要意义. 分离气象因素影响的方法有机器学习、KZ(Kolmogorov-Zurbenko)滤波、数理统计和空气质量模式等[18 ~ 21]. 其中KZ滤波法得到较多应用, 专家学者利用该法开展了O3时间序列的分解与重建研究. 例如:刘晓咏等[22]使用KZ滤波评估了人为排放对信阳市O3的影响;王浩琪等[23]利用KZ滤波研究了我国337个地级行政区O3变化的驱动因素;余益军等[24]基于KZ滤波考察了气象和排放对京津冀地区O3的贡献;张洁琼等[25]利用KZ滤波讨论了天津市气象要素与O3浓度的关系. 在淮河流域、珠三角和长三角也有关于KZ滤波解析气象和排放对O3贡献的研究[26 ~ 28].
青藏高原平均海拔超过4 000 m, 是我国最大、世界最高的高原, 有“世界屋脊”、“第三极”之称[29], 对东亚甚至全球的气候和环境变化都有着重要的影响[30, 31]. 青藏高原地区对人为影响敏感, 目前面临着冰川消融、大气污染和水土流失等环境问题[32 ~ 35]. 尽管关于青藏高原地区大气污染的研究已有相关报道, 但其主要针对个别城市, 并主要关注污染的时空变化特征, 鲜见关于气象和排放对青藏高原区域O3贡献的研究. 鉴于此, 本研究利用2015~2021年青藏高原12个城市的大气污染监测和气象数据, 分析青藏高原地表臭氧时空格局, 利用KZ滤波对O3序列分解和重建, 评估气象和排放对O3浓度变化的贡献, 以期加深对青藏高原地区大气污染状况的了解, 并为监管政策的制定提供科技支撑.
1 材料与方法 1.1 站点与数据来源青藏高原(26.00°N~39.78°N, 73.32°E~104.78°E)位于我国西南部(图 1), 总面积约250万km2、人口约300万. 阿里、日喀则、拉萨、山南、那曲、林芝、昌都、海西、果洛、西宁、阿坝和迪庆是青藏高原人口最多的12个城市, 其中阿坝属于四川、迪庆属于云南, 其余10个城市都属于西藏或青海. 各城市面积、人口和海拔等数据如表 1所列.

|
图 1 青藏高原各城市位置示意 Fig. 1 Location of cities on the Qinghai-Xizang Plateau |
|
|
表 1 青藏高原城市信息1) Table 1 Information on the cities of the Qinghai-Xizang Plateau |
12个城市2015年1月1日至2021年12月31日(迪庆从2016年开始)的大气污染物(O3、NO2和PM2.5)小时浓度监测数据来自中国环境监测总站, 经过有效性审核. O3日评价指标采用O3日最大8 h(O3-8h)滑动平均值, 然后计算月份和季节平均浓度. O3的年评价值采用全年O3-8h的第90百分位数.
12个城市2015年1月1日至2021年12月31日的气象观测数据, 包括温度(T)、气压(p)、相对湿度(RH)、10 m风速(WS)、降水(Pre)和日照时长(SSD), 来自国家气象科学数据中心, 时间分辨率为d.
1.2 KZ滤波大气污染物长时间序列包含若干不同周期的波动, 可对其进行时间序列分解[23]:
|
(1) |
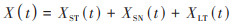
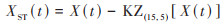
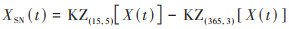
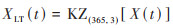
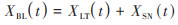
式中, X(t)为污染物原始浓度序列, XST(t)、XSN(t)和XLT(t)分别为短期、季节和长期分量. 短期分量反映了排放和气象的短期波动[36];季节分量受污染和气象的季节变化影响[37];长期分量是排放、气候和经济变化的综合结果[38]. 长期分量和季节分量之和定义为基线分量XBL(t).
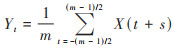
KZ滤波是一种低通滤波器, 由Rao等[39]在1994年提出. KZ滤波是经p次迭代的m点滑动平均, 其数学表达形式为:
|
(2) |
式中, X为污染物原始序列;t为时间点;s为滑动窗口变量;Yt为经过一次滤波后的时间序列, 并将作为下一次滤波的输入;如此迭代p次, 即KZ( m, p). 通过控制m和p [23], 可进行不同尺度的滤波, 有效滤波宽度N满足下面公式:

|
(3) |
式(3)表示小于N的高频波被滤除. KZ(15, 5)有效滤波宽度约为33 d, KZ(365, 3)有效滤波宽度约为632 d[22]. 各分量可由下列公式计算:
|
(4) |
|
(5) |
|
(6) |
|
(7) |
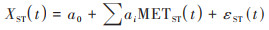
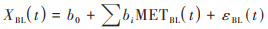
经KZ滤波分解出的污染物长期分量仍然包含气象条件的影响, 多元线性回归是消除气象影响的有效方法[40, 41]. 分别建立污染物短期分量和基线分量与对应气象要素的多元线性回归模型:
|
(8) |
|
(9) |
|
(10) |
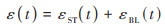
式中, METST(t)为第i个气象要素(T、p、RH、WS、Pre和SSD)的长期分量;METBL(t)为第i个气象要素的基线分量;εST(t)和εBL(t)分别为短期分量和基线分量的拟合残差, ε(t)为εST(t)与εBL(t)之和;a0和b0为截距;ai和bi为回归系数.
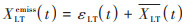
ε(t)主要反映了污染源变化的贡献, 也包含回归时未考虑到的气象因子和建模误差等贡献. 利用KZ(365, 3)对ε(t)进行再次滤波得到εLT(t), 该序列与气象无关. 对式(6)得到的XLT(t)取均值, 得到
|
(11) |
式中, XLTemiss(t)为与气象无关、与排放有关的污染物长期分量;
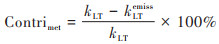
根据Sun等[42]建议, 气象条件对污染物长期成分的贡献可通过下式计算:
|
(12) |
式中, Contrimet为气象条件的贡献率(%), kLT为气象调整前污染物长期分量的线性变化趋势[μg·(m3·a)-1], kLTemiss(t)为气象调整后污染物长期分量的线性变化趋势[μg·(m3·a)-1].
2 结果与讨论 2.1 青藏高原地表臭氧年变化2015~2021年青藏高原城市地表O3-8h浓度年均值如图 2所示. 2015~2021年12个城市ρ(O3-8h)年均值范围为78.7~156.7 μg·m-3, 整个区域2015~2021年均值分别为119.3、117.4、125.6、128.9、125.5、119.5和127.8 μg·m-3. 相比之下, 京津冀地区2015~2021年ρ(O3-8h)(第90百分位数)范围为158.0~171.1 μg·m-3 [43], 广东省和珠三角2014~2019年ρ(O3-8h)(第90百分位数)范围分别为126~158 μg·m-3和133~176 μg·m-3 [44]. 果洛和那曲的ρ(O3-8h)分别为最高和最低, 7 a平均值分别为136.9 μg·m-3和98.6 μg·m-3. 《环境空气质量标准》(GB 3095-2012)中规定O3二级标准限值为160 μg·m-3. 2015~2021年青藏高原O3二级浓度超标率为0.7%~1.5%. 2021年O3浓度超标天数大于10 d的城市有阿里(27 d)、西宁(15 d)和果洛(10 d).

|
图 2 2015~2021年青藏高原12个城市O3-8h年变化 Fig. 2 Annual changes in O3-8h mass concentration in 12 cities on the Qinghai-Xizang Plateau from 2015 to 2021 |
图 3展示了2015~2021年青藏高原各城市O3-8h浓度的月变化趋势. 各城市O3-8h展现出明显的月变化特征, 其中那曲、海西、果洛和西宁呈单峰倒“V”型, 其他城市呈多峰“M”型. O3-8h月浓度峰值出现在4~7月, 谷值多出现在7月、9月和12月. 1~5月各城市O3-8h浓度基本都呈上升趋势. 7~9月日喀则、拉萨、林芝和迪庆等城市O3-8h浓度显著降低, 甚至出现全年谷值. 从季节看, 阿坝、昌都、迪庆、拉萨、果洛、林芝、那曲、日喀则和山南在春季O3-8h浓度最高, 阿里、海西和西宁在夏季O3-8h浓度最高. 阿坝、昌都、迪庆和果洛的O3-8h浓度在秋季最低, 其它城市(除了迪庆和林芝)在冬季最低.

|
图 3 2015~2021年青藏高原12个城市O3-8h浓度月变化 Fig. 3 Monthly changes in O3-8h mass concentration in 12 cities on the Qinghai-Xizang Plateau from 2015 to 2021 |
青藏高原12个城市O3-8h浓度展现出明显的日变化特征, 与我国其它区域报道的结果基本一致[45, 46]. 如图 4所示, 各城市O3在四季均呈“日高夜低”的单峰特征. O3作为光化学产物, 与太阳辐射密切相关. O3-8h浓度通常从08:00~10:00开始升高, 在15:00~18:00出现最大值, 随后浓度降低, 在第2 d的08:00~09:00出现最小值. 在白天光化学反应较强, O3生成剧烈. 而夜晚光化学反应基本停止, 且O3被NO滴定消耗. 总体而言, 青藏高原ρ(O3-8h)在白天(08:00~19:00)和夜晚(20:00~08:00)分别为(76.8 ± 24.0)μg·m-3和(63.4 ± 20.2)μg·m-3. 在冬季12个城市O3-8h浓度谷值和峰值出现的时间比其它季节晚1~2 h, 可能是冬季日出较晚导致[34].

|
图 4 2015~2021年青藏高原12个城市四季的O3-8h日变化趋势 Fig. 4 Diurnal variations in O3-8h in 12 cities on the Qinghai-Xizang Plateau during the four seasons from 2015 to 2021 |
使用KZ滤波将青藏高原12个城市O3-8h原始浓度序列分解为不同时间尺度分量. 图 5展示了各分量方差对原始序列方差的贡献. 理想情况下, 短期、季节和长期分量三者相互独立, 三分量方差之和为100%[47]. 3个分量对青藏高原O3-8h总方差的贡献率为83.3%~95.1%(平均值为90.1%)[图 5(d)], 表明KZ滤波分解效果较为理想. 12个城市O3-8h短期、季节和长期分量对总方差的贡献率分别为14.5%~49.2%(平均值为29.6%)、34.8%~69.4%(平均值为51.4%)和0.6%~33.7%(平均值为9.1%). 从区域整体看, 季节分量的方差贡献最大, 在淮河流域也有类似报道[26]. 短期和季节分量的方差总贡献率为81.0%, 表明青藏高原O3-8h原始序列波动主要由污染排放和气象的短期变化和季节变化引起. 从城市看, 果洛受短期分量影响最大(49.2%), 西宁受季节分量影响最大(69.4%). 阿里(33.7%)和那曲(28.8%)的长期分量对总方差贡献较大, 其它城市贡献率都小于9.6%. 总体上长期分量的贡献远小于短期和季节分量, 因此有必要将长期分量从原始序列中分离出来, 获得长期变化趋势.

|
红色数值表示区域平均值 图 5 青藏高原12个城市O3-8h浓度各分量方差对原始序列方差贡献 Fig. 5 Variance explanation of each component to the original O3-8h variations in 12 cities on the Qinghai-Xizang Plateau |
青藏高原12个城市短期、季节和长期分量的平均值如图 6所示. 任意两个分量的Pearson相关系数小于0.07, 表明3个分量基本相互独立. O3-8h原始序列有明显的季节循环叠加高频噪声[图 6(a)], 在2018年6月达到最高值224.3 μg·m-3. O3-8h短期分量的范围为-39.9~35.1 μg·m-3[图 6(b)], 其高频变化主要归因于短期和天气尺度的气象过程[48]. O3-8h季节分量有明显的不规则季节循环[图 6(c)], 可能是排放和气象造成. 过滤短期和季节分量后, 得到清晰的O3-8h长期分量, 如图 6(d)所示. 青藏高原O3-8h长期分量呈下降-上升-下降-上升的变化特征, 2018年以前变幅较大, 此后变幅较小.

|
图 6 2015~2021年青藏高原12个城市O3-8h经KZ滤波分解后的组分 Fig. 6 Components of O3-8h decomposed by KZ filter over 12 cities on the Qinghai-Xizang Plateau from 2015 to 2021 |
为了解各气象条件与O3浓度变化的相关性, 计算了不同气象要素基线分量与O3-8h基线分量的Pearson相关系数, 如表 2. T可以提高化学反应速率, SSD与太阳辐射密切相关. 在很多城市, O3-8h与T和SSD呈显著正相关[49, 50]. 而在青藏高原地区T与O3-8h在海西和西宁为高度正相关, 在林芝和迪庆呈负相关. SSD与O3-8h在12个城市的相关性均较弱. 日喀则、林芝、迪庆和阿坝的RH与O3-8h为负相关, 可能是高RH削弱了太阳辐射, 导致O3光化学生成减少. 12个城市的WS与O3-8h浓度基本为正相关, 并且在日喀则、拉萨、昌都、迪庆和阿坝呈显著正相关. 可能是强风增强了O3前体污染物的传输[51], 导致O3浓度升高. 闫慧等[52]的研究表明青藏高原城市的O3以区域传输为主. 平流层的入侵对青藏高原地表O3也有重要影响. Chou等[53]的研究发现上层湍流与边界层湍流耦合时, 强边界层湍流导致上层富含O3的空气与近地表空气混合, 增加了近地面O3浓度.
|
|
表 2 青藏高原12个城市O3-8h基线分量与气象要素基线分量的Pearson相关系数 Table 2 Pearson correlation coefficients between baseline components of O3-8h and baseline components of meteorological factor components for 12 cities on the Qinghai-Xizang Plateau |
2.6 气象调整前后青藏高原地表臭氧浓度长期分量变化趋势
青藏高原12个城市气象调整前后O3-8h浓度长期变化趋势如图 7所示. 红线在蓝线上方(即气象调整前 > 气象调整后)表明气象条件不利于O3-8h浓度的降低, 反之表明气象条件利于O3-8h浓度降低. 可以看出, 阿里、山南、那曲和海西气象调整前后曲线差异较小, 表明气象条件对O3-8h浓度的贡献较小. 而其它城市气象调整前后曲线差异较大, 表明气象条件影响较大.

|
图 7 2015~2021年青藏高原12个城市气象调整前后O3-8h浓度的长期变化趋势 Fig. 7 Long-term trends of O3-8h concentrations before and after meteorological adjustments in 12 cities on the Qinghai-Xizang Plateau from 2015 to 2021 |
气象调整前后O3-8h浓度长期分量的差值即为气象条件的贡献, 差值为正表明气象条件有利于污染的改善, 反之不利于污染改善. 如图 8所示, 日喀则和果洛的气象先有利于O3-8h长期分量的降低, 然后转为不利影响;林芝、海西和西宁的气象先不利于O3-8h长期分量的降低, 然后转为有利影响. 其它城市的气象则在有利和不利间波动. 从整个区域看, 2015~2017年气象条件对青藏高原O3-8h降低不利, 使得O3-8h长期分量升高0.2~2.1 μg·m-3. 2018~2021年气象有利于O3-8h浓度降低, 导致O3-8h长期分量降低0.4~1.1 μg·m-3.

|
图 8 2015~2021年青藏高原12个城市气象条件对O3-8h浓度长期分量的影响 Fig. 8 Influence of meteorological conditions on the long-term component of O3-8h concentration in 12 cities on the Qinghai-Xizang Plateau from 2015 to 2021 |
使用Theil-Sen估算O3-8h长期分量变化趋势, 表 3列出了通过显著性检验的城市. 2015 ~ 2021年, 阿里、日喀则、那曲、海西和西宁的O3-8h长期分量以0.32 ~ 7.53 μg·(m3·a)-1的速度增加, 拉萨、林芝、昌都和果洛的O3-8h长期分量以1.83~2.39 μg·(m3·a)-1的速度下降. 气象条件对9个城市O3-8h长期分量的贡献率为-359.0% ~ 56.5%. 气象条件增加了阿里、拉萨、那曲、林芝、昌都、海西和西宁的O3-8h长期分量, 贡献率为13.6% ~ 54.8%(平均30.1%). 气象条件降低了日喀则和果洛的O3-8h长期分量, 贡献率分别为359.0%和56.5%.
|
|
表 3 气象调整前后青藏高原城市O3-8h长期分量变化趋势1) Table 3 Trends in long-term component of O3-8h in Qinghai-Xizang Plateau cities before and after meteorological adjustments |
2.8 污染排放对青藏高原地表臭氧浓度长期趋势的贡献
为考察PM2.5和NO2对O3浓度的影响, 使用KZ滤波获得了各城市2015~2021年PM2.5和NO2的长期分量, 并使用Theil-Sen估算了长期变化趋势. 如表 4所示, 9个城市的PM2.5长期分量以0.68~7.35 μg·(m3·a)-1的速度下降, NO2长期分量(除海西)以0.34~2.16 μg·(m3·a)-1的速度下降. 在O3-8h长期分量上升的城市中, PM2.5长期分量的平均下降速度为4.04 μg·(m3·a)-1;在O3-8h长期分量下降的城市中, PM2.5长期分量的平均下降速度为2.67 μg·(m3·a)-1. PM2.5浓度的快速降低减轻了消光作用, 增强了O3的光化学生成. 在拉萨、林芝、昌都和果洛, NO2浓度下降抵消了PM2.5浓度下降造成的不利影响, 因此O3-8h长期分量呈下降趋势. 而在阿里、日喀则、那曲和西宁, PM2.5浓度下降抵消了NO2浓度下降带来的有利影响, 导致O3-8h长期分量上升.
|
|
表 4 2015~2021年青藏高原城市PM2.5和NO2长期分量变化趋势1) Table 4 Trends of long-term component of PM2.5 and NO2 in cities on the Qinghai-Xizang Plateau from 2015 to 2021 |
3 结论
(1)2015~2021年青藏高原12个城市地表ρ(O3-8h)为78.7~156.7 μg·m-3, O3浓度超标率(国家二级标准)为0.7%~1.5%. O3月浓度峰值出现在4~7月, 谷值多出现在7月、9月和12月. 在日变化趋势上, 各城市O3在四季均呈“日高夜低”的单峰特征.
(2)O3短期、季节和长期分量对12个城市O3-8h原始序列总方差的贡献率分别为29.6%、51.4%和9.1%. 果洛受短期分量影响最大(49.2%), 西宁受季节分量影响最大(69.4%), 阿里(33.7%)和那曲(28.8%)受季节分量影响较大.
(3)从整个区域看, 2015~2017年气象条件对青藏高原O3-8h降低不利, 使得O3-8h长期分量升高0.2~2.1 μg·m-3. 2018~2021年气象有利于O3-8h浓度降低, 导致O3-8h长期分量降低0.4~1.1 μg·m-3.
(4)气象条件增加了阿里、拉萨、那曲、林芝、昌都、海西和西宁的O3-8h长期分量, 平均贡献率为30.1%. 气象条件降低了日喀则和果洛的O3-8h长期分量, 贡献率分别为359.0%和56.5%. 阿里、日喀则、那曲、海西和西宁的PM2.5长期分量快速下降[4.04 μg·(m3·a)-1]导致其O3-8h长期分量上升.
| [1] |
贺泓, 王新明, 王跃思, 等. 大气灰霾追因与控制[J]. 中国科学院院刊, 2013, 28(3): 344-352. He H, Wang X M, Wang Y S, et al. Formation mechanism and control strategies of haze in China[J]. Bulletin of Chinese Academy of Sciences, 2013, 28(3): 344-352. |
| [2] | Huang R J, Zhang Y L, Bozzetti C, et al. High secondary aerosol contribution to particulate pollution during haze events in China[J]. Nature, 2014, 514(7521): 218-222. DOI:10.1038/nature13774 |
| [3] | Zhang Q, Zheng Y X, Tong D, et al. Drivers of improved PM2.5 air quality in China from 2013 to 2017[J]. Proceedings of the National Academy of Sciences of the United States of America, 2019, 116(49): 24463-24469. |
| [4] |
赵楠, 卢毅敏. 中国地表臭氧浓度估算及健康影响评估[J]. 环境科学, 2022, 43(3): 1235-1245. Zhao N, Lu Y M. Estimation of surface ozone concentration and health impact assessment in China[J]. Environmental Science, 2022, 43(3): 1235-1245. |
| [5] |
李慧, 王淑兰, 张文杰, 等. 京津冀及周边地区"2+26"城市空气质量特征及其影响因素[J]. 环境科学研究, 2021, 34(1): 172-184. Li H, Wang S L, Zhang W J, et al. Characteristics and influencing factors of urban air quality in Beijing-Tianjin-Hebei and its surrounding areas ('2+26' Cities)[J]. Research of Environmental Sciences, 2021, 34(1): 172-184. |
| [6] |
张运江, 雷若媛, 崔世杰, 等. 2015~2020年我国主要城市PM2.5和O3污染时空变化趋势和影响因素[J]. 科学通报, 2022, 67(18): 2029-2042. Zhang Y J, Lei R Y, Cui S J, et al. Spatiotemporal trends and impact factors of PM2.5 and O3 pollution in major cities in China during 2015-2020[J]. Chinese Science Bulletin, 2022, 67(18): 2029-2042. |
| [7] |
袁鑫, 黄志炯, 陆梦华, 等. 基于观测和机器学习的珠三角臭氧污染季节特征演变及成因分析[J]. 环境科学学报, 2023, 43(8): 214-225. Yuan X, Huang Z J, Lu M H, et al. Seasonal evolution and cause analysis of ozone pollution in the Pearl River Delta based on observation and machine learning[J]. Acta Scientiae Circumstantiae, 2023, 43(8): 214-225. |
| [8] |
林文鹏, 郭欣瞳. 中国城市群臭氧时空分布特征分析[J]. 中国环境科学, 2022, 42(6): 2481-2494. Lin W P, Guo X T. Spatial and temporal distribution characteristics of ozone in Urban agglomerations in China[J]. China Environmental Science, 2022, 42(6): 2481-2494. |
| [9] | Wang Z L, Huang X, Wang N, et al. Aerosol-radiation interactions of dust storm deteriorate particle and ozone pollution in east China[J]. Journal of Geophysical Research, 2020, 125(24). DOI:10.1029/2020JD033601 |
| [10] | Wang R N, Bei N F, Hu B, et al. The relationship between the intensified heat waves and deteriorated summertime ozone pollution in the Beijing-Tianjin-Hebei region, China, during 2013-2017[J]. Environmental Pollution, 2022, 314. DOI:10.1016/j.envpol.2022.120256 |
| [11] |
阮芳芳, 刘纪新, 陈芷薇, 等. 不同臭氧度量指标对我国人群总死亡影响的Meta分析[J]. 环境科学, 2022, 43(1): 37-45. Ruan F F, Liu J X, Chen Z W, et al. Meta-analysis of the impact of different ozone metrics on total mortality in China[J]. Environmental Science, 2022, 43(1): 37-45. |
| [12] | Li D Y, Shindell D, Ding D A, et al. Surface ozone impacts on major crop production in China from 2010 to 2017[J]. Atmospheric Chemistry and Physics, 2022, 22(4): 2625-2638. DOI:10.5194/acp-22-2625-2022 |
| [13] | Wang W J, Parrish D D, Wang S W, et al. Long-term trend of ozone pollution in China during 2014-2020: distinct seasonal and spatial characteristics and ozone sensitivity[J]. Atmospheric Chemistry and Physics, 2022, 22(13): 8935-8949. DOI:10.5194/acp-22-8935-2022 |
| [14] | Li K, Jacob D J, Liao H, et al. Anthropogenic drivers of 2013-2017 trends in summer surface ozone in China[J]. Proceedings of the National Academy of Sciences of the United States of America, 2019, 116(2): 422-427. |
| [15] | Chen Z Y, Li R Y, Chen D L, et al. Understanding the causal influence of major meteorological factors on ground ozone concentrations across China[J]. Journal of Cleaner Production, 2020, 242. DOI:10.1016/j.jclepro.2019.118498 |
| [16] | Liu P F, Song H Q, Wang T H, et al. Effects of meteorological conditions and anthropogenic precursors on ground-level ozone concentrations in Chinese cities[J]. Environmental Pollution, 2020, 262. DOI:10.1016/j.envpol.2020.114366 |
| [17] |
董佳奇, 胡冬梅, 闫雨龙, 等. 基于可解释性机器学习的城市O3驱动因素挖掘[J]. 环境科学, 2023, 44(7): 3660-3668. Dong J Q, Hu D M, Yan Y L, et al. Revealing driving factors of urban O3 based on explainable machine learning[J]. Environmental Science, 2023, 44(7): 3660-3668. |
| [18] | Mousavinezhad S, Choi Y, Pouyaei A, et al. A comprehensive investigation of surface ozone pollution in China, 2015-2019: separating the contributions from meteorology and precursor emissions[J]. Atmospheric Research, 2021, 257. DOI:10.1016/j.atmosres.2021.105599 |
| [19] | Guo Y, Li K W, Zhao B, et al. Evaluating the real changes of air quality due to clean air actions using a machine learning technique: Results from 12 Chinese mega-cities during 2013-2020[J]. Chemosphere, 2022, 300. DOI:10.1016/j.chemosphere.2022.134608 |
| [20] | Du H Y, Li J, Wang Z F, et al. Assessment of the effect of meteorological and emission variations on winter PM2.5 over the North China Plain in the three-year action plan against air pollution in 2018-2020[J]. Atmospheric Research, 2022, 280. DOI:10.1016/j.atmosres.2022.106395 |
| [21] |
徐紫碟, 顾晨, 夏思佳, 等. 气象条件和排放变化对江苏省2015-2019年臭氧浓度年际变化的影响研究[J]. 环境科学学报, 2022, 42(8): 1-12. Xu Z D, Gu C, Xia S J, et al. Study on the effects of changing meteorology conditions and emissions on the interannual variation of ozone concentration in Jiangsu Province from 2015 to 2019[J]. Acta Scientiae Circumstantiae, 2022, 42(8): 1-12. |
| [22] |
刘晓咏, 张一丹, 闫军辉, 等. 人为排放对信阳市细颗粒物和臭氧的影响评估[J]. 信阳师范学院学报(自然科学版), 2023, 36(2): 190-195. Liu X Y, Zhang Y D, Yan J H, et al. Assessing the influence of anthropogenic emissionsons on fine particulate matter and ozone in Xinyang[J]. Journal of Xinyang Normal University (Natural Science Edition), 2023, 36(2): 190-195. |
| [23] |
王浩琪, 张裕芬, 罗忠伟, 等. 基于EOF分解和KZ滤波的2019~2021年中国臭氧时空变化及驱动因素分析[J]. 环境科学, 2023, 44(4): 1811-1820. Wang H Q, Zhang Y F, Luo Z W, et al. Spatial-temporal variation and driving factors of ozone in China from 2019 to 2021 based on EOF technique and KZ filter[J]. Environmental Science, 2023, 44(4): 1811-1820. |
| [24] |
余益军, 孟晓艳, 王振, 等. 京津冀地区城市臭氧污染趋势及原因探讨[J]. 环境科学, 2020, 41(1): 106-114. Yu Y J, Meng X Y, Wang Z, et al. Driving factors of the significant increase in surface ozone in the Beijing-Tianjin-Hebei region, China, During 2013-2018[J]. Environmental Science, 2020, 41(1): 106-114. |
| [25] |
张洁琼, 王雅倩, 高爽, 等. 不同时间尺度气象要素与空气污染关系的KZ滤波研究[J]. 中国环境科学, 2018, 38(10): 3662-3672. Zhang J Q, Wang Y Q, Gao S, et al. Study on the relationship between meteorological elements and air pollution at different time scales based on KZ filtering[J]. China Environmental Science, 2018, 38(10): 3662-3672. |
| [26] | Liu X Y, Gao H, Zhang X M, et al. Driving forces of meteorology and emission changes on surface ozone in the Huaihe River Basin, China[J]. Water, 2023, 234(6). DOI:10.1007/s11270-023-06345-1 |
| [27] | Yu Y J, Wang Z, He T, et al. Driving factors of the significant increase in surface ozone in the Yangtze River Delta, China, during 2013-2017[J]. Atmospheric Pollution Research, 2019, 10(4): 1357-1364. DOI:10.1016/j.apr.2019.03.010 |
| [28] | Yin C Q, Deng X J, Zou Y, et al. Trend analysis of surface ozone at suburban Guangzhou, China[J]. Science of the Total Environment, 2019, 695. DOI:10.1016/j.scitotenv.2019.133880 |
| [29] | Qiu J. China: the third pole[J]. Nature, 2008, 454(7203): 393-396. DOI:10.1038/454393a |
| [30] |
王春晓, 马耀明, 韩存博. 青藏高原大气边界层结构及其发展机制研究[J]. 地球科学进展, 2023, 38(4): 414-428. Wang C X, Ma Y M, Han C B. Research on the atmospheric boundary layer structure and its development mechanism in the Tibetan Plateau[J]. Advances in Earth Science, 2023, 38(4): 414-428. |
| [31] | Kang S C, Zhang Q G, Qian Y, et al. Linking atmospheric pollution to cryospheric change in the Third Pole region: current progress and future prospects[J]. National Science Review, 2019, 6(4): 796-809. DOI:10.1093/nsr/nwz031 |
| [32] | Jia W, Ma W D, Shi P J, et al. Monitoring rock desert formation caused by ice-snow melting in the Qinghai-Tibet Plateau using an optimized remote sensing technique: a case study of Yushu prefecture[J]. Remote Sensing, 2022, 14(3). DOI:10.3390/rs14030570 |
| [33] | Sun Y W, Yin H, Cheng Y, et al. Quantifying variability, source, and transport of CO in the urban areas over the Himalayas and Tibetan Plateau[J]. Atmospheric Chemistry and Physics, 2021, 21(11): 9201-9222. DOI:10.5194/acp-21-9201-2021 |
| [34] | Yin H, Sun Y W, Notholt J, et al. Quantifying the drivers of surface ozone anomalies in the urban areas over the Qinghai-Tibet Plateau[J]. Atmospheric Chemistry and Physics, 2022, 22(21): 14401-14419. DOI:10.5194/acp-22-14401-2022 |
| [35] | Xie S B, Qu J J, Xu X T, et al. Interactions between freeze-thaw actions, wind erosion desertification, and permafrost in the Qinghai-Tibet Plateau[J]. Natural Hazards, 2017, 85(2): 829-850. DOI:10.1007/s11069-016-2606-4 |
| [36] | Seo J, Kim J Y, Youn D, et al. On the multiday haze in the Asian continental outflow: the important role of synoptic conditions combined with regional and local sources[J]. Atmospheric Chemistry and Physics, 2017, 17(15): 9311-9332. DOI:10.5194/acp-17-9311-2017 |
| [37] | Liu X Y, Niu J Q, Wang Z F, et al. A comprehensive investigation of PM2.5 in the Huaihe River Basin, China: separating the contributions from meteorology and emission reductions[J]. Atmospheric Pollution Research, 2023, 14(1). DOI:10.1016/j.apr.2023.101647 |
| [38] | Agudelo⁃Castaneda D M, Calesso Teixeira E, Norte Pereira F. Time⁃series analysis of surface ozone and nitrogen oxides concentrations in an urban area at Brazil[J]. Atmospheric Pollution Research, 2014, 5(3): 411-420. DOI:10.5094/APR.2014.048 |
| [39] | Rao S T, Zurbenko I G. Detecting and tracking changes in ozone air quality[J]. Air & Waste, 1994, 44(9): 1089-1092. |
| [40] |
黎煜满, 李磊, 谢洁岚, 等. 基于KZ滤波法的韶关市O3不同时间尺度变化特征分析研究[J]. 环境科学学报, 2023, 43(1): 128-139. Li Y M, Li L, Xie J L, et al. Study on variation characteristics of O3 at different time scales in Shaoguan city based on KZ filter method[J]. Acta Scientiae Circumstantiae, 2023, 43(1): 128-139. |
| [41] |
赵域圻, 杨婷, 王自发, 等. 基于KZ滤波的京津冀2013~2018年大气污染治理效果分析[J]. 气候与环境研究, 2020, 25(5): 499-509. Zhao Y Q, Yang T, Wang Z F, et al. Effectiveness of air pollution control efforts in Beijing-Tianjin-Hebei region during 2013-2018 based on the Kolmogorov-Zurbenko filter[J]. Climatic and Environmental Research, 2020, 25(5): 499-509. |
| [42] | Sun X Y, Zhao T L, Bai Y Q, et al. Meteorology impact on PM2.5 change over a receptor region in the regional transport of air pollutants: observational study of recent emission reductions in central China[J]. Atmospheric Chemistry and Physics, 2022, 22(5): 3579-3593. DOI:10.5194/acp-22-3579-2022 |
| [43] |
宋小涵, 燕丽, 刘伟, 等. 2015~2021年京津冀及周边地区PM2.5和臭氧复合污染时空特征分析[J]. 环境科学, 2023, 44(4): 1841-1851. Song X H, Yan L, Liu W, et al. Spatiotemporal distribution characteristics of co-pollution of PM2.5 and ozone over BTH with surrounding area from 2015 to 2021[J]. Environmental Science, 2023, 44(4): 1841-1851. |
| [44] |
沈劲, 杨土士, 晏平仲, 等. 广东省臭氧污染特征及其成因分析[J]. 环境科学与技术, 2020, 43(12): 90-95. Shen J, Yang T S, Yan P Z, et al. Characteristics and causes of ozone pollution in Guangdong Province[J]. Environmental Science & Technology, 2020, 43(12): 90-95. |
| [45] |
蔡敏, 谷欣, 赵正昱, 等. 2016-2021年运城市区臭氧浓度特征及其与气象因素的关系[J]. 环境科学学报, 2023, 43(9): 229-243. Cai M, Gu X, Zhao Z Y, et al. Characteristics of ozone concentration and relationships with meteorological factors in Yuncheng City from 2016 to 2021[J]. Acta Scientiae Circumstantiae, 2023, 43(9): 229-243. |
| [46] |
汪宇, 彭钰雯, 陈多宏, 等. 珠三角城市近地面臭氧污染分布特征及变化趋势[J]. 环境污染与防治, 2019, 41(9): 1103-1107. Wang Y, Peng Y W, Chen D H, et al. Distribution and trends of ground level O3 pollution in the Pearl River Delta cities[J]. Environmental Pollution and Control, 2019, 41(9): 1103-1107. |
| [47] |
白鹤鸣, 师华定, 高庆先, 等. 基于气象调整的京津冀典型城市空气污染指数序列重建[J]. 生态与农村环境学报, 2015, 31(1): 44-49. Bai H M, Shi H D, Gao Q X, et al. Re-ordination of air pollution indices of some typical cities in Beijing-Tianjin-Hebei region based on meteorological adjustment[J]. Journal of Ecology and Rural Environment, 2015, 31(1): 44-49. |
| [48] | Ma Z Q, Xu J, Quan W J, et al. Significant increase of surface ozone at a rural site, north of eastern China[J]. Atmospheric Chemistry and Physics, 2016, 16(6): 3969-3977. DOI:10.5194/acp-16-3969-2016 |
| [49] | Wang L, Zhao B X, Zhang Y, et al. Correlation between surface PM2.5 and O3 in eastern China during 2015-2019: spatiotemporal variations and meteorological impacts[J]. Atmospheric Environment, 2023, 294. DOI:10.1016/j.atmosenv.2022.119520 |
| [50] | Shu L, Wang T J, Han H, et al. Summertime ozone pollution in the Yangtze River Delta of eastern China during 2013-2017: synoptic impacts and source apportionment[J]. Environmental Pollution, 2020, 257. DOI:10.1016/j.envpol.2019.113631 |
| [51] | Chen Y L, Li H C, Karimian H, et al. Spatio-temporal variation of ozone pollution risk and its influencing factors in China based on Geodetector and Geospatial models[J]. Chemosphere, 2022, 302. DOI:10.1016/j.chemosphere.2022.134843 |
| [52] |
闫慧, 张维, 侯墨, 等. 我国地级及以上城市臭氧污染来源及控制区划分[J]. 环境科学, 2020, 41(12): 5215-5224. Yan H, Zhang W, Hou M, et al. Sources and control area division of ozone pollution in cities at prefecture level and above in China[J]. Environmental Science, 2020, 41(12): 5215-5224. |
| [53] | Chou Y, Huang Q, Zhang Y P, et al. Impacts of deep boundary layer on near-surface ozone concentration over the Tibetan Plateau[J]. Atmospheric Environment, 2023, 294. DOI:10.1016/j.atmosenv.2022.119532 |