 2023, Vol. 44

 , LU Hai-jian , LÜ Jia-pei , YANG Jiang-tao , LUO Ying , CAO Miao , SUN Shan-wei , GUO Chang-sheng , XU Jian
21世纪初, 溴系阻燃剂(brominated flame retardants, BFRs)的某些种类因其持久性、生物积累性和高毒性在世界范围内被限制或禁止使用[1].作为BFRs的主要替代产品, 有机磷酸酯(organophosphate esters, OPEs)具有良好物理化学性能和优异阻燃效果, 已在世界范围内大量使用[2].2013年, 全球OPEs的使用量达到62万t[3], 我国OPEs的年排放量从2014年的约670 t·a-1增长到2018年的1 000 t·a-1[4].OPEs被广泛用作塑料[5]、纺织品[6]、家具[7]和建筑(如室内装潢)材料[8]的添加剂, 其易通过挥发、浸出和产品使用磨损等过程释放进入环境[9].目前OPEs已在污水[10]、地表水[11]、饮用水[12]、沉积物[13]、降雪[14]、室内外空气和灰尘[15], 甚至母乳、毛发和血液中均有检出[16], 并表现出环境持久性、长距离迁移性和生物可利用性, 对人体健康产生潜在威胁.OPEs种类繁多且来源复杂, 化合物之间性质差异大, 目前关注较多的包括烷基类、卤代类和芳香类OPEs[17].当前的研究多针对在局部区域OPEs的污染水平和分布特征进行分析, 对OPEs在全国范围, 尤其是典型流域水体中污染特征、人体健康风险及水生生态风险的了解还不充分.
我国幅员辽阔, 河流众多, 流域分布面积广, 根据主要河流覆盖区域可划分为松辽、海河、黄河、淮河、太湖、长江和珠江这七大流域[18].OPEs的污染与地区生产生活、自然地理和经济发展等有密切联系.本研究结合课题组前期研究成果, 同时检索了近12年的相关研究, 系统地分析和总结了我国七大典型流域水体中OPEs的污染水平和特征.基于美国环保署(US EPA)推荐的风险评估方法, 对人体健康风险进行评估, 并通过蒙特卡洛模拟方法评价了结果的可靠性.通过构建物种敏感度分布(SSD)曲线对其生态风险进行评估, 以期为我国水环境中OPEs的环境管理提供理论依据.
1 材料与方法 1.1 数据收集以中英文检索词“有机磷酸酯”、“中国”和“河流”检索Web of Science、Science Direct、中国知网和中国学位论文全文数据库等数据库, 共检索出939篇文献, 其中英文787篇, 中文152篇.经筛选, 获得发表于2011年6月至2022年6月的文献共33篇, 覆盖中国七大流域主要河流、湖泊和水库中25种OPEs的检测数据1 474条.涉及的25种OPEs化合物有12种烷基磷酸酯, 6种卤代磷酸酯和7种芳香基磷酸酯, 其名称和理化性质如表 1所示.
|
|
表 1 25种OPEs化合物名称及理化性质1) Table 1 Name and physicochemical properties of 25 OPEs |
七大流域的1 474条数据中, 松辽流域94条、海河流域215条、黄河流域98条、淮河流域71条、太湖流域188条、长江流域634条和珠江流域174条.依照风险评估最大化原则, 原始数据小于检测限(limit of detection, LOD) 的以其1/2 LOD计入统计分析[19].
1.2 健康风险评估方法文献检索出的部分OPEs未存在于所有流域, 为了保证评估结果的准确性, 以检索结果存在于5个及5个以上流域为筛选原则, 共筛选出常见的12种OPEs进行风险评估.包括7种烷烃取代基磷酸酯, TMP、TEP、TPrP、TiBP、TBEP、TEHP和TnBP, 3种氯代磷酸酯, TCEP、TCPP和TDCP, 2种芳香基磷酸酯, TPhP和CDPP.
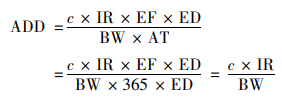
本研究采用US EPA推荐的健康风险评价模型, 评价OPEs对人群的健康风险.水中OPEs经口摄入途径的暴露量, 使用公式(1)计算:
|
(1) |
式中, ADD为日均暴露量, ng·(kg·d)-1; c为污染物浓度, ng·L-1; IR为日均饮水摄入量, L·d-1; EF为饮水暴露频率, d·a-1, 取值均为365 d·a-1 [20]; ED为饮水暴露周期, a; BW为体重, kg; AT为终身饮水暴露时间, d.对于非致癌效应为ED对应的天数, 对于致癌效应固定为25 550, 即70 a对应的天数[21].在计算全国饮用水水中OPEs的暴露剂量和健康风险时, 不同人群所参考的参数存在差异, 模型中所用参数参见表 2, 研究采取的人群参数值参照中国人群暴露参数手册[22~24].
|
|
表 2 不同人群饮水暴露的风险评估参数值1) Table 2 Parameters of daily intake via drinking water |
采用场景风险评估(scenario-based risk assessment, SceBRA)模式估算通过饮用水接触OPEs的污染物ADD[25].通过计算化合物浓度位置的第5百分位(P5, 最优情景)、第50百分位(P50, 一般情景)和第95百分位(P95, 最差情景)浓度作为风险评估基础参数, 分别定义为低等暴露水平(low exposure scenario, LES)、中等暴露水平(intermediate exposure scenario, IES)和高等暴露水平(high exposure scenario, HES)[26].基于SceBRA模式, 计算分析低、中、高不同暴露水平下OPEs的日均暴露量.
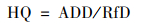
非致癌风险使用HQ(hazard quotient)表征, 经口摄入途径的HQ, 使用公式(2)计算:
|
(2) |
式中, HQ为危害商; ADD是日均暴露量, ng·(kg·d)-1; RfD为参考剂量, ng·(kg·d)-1, 见表 3.当HQ≥1时, 有非致癌风险; HQ<1时, 认为无非致癌风险.
|
|
表 3 RfD和SF的值1) Table 3 Values of RfD and SF |
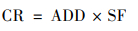
致癌风险使用CR[14]表征, 经口摄入途径的CR, 使用公式(3)计算:
|
(3) |
式中, CR为致癌风险; ADD为日均暴露量, ng·(kg·d)-1; SF为斜率因子, (kg·d)·ng-1, 见表 3; 当CR≥1×10⁻⁶时, 有致癌风险; CR<1×10⁻⁶时, 认为无致癌风险.RfD和SF的参数值通过文献[27, 28]获得.
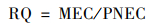
1.3 生态风险评估方法OPEs的生态风险根据欧盟委员会风险评估技术指导文件中的污染最严重情景进行评估[28].采用风险商(risk quotient, RQ)对地表水中OPEs的生态风险进行评估, RQ≥1, 表示生态风险较高, 0.10≤RQ<1表示中等生态风险, RQ<0.1, 表示生态风险较低.计算公式如下:
|
(4) |
式中, MEC为水中OPEs污染物的实测浓度, ng·L-1; PNEC为预测的OPEs污染物无效应浓度, ng·L-1.
12种OPEs的毒性数据从现有毒性数据库(例如ECOTOX数据库)收集, 数据筛选时遵循准确性、相关性和可靠性原则[29].选择测量终点是半数致死浓度(LC50)或半数抑制浓度(EC50)的毒性数据为急性毒性数据.对于慢性毒性数据, 选择测试终点为无观察效应浓度(NOEC)的毒性数值.当NOEC数据不足时, 使用最低效应浓度(LOEC)或ECxx、LCxx值(如EC20、EC10和LC20).同一物种在同一终点有多个值的情况下, 计算几何平均值.SSD曲线一般是根据NOEC转化的对数累积分布或基于急性数据LC50对数正态函数得到的[30].当以获得PNEC为研究目的时, 用NOEC来计算HC5(假定特定生态系统中5%的物种受到压力的危险浓度)数值的生态意义更为明确[31].本文用慢性毒性数据模拟SSD曲线, 通过EEC-SSD软件包得出HC5值, 最终的PNEC由HC5通过计算得出, 公式如下:
|
(5) |
式中, HC5为假定特定(生态)系统中5%的物种受到压力的危险浓度值, mg·L-1; SF为安全因子, 取保守估计值5[31].
由于在12种OPEs中, 只有TnBP和TPhP的慢性毒性数据可以满足构建SSD曲线最低条件, 因此剩余10种OPEs的PNEC选择最敏感物种的急性毒性数据与AF(AF=1 000)相比[32]得出, 计算公式如下:
|
(6) |
式中, L(E)C50为供试生物的半数致死(效应)浓度; AF为评价因子, 根据欧盟水框架指令, AF取1 000[27].
1.4 蒙特卡洛模拟方法本研究在计算健康风险时使用了全国范围内的污染物浓度数据, 考虑到OPEs浓度和其他评估因素的可变性, 为克服评价过程的不确定性, 引入蒙特卡洛模拟以避免高估或低估健康风险[33].使用Oracle Crystal Ball的蒙特卡洛模拟对OPEs的健康风险进行不确定性和敏感性分析[34].用于通过饮水暴露途径计算ADD的输入参数如表 2所示, 并随机模拟了10 000次, 得出计算结果, 估计了中等暴露水平下儿童的健康风险值.
2 结果与讨论 2.1 中国七大流域中OPEs污染现状由图 1可知(


|
图 1 中国典型流域OPEs的浓度水平 Fig. 1 OPEs concentrations in typical river basins in China |
在低等暴露水平(P5)下, 松辽流域的


高等暴露水平(P95)下, 七大流域整体


为分析OPEs浓度分布与人类活动的关系, 收集了各个河流湖库所流经城市的社会经济发展的相关参数.收集的参数包括国内生产总值(GDP)、人均GDP、人口、人口密度、土地面积、城镇化率和第三产业增加值.以上数据均来源于益阳、长沙和岳阳等城市统计局.
根据社会经济因素, 采用聚类分析方法对城市社会经济发展的相关参数进行识别.将城市分为6类, 结果如图 2.北京、上海和广州分别被划分为第1类、第2类和第3类. 其余城市被划分为第4类、第5类和第6类.第1类、第2类和第3类的城市综合城市实力强于第4类、第5类和第6类.这一分类与这些地区的社会发展状况相一致.

|
图 2 城市聚类分析 Fig. 2 City cluster analysis diagram |
通过一元线性回归分析可知, OPEs浓度分布与GDP之间存在显著正相关关系(如图 3).说明人类活动对各流域OPEs污染的影响很大, 经济社会发展水平越高, OPEs的污染越严重[42].

|
图 3 一元线性回归分析 Fig. 3 Unitary linear regression analysis |
统计了七大流域的平均降水量和平均气温, 数据分别来自水利部松辽水利委员会、水利部黄河水利委员会、水利部海河水利委员会、水利部淮河水利委员会、长江水利委员会水文局、水利部太湖流域管理局和水利部珠江水利委员会.综合七大流域平均降水量和平均气温绘制图 4.从图可知, 除松辽流域外, 各个流域的降水量和气温的变化趋势相同.从

|
图 4 七大流域气候条件 Fig. 4 Climatic conditions of seven river basins |
筛选出用于风险评估的12种OPEs的浓度水平如图 5所示, 根据浓度值计算出中、高等暴露水平下我国居民饮水的


|
图 5 12种OPEs的浓度水平 Fig. 5 Concentrations of 12 OPEs |
|
|
表 4 中国居民通过饮用水摄入OPEs的暴露量、非致癌风险商和致癌风险 Table 4 Daily exposure, hazard quotient, and carcinogenic risk of OPEs in Chinese people through intake drinking water |

本研究统计了我国不同人群通过饮用水摄入OPEs在中等暴露水平和高等暴露水平的非致癌风险.我国居民摄入OPEs的HQ值(9×10⁻⁶~1.11×10⁻²)远小于1, 因此可以认为七大流域中OPEs通过饮水方式暴露对不同人群不具有非致癌风险.OPEs单体风险商值按以下顺序递减: TCEP>TCPP>TnBP>TMP>TDCP>TEP>TBEP>THEP>TPhP.
由于缺乏SF值, 本研究对TMP、TiBP、TEHP、TnBP、TCEP和TDCP这6种单体OPEs进行致癌风险评估.结果表明, 这6种单体在中等暴露水平下对不同人群的致癌风险(1.72×10⁻¹⁰~2.05×10⁻⁷)均在可接受范围内.但在高等暴露水平下, TMP(1.22×10⁻⁶)和TiBP(1.03×10⁻⁶)对儿童有潜在的致癌风险.TCEP对儿童、青少年和成人皆有潜在致癌风险, CR分别为2.54×10⁻⁶、1.56×10⁻⁶和2.04×10⁻⁶.因此, TMP、TiBP和TCEP是致癌风险的主要贡献者.
2.3 七大流域OPEs的生态风险评价运用EEC-SSD软件模拟出TnBP和TPhP的SSD曲线, 并得出HC5值分别为0.283 mg·L-1和0.000 505 mg·L-1.12种OPEs的生态风险评估结果如表 5所示.TCEP在高等暴露水平下, 风险商为0.239, 大于0.1, 存在中等生态风险.在中等暴露水平下, TnBP的风险商为0.346, 存在中等生态风险, 而在高等暴露水平下, 其风险商为6.78, 有较高生态风险.TPhP在低中高3种暴露水平下的风险商均大于1, 有较高生态风险, 需要重点关注.剩余9种OPEs在低中高3种暴露水平下的风险商分别为1.43×10⁻⁹~7.7×10⁻²、2.05×10⁻⁶~4.38×10⁻²和2.05×10⁻⁵~6.67×10⁻², 均远低于0.1, 生态风险较低.
|
|
表 5 11种OPEs的生态风险评价结果 Table 5 Ecological risk assessment results of 11 types of OPEs |
2.4 蒙特卡洛模拟和敏感性分析
通过蒙特卡洛模拟评估的儿童


|
图 6 中等暴露水平模拟的儿童饮水的    |
此外, 进行敏感性分析以阐明不同因素对健康风险的贡献, 如图 7所示. 在中等暴露水平下, IR(39.5%) 和污染物浓度(21.4%) 的增加, 是增加水中OPEs对儿童


|
图 7 中等暴露水平模拟的儿童饮水总非致癌风险和总致癌风险敏感度 Fig. 7 Sensitivity of simulated total target hazard quotient(HQ) and carcinogenic risk(CR) of children via drinking water under the intermediate-exposure scenario |
(1) 本文研究了我国七大流域OPEs的浓度水平和分布特征.在低等暴露水平下, 松辽流域的


(2) 中等暴露水平下, 不同人群通过饮用水暴露于OPEs的非致癌风险均在可接受范围内.而在高等暴露水平下, TMP和TiBP对儿童有潜在的致癌风险, TCEP对儿童、青少年和成人皆有潜在致癌风险.
(3) 生态风险评估结果表明, TCEP在高等暴露水平下, 存在中等生态风险.TnBP在中等暴露水平下存在中等生态风险, 在高等暴露水平下有较高生态风险.TPhP在低、中、高这3种暴露水平下的风险商均大于1, 有较高生态风险, 需要重点关注.
(4) 通过蒙特卡洛模拟中等暴露水平下儿童总的非致癌和致癌风险, 计算值与蒙特卡洛模拟值的相对偏差结果均在可接受水平.
| [1] |
刘丽娅, 印红玲, 蹇林洁, 等. 青藏高原东缘冻土中有机磷酸酯的污染特征[J]. 环境科学, 2021, 42(7): 3549-3554. Liu L Y, Yin H L, Jian L J, et al. Pollution characteristics of organophosphate esters in frozen soil on the eastern edge of Qinghai-Tibet plateau[J]. Environmental Science, 2021, 42(7): 3549-3554. |
| [2] |
张月. 国内外阻燃剂市场分析[J]. 精细与专用化学品, 2014, 22(8): 20-24. Zhang Y. Global market analysis of flame retardant[J]. Fine and Specialty Chemicals, 2014, 22(8): 20-24. |
| [3] | Lai N L S, Kwok K Y, Wang X H, et al. Assessment of organophosphorus flame retardants and plasticizers in aquatic environments of China(Pearl River Delta, South China Sea, Yellow River Estuary) and Japan(Tokyo Bay)[J]. Journal of Hazardous Materials, 2019, 371: 288-294. DOI:10.1016/j.jhazmat.2019.03.029 |
| [4] | He J, Wang Z X, Zhao L Y, et al. Gridded emission inventory of organophosphorus flame retardants in China and inventory validation[J]. Environmental Pollution, 2021, 290. DOI:10.1016/j.envpol.2021.118071 |
| [5] | Schmidt N, Castro-Jiménez J, Fauvelle V, et al. Occurrence of organic plastic additives in surface waters of the Rhone River(France)[J]. Environmental Pollution, 2020, 257. DOI:10.1016/j.envpol.2019.113637 |
| [6] | Zhu H K, Al-Bazi M M, Kumosani T A, et al. Occurrence and profiles of organophosphate esters in infant clothing and raw textiles collected from the United States[J]. Environmental Science & Technology Letters, 2020, 7(6): 415-420. |
| [7] | Rodgers K M, Bennett D, Moran R, et al. Do flame retardant concentrations change in dust after older upholstered furniture is replaced?[J]. Environment International, 2021, 153. DOI:10.1016/j.envint.2021.106513 |
| [8] |
薛倩倩, 魏扬, 田瑛泽, 等. 2019—2020年天津市津南区多环芳烃和有机磷阻燃剂气固分配特征及健康风险评价[J]. 环境科学研究, 2022, 35(1): 30-39. Xue Q Q, Wei Y, Tian Y Z, et al. Characteristics, gas-particle partitioning, and health risks of PM2.5-bound PAHs and OPEs from 2019 to 2020 in Jinnan District, Tianjin[J]. Research of Environmental Sciences, 2022, 35(1): 30-39. |
| [9] | Wang X L, Zhu L Y, Zhong W J, et al. Partition and source identification of organophosphate esters in the water and sediment of Taihu Lake, China[J]. Journal of Hazardous Materials, 2018, 360: 43-50. DOI:10.1016/j.jhazmat.2018.07.082 |
| [10] | Xu L, Hu Q P, Liu J, et al. Occurrence of organophosphate esters and their diesters degradation products in industrial wastewater treatment plants in China: implication for the usage and potential degradation during production processing[J]. Environmental Pollution, 2019, 250: 559-566. DOI:10.1016/j.envpol.2019.04.058 |
| [11] | Fries E, Püttmann W. Monitoring of the three organophosphate esters TBP, TCEP and TBEP in river water and ground water(Oder, Germany)[J]. Journal of Environmental Monitoring, 2003, 5(2): 346-352. DOI:10.1039/b210342g |
| [12] | Stackelberg P E, Furlong E T, Meyer M T, et al. Persistence of pharmaceutical compounds and other organic wastewater contaminants in a conventional drinking-water-treatment plant[J]. Science of the Total Environment, 2006, 354(1): 93-97. DOI:10.1016/j.scitotenv.2005.04.012 |
| [13] | García-López M, Rodríguez I, Cela R. Development of a dispersive liquid-liquid microextraction method for organophosphorus flame retardants and plasticizers determination in water samples[J]. Journal of Chromatography A, 2007, 1166(1-2): 9-15. DOI:10.1016/j.chroma.2007.08.006 |
| [14] | Regnery J, Püttmann W. Organophosphorus flame retardants and plasticizers in rain and snow from middle Germany[J]. CLEAN, 2009, 37(4-5): 334-342. |
| [15] | Quintana J B, Rodil R, López-Mahía P, et al. Optimisation of a selective method for the determination of organophosphorous triesters in outdoor particulate samples by pressurised liquid extraction and large-volume injection gas chromatography-positive chemical ionisation-tandem mass spectrometry[J]. Analytical and Bioanalytical Chemistry, 2007, 388(5-6): 1283-1293. DOI:10.1007/s00216-007-1338-4 |
| [16] | Marklund A, Andersson B, Haglund P. Traffic as a source of organophosphorus flame retardants and plasticizers in snow[J]. Environmental Science & Technology, 2005, 39(10): 3555-3562. |
| [17] |
何明靖, 杨志豪, 魏世强. 5种典型有机磷酸酯在水-土壤界面吸附特征及影响因素[J]. 环境科学, 2019, 40(10): 4604-4610. He M J, Yang Z H, Wei S Q, et al. Absorption characterization and the identification of factors influencing five organophosphate esters in water-soil system[J]. Environmental Science, 2019, 40(10): 4604-4610. |
| [18] |
王鑫璇, 张鸿, 王艳萍, 等. 中国七大流域全氟烷基酸污染水平与饮水暴露风险[J]. 环境科学, 2018, 39(2): 703-710. Wang X X, Zhang H, Wang Y P, et al. Contamination levels and exposure risk via drinking water from perfluoroalkyl acids in seven major drainage basins of China[J]. Environmental Science, 2018, 39(2): 703-710. |
| [19] |
刘殿甲, 吴宇峰, 张静, 等. 直接进样-LC-MS/MS测定水中16种有机磷酸酯类化合物[J]. 环境化学, 2023, 42(4): 1165-1175. Liu D J, Wu Y F, Zhang J, et al. Simultaneous determination of 16 organophosphates in waters by direct injection LC-MS/MS[J]. Environmental Chemistry, 2023, 42(4): 1165-1175. |
| [20] |
李旭, 刘杨, 吕佳佩, 等. 某城区降雪中OPEs污染特征与风险评估[J]. 中国环境监测, 2021, 37(6): 136-146. Li X, Liu Y, Lyu J P, et al. Pollution characteristics and risk assessment of organophosphate esters in snow of an urban area[J]. Environmental Monitoring in China, 2021, 37(6): 136-146. |
| [21] | WS/T 777-2021, 化学物质环境健康风险评估技术指南[S]. |
| [22] | 环境保护部. 中国人群暴露参数手册(成人卷)[M]. 北京: 中国环境出版社, 2013. |
| [23] | 环境保护部. 中国人群暴露参数手册(儿童卷: 0~5岁)[M]. 北京: 中国环境出版社, 2016. |
| [24] | 环境保护部. 中国人群暴露参数手册(儿童卷: 6~17岁)[M]. 北京: 中国环境出版社, 2016. |
| [25] |
彭碧霞, 洪文俊, 李方方, 等. 浙江杭嘉湖地区水环境中全氟烷基化合物的污染特征及健康风险评估[J]. 环境化学, 2021, 40(10): 3001-3014. Peng B X, Hong W J, Li F F, et al. Distribution characteristics and health risk assessment of perfluoroalkyl substances in aquatic environment of Hangzhou-Jiaxing-Huzhou region in Zhejiang Province[J]. Environmental Chemistry, 2021, 40(10): 3001-3014. |
| [26] | Gebbink W A, Berger U, Cousins I T. Estimating human exposure to PFOS isomers and PFCA homologues: the relative importance of direct and indirect(precursor) exposure[J]. Environment International, 2015, 74: 160-169. |
| [27] | Lv J P, Guo C S, Luo Y, et al. Spatial distribution, receptor modelling and risk assessment of organophosphate esters in surface water from the largest freshwater lake in China[J]. Ecotoxicology and Environmental Safety, 2022, 238. DOI:10.1016/j.ecoenv.2022.113618 |
| [28] | Lian M S, Lin C Y, Li Y, et al. Distribution, partitioning, and health risk assessment of organophosphate esters in a major tributary of middle Yangtze River using Monte Carlo simulation[J]. Water Research, 2022, 219. DOI:10.1016/j.watres.2022.118559 |
| [29] | Caldwell D J, Mastrocco F, Hutchinson T H, et al. Derivation of an aquatic predicted no-effect concentration for the synthetic hormone, 17α-ethinyl estradiol[J]. Environmental Science & Technology, 2008, 42(19): 7046-7054. |
| [30] |
邢立群, 郑新梅, 刘红玲, 等. 中国主要河流中硝基苯生态风险研究[J]. 中国环境科学, 2011, 31(2): 301-306. Xing L Q, Zheng X M, Liu H L, et al. Ecological risk assessment of nitrobenzene in main rivers of China[J]. China Environmental Science, 2011, 31(2): 301-306. |
| [31] | Pennington D W. Extrapolating ecotoxicological measures from small data sets[J]. Ecotoxicology and Environmental Safety, 2003, 56(2): 238-250. |
| [32] |
罗莹, 刘娜, 孙善伟, 等. 我国地表水中典型DBPs的暴露水平及生态风险[J]. 中国环境科学, 2021, 41(4): 1806-1814. Luo Y, Liu N, Sun S W, et al. Occurrence and ecological risk of typical DBPs in Chinese surface water[J]. China Environmental Science, 2021, 41(4): 1806-1814. |
| [33] | Jafarzadeh N, Heidari K, Meshkinian A, et al. Non-carcinogenic risk assessment of exposure to heavy metals in underground water resources in Saraven, Iran: spatial distribution, monte-carlo simulation, sensitive analysis[J]. Environmental Research, 2022, 204. DOI:10.1016/j.envres.2021.112002 |
| [34] | Huang J L, Wu Y Y, Sun J X, et al. Health risk assessment of heavy metal(loid)s in park soils of the largest megacity in China by using Monte Carlo simulation coupled with Positive matrix factorization model[J]. Journal of Hazardous Materials, 2021, 415. DOI:10.1016/j.jhazmat.2021.125629 |
| [35] | Martínez-Carballo E, González-Barreiro C, Sitka A, et al. Determination of selected organophosphate esters in the aquatic environment of Austria[J]. Science of the Total Environment, 2007, 388(1-3): 290-299. |
| [36] |
吴计生, 吕军, 刘洪超, 等. 松辽流域河湖健康评估实践与启示[J]. 中国水利, 2022(7): 74-76, 81. Wu J S, Lyu J, Liu H C, et al. Practice and enlightenment of rivers and lakes health assessment in the Songliao River Basin[J]. China Water Resources, 2022(7): 74-76, 81. |
| [37] |
王博, 杨志强, 李慧颖, 等. 基于模糊数学和GIS的松花江流域水环境质量评价研究[J]. 环境科学研究, 2008, 21(6): 124-129. Wang B, Yang Z Q, Li H Y, et al. Identification of the Songhua River water quality using fuzzy synthetic evaluation and GIS approach[J]. Research of Environmental Sciences, 2008, 21(6): 124-129. |
| [38] |
张弛, 王明君, 于冰, 等. 松辽流域水资源综合调控研究进展与四大难题探究[J]. 水利学报, 2021, 52(11): 1379-1388. Zhang C, Wang M J, Yu B, et al. Research progress of comprehensive water resources regulation and four major problems in Song-Liao River Basin[J]. Journal of Hydraulic Engineering, 2021, 52(11): 1379-1388. |
| [39] |
蔡梅, 陆志华, 王元元, 等. 太湖不同介质中磷的污染特征及其治理启示[J]. 环境科学, 2022, 43(5): 2575-2585. Cai M, Lu Z H, Wang Y Y, et al. Pollution characteristics of phosphorus in different media in taihu lake and its treatment enlightenment[J]. Environmental Science, 2022, 43(5): 2575-2585. |
| [40] | 唐国平, 陈德超, 周涛, 等. 丹金溧漕河(溧阳段)水质特征分析[J]. 农村经济与科技, 2016, 27(6): 1-2. |
| [41] | Xing L Q, Tao M, Zhang Q, et al. Occurrence, spatial distribution and risk assessment of organophosphate esters in surface water from the lower Yangtze River Basin[J]. Science of the Total Environment, 2020, 734. DOI:10.1016/j.scitotenv.2020.139380 |
| [42] | Wu Q Q, Liu S G, Chen P, et al. Microplastics in seawater and two sides of the Taiwan Strait: Reflection of the social-economic development[J]. Marine Pollution Bulletin, 2021, 169. DOI:10.1016/j.marpolbul.2021.112588 |
| [43] | Knouft J H, Ficklin D L. The potential impacts of climate change on biodiversity in flowing freshwater systems[J]. Annual Review of Ecology, Evolution, and Systematics, 2017, 48: 111-133. |
| [44] | Chen M, Jin X W, Liu Y, et al. Human activities induce potential aquatic threats of micropollutants in Danjiangkou Reservoir, the largest artificial freshwater lake in Asia[J]. Science of the Total Environment, 2022, 850. DOI:10.1016/j.scitotenv.2022.157843 |
| [45] | Edmonds C J, Burford D. Should children drink more water?: the effects of drinking water on cognition in children[J]. Appetite, 2009, 52(3): 776-779. |