 2023, Vol. 44

2. 齐鲁工业大学环境科学与工程学院, 济南 250353
 , SUN Jun1 , GUO Meng-meng1 , LIU Yang1 , WANG Bao-lin2 , FAN Guo-lan1 , XU Hong-yu1 , JIANG Teng-long1
2. School of Environmental Science and Engineering, Qilu University of Technology, Jinan 250353, China
近地面臭氧(O3)是由挥发性有机物(volatile organic compounds, VOCs)和氮氧化物(NOx)等前体物在太阳辐射作用下发生光化学反应生成[1].它不仅是重要的氧化剂和温室气体, 还是全球性主要大气污染物之一, 可对区域空气质量、人体健康、生态系统及全球气候变化造成重要的影响[1~4].近年来我国O3污染问题凸显, O3已成为影响城市空气质量主要的大气污染物之一[5~8], 监测数据显示我国2020年O3日最大8 h滑动平均值(daily maximum 8 h average, MDA8)的第90百分位数(即O3年评价浓度, 下同)比2015年上升了6.1%, 年均增长1.6 μg·m-3, 以O3为首要污染物的超标天数占总超标天数的37.1%, 比2015年上升20.2个百分点[5].在区域尺度上, 全国O3污染程度和范围在不断扩大[9~11].此外, 臭氧监测仪(ozone monitoring instrument, OMI)卫星数据同样证明了我国O3污染加重的趋势[12, 13].因此近地面O3污染问题已成为当前的研究热点, 了解城市与区域O3及其前体物浓度的长期变化趋势是评估已有大气污染治理措施的重要途径, 同时也能为未来制定环境空气质量管控策略提供参考.
O3污染的变化趋势受到前体物排放、气象条件和化学反应等方面因素的共同作用, 国内外学者对我国O3污染加剧及其驱动因素进行了广泛而深入的研究[5, 9, 11, 13~25].背景O3变化被认为是潜在的驱动因素, Xu等[19]在全球背景站瓦里关观测发现1997~2016年间O3的年增长率为0.33×10⁻⁹ a-1, 但是远远低于华北污染地区的增长率.此外, 年际间的气象波动也在O3变化中起着重要的作用, 相关研究认为近年来华北地区气象变化促进了O3浓度上升, Dang等[21]研究称在2012~2017年夏季, 京津冀地区MDA8 O3年增长率为0.58×10⁻⁹ a-1, 其中气象因素占48.3%.而余益军等[15]研究发现2013~2018年京津冀13个城市O3浓度升高受气象条件影响不大(贡献率均值约为9.6%), 主要由大气污染排放变化造成的.Sun等[23]在对我国中东部2003~2015年O3浓度变化影响因素研究中发现, 前体物排放的增加导致区域O3升高, 比气象因素变化的贡献更大, 且在华北地区更为明显.有研究表明, 近年来人为源排放的变化是导致华北平原、长三角和珠三角城市群的近地面O3水平上升的主要原因.Liu等[25]研究发现, 2013~2017年我国城市地区NOx和VOCs排放的变化导致夏季MDA8 O3增加了约0.7×10⁻⁹.Wang等[18]和Xiang等[26]分别在2012~2016年和2015~2017年O3浓度上升的现状下, 通过模拟发现今后VOCs的减排力度要远大于NOx, 前者认为VOCs/NOx的减排比例至少大于2 ∶1, 后者认为VOCs排放减少60%, NOx减排20%, 才能抑制O3浓度上升的趋势.
上述关于我国近期O3变化及其驱动因素的研究大多是从全国或区域尺度上进行的, 当前仍缺乏关于具体城市的研究.济南市作为京津冀大气污染传输通道的重要城市, 近年来随着大气污染防治工作的推进, 环境空气质量明显改善, SO2、NO2和PM2.5等污染物浓度持续下降, 然而与此同时, 近地面O3污染问题日益突出[27].目前有关济南市O3污染研究主要集中于短时间尺度、个别站点的污染特征及成因方面[27~29], 对于O3污染长期变化趋势的研究涉及较少, 全面和准确评价近年来济南市O3时空分布及其变化趋势显得十分迫切.本文基于2015~2020年济南市环境空气质量站点监测数据, 利用多种统计方法, 分析O3污染的变化趋势及时空分布, 并根据OMI卫星遥感数据研究对流层NO2和甲醛(HCHO)垂直柱浓度推断济南市大气中NOx和VOCs排放以及O3-NOx-VOCs敏感性的变化, 以期为当地O3污染防治提供科学支撑, 研究结果对制定准确有效的O3污染防治策略具有重要意义.
1 材料与方法 1.1 数据来源济南市为山东省省会城市, 地处华北平原东南部边缘, 目前已建立较为完善的环境空气质量自动监测网络.2019年1月原济南市、莱芜市完成行政区划调整, 在本研究中, 为保证研究的连续性和可比性, 选取原济南市31个监测站点以评价城市环境和区域背景污染水平, 包括11个国控站点和20个非国控站点, 所选站点的空间分布见图 1.本研究时间为2015年1月1日至2020年12月31日, 所测站点O3、NO2和CO等污染物小时数据来源于济南市环境空气自动监测系统(http://124.128.84.34:8900/), 各污染物浓度单位为μg·m-3(CO浓度单位为mg·m-3), 并统一到标准状态(273.15 K, 1 013.25 hPa), 使数据具有可比性.为了确保研究数据有效性和可靠性, 在进行数据分析之前对获取的污染物小时浓度数据按照《环境空气质量标准》(GB 3095-2012)和《环境空气质量评价技术规范(试行)》(HJ 663-2013)进行了严格的数据质量控制以便去除异常数据.

|
图 1 济南市空气监测站点示意 Fig. 1 Distribution of air quality monitoring stations in Jinan |
目前OMI卫星产品中HCHO和NO2应用较为广泛, 其空间分辨率较高, 可提供大范围且长时期的数据, 分别作为VOCs和NOx的指示剂[8, 13, 17, 30].本研究中2015~2020年4~9月对流层NO2和HCHO垂直柱浓度月均网格数据来源于OMI卫星反演的3级产品, 来自QA4ECV项目(http://www.qa4ecv.eu/)[13].NO2和HCHO的空间分辨率分别为0.125°×0.125°和0.05°×0.05°.
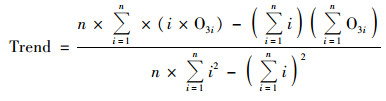
1.2 分析方法趋势分析通常用于大气污染物的时间动态分析, 以探索污染物的年际变化特征[16, 31].本文基于趋势分析方法分析了2015~2020年济南市O3浓度增长速率, 具体计算公式如下:
|
(1) |
式中, Trend为O3浓度变化趋势, n为时间跨度, 此处n为6; i为时间年份, O3i为第i年的O3浓度.以时间为横轴, 对O3时间序列数据进行一元线性回归, 得到反映O3浓度变化趋势的斜率.理论上, 如果变量平稳变化, 则该斜率很可能与变化率相似, 可以反映该组数据的变化趋势.斜率的显著正值表明O3浓度有增长趋势, 而斜率的显著负值则反映了相反的趋势.同时为探究趋势变化是否具有显著性意义, 运用Mann-Kendall非参数统计方法来进行检验, 该方法能有效区分某一自然过程是处于自然波动还是存在确定的变化趋势以及趋势的统计学显著性意义[8, 16, 17].本文的统计方法见文献[31~34].采用双侧检验, 当检验统计量的绝对值≥1.96时, 表示通过了置信度95%的检验, 具有高置信水平.
1.3 O3生成敏感性分析对流层O3的化学生成机制非常复杂, 与前体物NOx和VOCs的关系呈非线性[1], 研究O3的生成敏感性是科学制定污染减排策略的科学基础, 目前常用光化学指示剂法和基于观测的OBM(observation-based model)等诊断臭氧生成敏感性[13, 35].臭氧产生效率(ozone production efficiency; OPE=ΔO3/ΔNOz)和H2 O2/NOz(或H2 O2/HNO3)被认为是具有普适性的指标, 但在区域层面实际监测数据难于获取[1, 35~37].OBM模型结合实际观测数据和化学模拟, 可用于诊断臭氧的原位(in-situ)生成机制和生成率, 然而受到时间周期和空间范围上的限制[1].近年来随着卫星遥感技术的发展, 基于卫星遥感的对流层柱浓度HCHO/NO2值被用来判断O3生成敏感区的指标, 这种方法具有时间、空间连续性的优点, 且受人为干扰因素小, 并被广泛使用[13, 30].
|
(2) |
式中, c(HCHO)为HCHO柱浓度; c(NO2)为NO2柱浓度; FNR为二者比值.本研究中获取2015~2020年间4~9月济南市网格化NO2和HCHO月均产品, 为实现不同分辨率的数据匹配, 将0.05°分辨率的HCHO数据重采样到0.125°, 并计算逐网格FNR, 然后取所有网格的平均值.
最早在Duncan等[38]的研究中, FNR小于1表示O3受VOCs控制, FNR大于2表示O3受NOx控制, 在1和2之间时, O3受VOCs-NOx协同控制.然而Wang等[13]和Jin等[39, 40]研究指出, 我国大气中气溶胶浓度较高, O3生成敏感性协同控制区FNR阈值在2.3~4.2之间, 小于2.3为VOCs控制区, 大于4.2为NOx控制区, 此外不同的污染排放特征可能影响确定O3生成敏感性所需的FNR阈值[13].本研究中当FNR<2时, O3生成受VOCs控制.
2 结果与讨论 2.1 O3污染的时间变化趋势图 2显示2015~2020年济南市全年MDA8 O3浓度的第10、25、50、75和90百分位数以及最大值的变化趋势.年际间MDA8 O3浓度的各百分位数呈现不同幅度的上升趋势, 高值浓度的上升幅度大于低值浓度.MDA8 O3浓度的第10、25和50百分位数年均分别上升2.7 μg·m-3(P<0.01)、3.7 μg·m-3(P<0.01)和4.4 μg·m-3(P<0.05), 上升趋势显著, 并具有统计意义.O3年评价浓度从2015年的188 μg·m-3升高至2019年的219 μg·m-3, 然后下降至2020年的204 μg·m-3, 6a总体上升了8.5%, 年均升高4.8 μg·m-3.全国重点区域中, 京津冀及周边地区O3污染最为严重且浓度上升幅度最大, 2020年O3年评价浓度较2015年上升10.4%, 汾渭平原、苏皖鲁豫交界和长三角分别上升10.3%、5.8%和5.6%[5], 而北京市O3年评价浓度在2014~2020年间以0.7 μg·(m3·a)-1的幅度呈波动下降的趋势[32]. 在O3污染超标天数方面, 2020年济南市O3污染超标[《环境空气质量标准》(GB 3095-2012)中二级标准限值为160 μg·m-3]天数占全年总天数的25.9%, 比2015年上升了16.7%.2019年由于8~9月异常高温、干旱的极端天气导致的O3污染超标最多[5], 占全年天数的30.4%.济南市O3污染水平及超标情况较为严重.

|
图 2 2015~2020年济南市MDA8 O3浓度的变化趋势 Fig. 2 Variation trend of MDA8 O3 concentration in Jinan from 2015 to 2020 |
济南市2015~2020年MDA8 O3浓度分布如图 3所示.2020年ρ(MDA8 O3)在<60 μg·m-3区间出现的频率由2015年的26.8%下降至2020年的14.8%, 而在60~160 μg·m-3浓度区间出现的频率由2015年的49.9%上升至2020年的58.2%, >160 μg·m-3和>200 μg·m-3分别由22.2%、6.8%上升至26.0%和11.7%.与2015~2017年相比, 2018~2020年O3浓度低值出现的频率减少, 而高值出现的频率增加, O3浓度分布总体向高值范围移动.

|
图 3 2015~2020年济南市MDA8 O3浓度值频率分布 Fig. 3 Probability distribution functions of daily MDA8 O3 concentration in Jinan from 2015 to 2020 |
一年之中O3浓度峰值高低和出现的月份会随气象条件和地理位置的变化有所不同[11], 由于济南市地处温带季风气候区, 受东亚季风的影响显著, O3浓度的季节性特征明显, 图 4(a)为2015~2020年济南市MDA8 O3月浓度平均值的变化曲线, 总体表现为夏季高冬季低的特点.从图 4(a)中可以看出, 1~12月各月均有不同程度的上升趋势, 其中6月上升幅度最大[7.4 μg·(m3·a)-1], 从2015年的179 μg·m-3上升至2019年的225 μg·m-3, 2020年下降至200 μg·m-3.其次是11月, 年增长5.6 μg·(m3·a)-1, 8月最低, 年增长0.8 μg·(m3·a)-1.冬季(12月~次年2月)O3浓度增长率在2.6~3.9 μg·(m3·a)-1之间, 冬季大气氧化性的增加会显著影响二次PM2.5的形成, Wang等[9, 11]在研究中提到我国城市MDA8 O3冷季(11月至次年4月)的增长率超过暖季(5~10月), 冬季O3的防控同样值得引起关注.

|
图 4 2015~2020年济南市O3浓度时间变化规律 Fig. 4 Temporal variations in O3 concentrations in Jinan from 2015 to 2020 |
每年的4~9月随着气温的升高和太阳辐射的增强, 光化学反应活跃, 有利于O3生成, 俗称“臭氧季”[32].图 4(b)统计了2015~2020年4~9月O3小时浓度的日变化规律, 图 4(c)~4(d)为2015~2020年4~9月白天(07:00~19:00)与夜间(20:00~次日06:00)时段O3浓度平均值的变化趋势.2015~2020年白天与夜间O3浓度都出现了不同程度的上升趋势, 且2019~2020年O3超标时间比2015年提前了1~2 h, 这与Lu等[2]和Wang等[18]研究的结果一致, 也是近年来大气氧化性逐渐增强的验证.夜间O3的年增长率为0.4 μg·(m3·a)-1, 低于白天的增长率[1.3 μg·(m3·a)-1].小时浓度最大值从2015年的157 μg·m-3上升至2019年的177 μg·m-3, 然后略下降至2020年的172 μg·m-3. 从日变化中O3小时浓度最高值到最低值的差值反映了O3的光化学生成, 2019年和2020年O3的光化学生成量为112.7 μg·m-3和110.3 μg·m-3, 比2015年光化学生成量增加13.9 μg·m-3和11.5 μg·m-3.我国超过90%的站点2013~2019年4~9月O3昼夜浓度均呈现上升趋势, 夜间增长率(1.3×10⁻⁹ a-1)小于白天增长率(2.1×10⁻⁹ a-1), 加大了昼夜浓度的差值[2].推测这种现象是由于近年来NOx排放的减少, 导致NO滴定作用的减弱和O3生成敏感性的转变增加了O3生成速率等有关[18, 29].而2014~2020年4~9月北京夜间O3浓度增长率[1.89 μg·(m3·a)-1]高于白天[0.99 μg·(m3·a)-1], 小时浓度最高值到最低值的差值也从2014年的51.4 μg·m-3下降至2020年的45.4 μg·m-3[32].
2.2 O3污染的空间分布特征及变化趋势图 5展示济南市2015~2020年监测站点O3年评价浓度的空间分布情况.各站点2015~2020年O3年评价浓度的平均值在179~221 μg·m-3之间, 超标站点的比例在93.5% ~100%之间, 除了2016~2018年1~2个站点未超标外, 其余年份所测站点均超标.由图 5可以看出, 2015年O3浓度高值出现于北部的商河县、济阳区和城区部分站点, 2018年和2020年O3污染程度加重, 且污染较重地区转变为城区近郊北部的济阳区、东部的章丘区、西南部的长清区和城区的大多数站点.各站点间O3浓度的相对标准偏差由2015年的9.9%下降至2020年的7.5%, 站点之间O3浓度水平差异在减小.

|
图 5 2015~2020年济南市O3年评价浓度的空间分布 Fig. 5 Spatiotemporal distributions of annual O3 evaluation values in Jinan from 2015 to 2020 |
此外, 各站点MDA8 O3超标率空间分布如图 6所示, 2020年城市站点的超标率明显高于其他站点, 超标率较高的站点由城区以北地区转变为城区及周边, 主要集中于城区.与2015年相比, 2020年城区站点的超标率增加明显, 与图 5中的O3浓度变化情况基本一致.

|
图 6 2015~2020年济南市MDA8 O3超标率的空间分布 Fig. 6 Spatiotemporal distributions of exceedance ratio of MDA8 O3 in Jinan from 2015 to 2020 |
图 7为监测站点O3变化趋势显著性的空间分布, 图 7(a)为O3年评价浓度变化趋势的统计情况.从统计显著性来看, 在监测的31个站点中, 有5个站点O3年评价浓度变化趋势显著, 其余26个站点变化趋势不显著.变化趋势显著的5个站点中, 有4个站点O3浓度呈增长趋势, 年增长率在4.5~8.6 μg·(m3·a)-1之间; 1个站点O3浓度呈现显著下降趋势, 年下降率为9.3 μg·(m3·a)-1.

|
图 7 O3变化趋势显著性的监测站点空间分布 Fig. 7 Spatiotemporal distribution maps of the significance level of the O3 change trend |
4~9月MDA8 O3浓度基本上包括全年的臭氧浓度高值, 图 7(b)为2015~2020年济南市4~9月变化趋势显著性的空间分布.在监测的31个站点中, 有7个站点MDA8 O3浓度变化趋势显著, 其余24个站点变化趋势不显著.变化趋势显著的7个站点中, 有6个站点MDA8 O3浓度呈增长趋势, 年增长率在4.1~8.5 μg·(m3·a)-1之间; 1个站点O3浓度呈现显著下降趋势, 年下降率为7.6 μg·(m3·a)-1.与年评价浓度空间分布类似, 城区和靠近城区的西南部站点O3浓度呈显著增长趋势, 远离城区的北部商河县O3浓度下降.
2.3 O3前体物影响因素讨论 2.3.1 前体物VOCs和NOx的变化有研究表明影响O3浓度长期变化的直接因素是前体物的排放变化, 特别是VOCs和NOx的变化[2], 本文选定研究期间4~9月VOCs和NOx的变化以分析造成上述O3变化趋势的原因.
图 8(a)展示了济南市2015~2020年4~9月平均对流层NO2柱浓度的空间分布.可以看出, 城区、近郊的北部和东部NO2浓度较高, 其余的远郊区和农村地区浓度较低.2015~2020年对流层NO2呈下降趋势[图 8(b)], 与2015年相比, 2020年下降20.6%, 年下降率为0.3×10¹⁵ mole·(cm2·a)-1.从空间分布来看, 绝大部分地区NO2柱浓度呈下降趋势, 下降幅度区域差异明显, 下降幅度较高的地区集中在城区和东部、西南部, 最大下降率为1.8×10¹⁵ mole·(cm2·a)-1, 远郊区和农村地区幅度较小.对流层NO2柱浓度的城乡差异逐渐缩小, 标准偏差从2015年的2.1×10¹⁵ mole·cm-2下降到2020年的1.1×10¹⁵ mole·cm-2.

|
图 8 2015~2020年对流层NO2和HCHO空间分布及对应的浓度变化 Fig. 8 Maps of satellite-based mean tropospheric NO2 and HCHO and the corresponding linear trend from 2015 to 2020 |
HCHO对产生VOCs的自由基化学过程具有重要影响, OMI HCHO对流层柱浓度可以表征VOCs排放的变化[13, 30, 41], 其排放源包括人为源和生物源, Shen等[41]研究发现, OMI HCHO在中国大城市中的浓度分布与人为源VOCs排放基本一致, 而不是生物排放源, 且在2006~2015年5~9月华北平原和长三角地区HCHO柱浓度的增长与人为源VOCs排放的增加密切相关.图 8(c)为济南市2015~2020年4~9月HCHO平均对流层垂直柱浓度的分布情况, 平均浓度为11.0×10¹⁵ mole·cm-2, 城区和东部浓度较高.大多数生物源VOCs(BVOCs)活性比人为源VOCs(AVOCs)更强, 导致农田和森林区域的HCHO柱浓度相对较高[42], 尽管济南市南部山区BVOCs的排放量较大, 但HCHO浓度却不高, 而城区和东部AVOCs排放的贡献较大导致HCHO水平较高.从变化率的空间分布来看[图 8(d)], HCHO柱浓度最大增长率为0.8×10¹⁵ mole·(cm2·a)-1, 最大下降率为0.7×10¹⁵ mole·(cm2·a)-1.
图 9显示了2015~2020年济南市4~9月MDA8 O3及其前体物的变化趋势, 即近地面O3、CO、NO2监测浓度、以及来自OMI的对流层NO2和HCHO柱浓度.济南市6a间4~9月MDA8 O3上升了8.7%, 年均升高3.8 μg·m-3.与2015年相比, 2020年近地面NO2和CO年浓度平均值分别下降25.8%和29.2%, 这与多分辨率排放清单和OMI遥感观测数据结果基本一致[11, 13].而HCHO对流层柱浓度总体呈波动式变化趋势, 总体变化不大, HCHO浓度变化受诸多因素影响, 但是仍能看出过去6 a间其下降幅度比NO2小得多.即NOx排放量的降幅远远大于VOCs排放量的降幅.Wang等[9]研究发现与欧美国家NOx和VOCs排放量均呈明显下降的趋势不同, 我国2011年后NOx出现显著下降趋势, 而AVOCs排放量在“十三五”期间基本持平.

|
图 9 2015~2020年4~9月济南市MDA8 O3及其前体物的变化情况 Fig. 9 Variations in MDA8 O3 and precursors in Jinan in April-September from 2015 to 2020 |
O3及其前体物之间的关系通常是非线性的, 即前体物浓度的下降并不一定会导致O3浓度相应地下降, 利用O3生成对VOCs和NOx排放变化的不同响应关系可以将O3前体物控制区域分为VOCs控制区、NOx控制区和协同控制区.在VOCs控制区, O3浓度会随着VOCs降低而降低, 随着NOx降低而增加; 在NOx控制区, O3浓度随着NOx降低而降低, 随着VOCs降低而增加[1].
图 10(a)显示2015~2020年4~9月济南市FNR平均值分布情况, 城区大部分和城郊北部、东部等区域由于NOx排放量较大, FNR值小于2, 属于VOCs控制区, 如2.3.1节所述该区域NO2浓度明显下降, 滴定效应减弱导致其O3增加趋势显著, 其他区域为协同控制区或NOx控制区.北部的商河县处于NOx控制区或协同控制区, NO2浓度降低使得O3浓度呈现降低趋势.

|
图 10 2015~2020年济南市HCHO/NO2空间分布及对流层HCHO/NO2值的变化 Fig. 10 Spatial distribution of HCHO/NO2 from 2015 to 2020 and changes in tropospheric HCHO/NO2 in Jinan |
图 10(b)为2015~2020年济南市FNR年平均值的变化情况, 不同年份VOCs和NOx人为源排放的变化会对FNR的年际变化产生一定的影响, 同时受气象条件等因素的影响, 与O3浓度变化之间的关系比较复杂, 今后还需要开展深入的研究[43~45].图 10(b)显示随着NO2柱浓度的减少, HCHO/NO2的值不断增加, 表明济南市VOCs控制区的范围逐渐缩小.Wang等[18]在研究中发现在京津冀地区由于NOx排放减少, 前体物敏感性在空间上发生了转变, VOCs控制区面积由2012年的62.8%下降到2016年的39.9%, 而协同控制区从25.0%增加到46.2%.同样的现象也出现在2016~2019年华北平原、长三角和珠三角等重点区域的研究中[13], 2019年华北平原的北京、天津、济南和石家庄等中心城区属于VOCs控制区, 这与本研究的结果基本一致.表明以往NOx排放量的减少影响了O3的形成机制, 但不足以改变典型的城市地区O3形成从VOCs控制到NOx控制的机制.
当前济南市的NOx排放明显减少, 但是VOCs排放并没有得到明显控制.为了进一步有效控制O3污染, 未来需进一步加大对VOCs排放的控制力度, 提高VOCs/NOx的减排率, 特别是在城区和周边郊区.
3 结论(1) 2015~2020年济南市O3浓度呈上升趋势, 年评价浓度上升了8.5%, 年均升高4.8 μg·(m3·a)-1, 4~9月MDA8 O3上升了8.7%, 年均升高3.8 μg·(m3·a)-1.其中6月上升幅度最大[7.4 μg·(m3·a)-1], 而冬季O3呈现不同程度的增长, 其防控同样应值得重视.4~9月O3昼夜浓度均在增加, 光化学生成能力增强.
(2) 各监测站点间O3浓度水平差异逐渐缩小, 年均超标率与O3浓度逐渐表现出同步性, 位于市区和近郊区的监测站点O3浓度显著增长(P<0.05).
(3) 2015~2020年济南市对流层NO2浓度下降20.6%, 下降率为0.3×10¹⁵ mole·(cm2·a)-1, 城区、东部和西南部下降幅度较大, 远郊区和农村地区幅度较小.而对流层HCHO浓度总体变化不大, NOx排放量的降幅远大于VOCs排放量的降幅.
(4) 济南市城区和周边区域为VOCs控制区, 其他区域为协同控制区或NOx控制区.近年来城区和周边区域NO2浓度明显下降, 滴定效应减弱导致这些区域O3增加趋势显著, 未来应将持续加大VOCs的减排力度.
| [1] | Wang T, Xue L K, Brimblecombe P, et al. Ozone pollution in China: a review of concentrations, meteorological influences, chemical precursors, and effects[J]. Science of the Total Environment, 2017, 575: 1582-1596. DOI:10.1016/j.scitotenv.2016.10.081 |
| [2] | Lu X, Zhang L, Wang X L, et al. Rapid increases in warm-season surface ozone and resulting health impact in China since 2013[J]. Environmental Science & Technology Letters, 2020, 7(4): 240-247. |
| [3] | Fu Y, Liao H, Yang Y. Interannual and decadal changes in tropospheric ozone in China and the associated chemistry-climate interactions: a review[J]. Advances in Atmospheric Sciences, 2019, 36(9): 975-993. DOI:10.1007/s00376-019-8216-9 |
| [4] | Miao W J, Huang X, Song Y. An economic assessment of the health effects and crop yield losses caused by air pollution in mainland China[J]. Journal of Environmental Sciences, 2017, 56: 102-113. DOI:10.1016/j.jes.2016.08.024 |
| [5] |
姜华, 常宏咪. 我国臭氧污染形势分析及成因初探[J]. 环境科学研究, 2021, 34(7): 1576-1582. Jiang H, Chang H M. Analysis of China's ozone pollution situation, preliminary investigation of causes and prevention and control recommendations[J]. Research of Environmental Sciences, 2021, 34(7): 1576-1582. DOI:10.13198/j.issn.1001-6929.2021.05.20 |
| [6] |
符传博, 周航. 中国城市臭氧的形成机理及污染影响因素研究进展[J]. 中国环境监测, 2021, 37(2): 33-43. Fu C B, Zhou H. Research progress on the formation mechanism and impact factors of urban ozone pollution in China[J]. Environmental Monitoring in China, 2021, 37(2): 33-43. |
| [7] |
于瑞新, 刘旻霞, 李亮, 等. 长三角地区近15年大气臭氧柱浓度时空变化及影响因素[J]. 环境科学学报, 2021, 41(3): 770-784. Yu R X, Liu M X, Li L, et al. Spatial and temporal variation of atmospheric ozone column concentration and influencing factors in the Yangtze River Delta region in recent 15 years[J]. Acta Scientiae Circumstantiae, 2021, 41(3): 770-784. DOI:10.13671/j.hjkxxb.2020.0346 |
| [8] |
赵伟, 高博, 卢清, 等. 2006~2019年珠三角地区臭氧污染趋势[J]. 环境科学, 2021, 42(1): 97-105. Zhao W, Gao B, Lu Q, et al. Ozone pollution trend in the Pearl River Delta region during 2006-2019[J]. Environmental Science, 2021, 42(1): 97-105. |
| [9] | Wang T, Xue L K, Feng Z Z, et al. Ground-level ozone pollution in China: a synthesis of recent findings on influencing factors and impacts[J]. Environmental Research Letters, 2022, 17. DOI:10.1088/1748-9326/ac69fe |
| [10] | Li K, Jacob D J, Shen L, et al. Increases in surface ozone pollution in China from 2013 to 2019: anthropogenic and meteorological influences[J]. Atmospheric Chemistry and Physics, 2020, 20(19): 11423-11433. DOI:10.5194/acp-20-11423-2020 |
| [11] | Wang W J, Parrish D D, Wang S W, et al. Long-term trend of ozone pollution in China during 2014-2020: distinct seasonal and spatial characteristics and ozone sensitivity[J]. Atmospheric Chemistry and Physics, 2022, 22(13): 8935-8949. DOI:10.5194/acp-22-8935-2022 |
| [12] | Shen L, Jacob D J, Liu X, et al. An evaluation of the ability of the ozone monitoring instrument (OMI) to observe boundary layer ozone pollution across China: application to 2005-2017 ozone trends[J]. Atmospheric Chemistry and Physics, 2019, 19(9): 6551-6560. DOI:10.5194/acp-19-6551-2019 |
| [13] | Wang W N, van der A R, Ding J Y, et al. Spatial and temporal changes of the ozone sensitivity in China based on satellite and ground-based observations[J]. Atmospheric Chemistry and Physics, 2020, 21(9): 7253-7269. |
| [14] |
杨雷峰. 中国典型区域臭氧污染长期趋势变化控制因素的识别研究[D]. 广州: 华南理工大学, 2020. Yang L F. Identification of controlling factors on the long-term trends of ozone pollution over typical areas of China[D]. Guangzhou: South China University of Technology, 2020. |
| [15] |
余益军, 孟晓艳, 王振, 等. 京津冀地区城市臭氧污染趋势及原因探讨[J]. 环境科学, 2020, 41(1): 106-114. Yu Y J, Meng X Y, Wang Z, et al. Driving factors of the significant increase in surface ozone in the Beijing-Tianjin-Hebei region, China, during 2013-2018[J]. Environmental Science, 2020, 41(1): 106-114. |
| [16] |
何超, 慕航, 杨璐, 等. 中国暖季近地面臭氧浓度空间格局演变及主要气象驱动因素[J]. 环境科学, 2021, 42(9): 4168-4179. He C, Mu H, Yang L, et al. Spatial variation of surface ozone concentration during the warm season and its meteorological driving factors in China[J]. Environmental Science, 2021, 42(9): 4168-4179. |
| [17] |
晏洋洋, 尹沙沙, 何秦, 等. 河南省臭氧污染趋势特征及敏感性变化[J]. 环境科学, 2022, 43(6): 2947-2956. Yan Y Y, Yin S S, He Q, et al. Trend changes in ozone pollution and sensitivity analysis of ozone in Henan province[J]. Environmental Science, 2022, 43(6): 2947-2956. |
| [18] | Wang N, Lyu X, Deng X J, et al. Aggravating O3 pollution due to NOx emission control in eastern China[J]. Science of the Total Environment, 2019, 677: 732-744. |
| [19] | Xu W Y, Xu X B, Lin M Y, et al. Long-term trends of surface ozone and its influencing factors at the Mt Waliguan GAW station, China-Part 2: the roles of anthropogenic emissions and climate variability[J]. Atmospheric Chemistry and Physics, 2018, 18(2): 773-798. |
| [20] | Wei W, Wang X F, Wang X Q, et al. Attenuated sensitivity of ozone to precursors in Beijing-Tianjin-Hebei region with the continuous NOx reduction within 2014-2018[J]. Science of The Total Environment, 2022, 813. DOI:10.1016/j.scitotenv.2021.152589 |
| [21] | Dang R J, Liao H, Fu Y. Quantifying the anthropogenic and meteorological influences on summertime surface ozone in China over 2012-2017[J]. Science of the Total Environment, 2021, 754. DOI:10.1016/j.scitotenv.2020.142394 |
| [22] | Yao S Y, Wei W, Cheng S Y, et al. Impacts of meteorology and emissions on O3 pollution during 2013-2018 and corresponding control strategy for a typical industrial city of China[J]. Atmosphere, 2021, 12(5). DOI:10.3390/atmos12050619 |
| [23] | Sun L, Xue L K, Wang Y H, et al. Impacts of meteorology and emissions on summertime surface ozone increases over Central Eastern China between 2003 and 2015[J]. Atmospheric Chemistry and Physics, 2019, 19(3): 1455-1469. |
| [24] | Yang L F, Luo H H, Yuan Z B, et al. Quantitative impacts of meteorology and precursor emission changes on the long-term trend of ambient ozone over the Pearl River Delta, China, and implications for ozone control strategy[J]. Atmospheric Chemistry and Physics, 2019, 19(20): 12901-12916. |
| [25] | Liu Y M, Wang T. Worsening urban ozone pollution in China from 2013 to 2017-Part 2: the effects of emission changes and implications for multi-pollutant control[J]. Atmospheric Chemistry and Physics, 2020, 20(11): 6323-6337. |
| [26] | Xiang S L, Liu J F, Tao W, et al. Control of both PM2.5 and O3 in Beijing-Tianjin-Hebei and the surrounding areas[J]. Atmospheric Environment, 2020, 224. DOI:10.1016/j.atmosenv.2020.117259 |
| [27] | Lyu X, Wang N, Guo H, et al. Causes of a continuous summertime O3 pollution event in Jinan, a central city in the North China Plain[J]. Atmospheric Chemistry and Physics, 2019, 19(5): 3025-3042. |
| [28] |
殷永泉, 李昌梅, 马桂霞, 等. 城市臭氧浓度分布特征[J]. 环境科学, 2004, 25(6): 16-20. Yin Y Q, Li C M, Ma G X, et al. Ozone concentration distribution of urban[J]. Environmental Science, 2004, 25(6): 16-20. |
| [29] |
孙晓艳, 赵敏, 申恒青, 等. 济南市城区夏季臭氧污染过程及来源分析[J]. 环境科学, 2022, 43(2): 686-695. Sun X Y, Zhao M, Shen H Q, et al. Ozone formation and key VOCs of a continuous summertime O3 pollution event in Ji'nan[J]. Environmental Science, 2022, 43(2): 686-695. |
| [30] |
武卫玲, 薛文博, 雷宇, 等. 基于OMI数据的京津冀及周边地区O3生成敏感性[J]. 中国环境科学, 2018, 38(4): 1201-1208. Wu W L, Xue W B, Lei Y, et al. Sensitivity analysis of ozone in Beijing-Tianjin-Hebei (BTH) and its surrounding area using OMI satellite remote sensing data[J]. China Environmental Science, 2018, 38(4): 1201-1208. |
| [31] | Bai K X, Ma M L, Chang N B, et al. Spatiotemporal trend analysis for fine particulate matter concentrations in China using high-resolution satellite-derived and ground-measured PM2.5 data[J]. Journal of Environmental Management, 2019, 233: 530-542. |
| [32] | Ren J, Hao Y F, Simayi M, et al. Spatiotemporal variation of surface ozone and its causes in Beijing, China since 2014[J]. Atmospheric Environment, 2021, 260. DOI:10.1016/j.atmosenv.2021.118556 |
| [33] | Zhang L S, Lee C S, Zhang R Q, et al. Spatial and temporal evaluation of long term trend (2005-2014) of OMI retrieved NO2and SO2 concentrations in Henan Province, China[J]. Atmospheric Environment, 2017, 154: 151-166. |
| [34] | Kalsoom U, Wang T J, Ma C Q, et al. Quadrennial variability and trends of surface ozone across China during 2015-2018: a regional approach[J]. Atmospheric Environment, 2021, 245. DOI:10.1016/j.atmosenv.2020.117989 |
| [35] |
但扬彬, 于瑞莲, 卞雅慧, 等. 基于OMI数据的新冠疫情影响下福建省臭氧敏感性变化[J]. 中国环境科学, 2021, 41(5): 2056-2063. Dan Y B, Yu R L, Bian Y H, et al. The change of atmospheric ozone formation sensitivity in Fujian Province based on OMI satellite data during the period of COVID-19[J]. China Environmental Science, 2021, 41(5): 2056-2063. |
| [36] | Chou C C K, Tsai C Y, Chang C C, et al. Photochemical production of ozone in Beijing during the 2008 Olympic Games[J]. Atmospheric Chemistry and Physics, 2011, 11(18): 9825-9837. |
| [37] | Ding A J, Fu C B, Yang X Q, et al. Intense atmospheric pollution modifies weather: a case of mixed biomass burning with fossil fuel combustion pollution in eastern China[J]. Atmospheric Chemistry and Physics, 2013, 13(20): 10545-10554. |
| [38] | Duncan B N, Yoshida Y, Olson J R, et al. Application of OMI observations to a space-based indicator of NOx and VOC controls on surface ozone formation[J]. Atmospheric Environment, 2010, 44(18): 2213-2223. |
| [39] | Jin X M, Fiore A, Boersma K F, et al. Inferring changes in summertime surface ozone-NOx-VOC chemistry over U.S. Urban areas from two decades of satellite and ground-based observations[J]. Environmental Science & Technology, 2020, 54(11): 6518-6529. |
| [40] | Jin X M, Holloway T. Spatial and temporal variability of ozone sensitivity over China observed from the Ozone Monitoring Instrument[J]. Journal of Geophysical Research: Atmospheres, 2015, 120(14): 7229-7246. |
| [41] | Shen L, Jacob D J, Zhu L, et al. The 2005-2016 trends of formaldehyde columns over China observed by satellites: increasing anthropogenic emissions of volatile organic compounds and decreasing agricultural fire emissions[J]. Geophysical Research Letters, 2019, 46(8): 4468-4475. |
| [42] | Li L Y, Yang W Z, Xie S D, et al. Estimations and uncertainty of biogenic volatile organic compound emission inventory in China for 2008-2018[J]. Science of the Total Environment, 2020, 733. DOI:10.1016/j.scitotenv.2020.139301 |
| [43] | Chen Y P, Yan H, Yao Y J, et al. Relationships of ozone formation sensitivity with precursors emissions, meteorology and land use types, in Guangdong-Hong Kong-Macao Greater Bay Area, China[J]. Journal of Environmental Sciences, 2020, 94: 1-13. |
| [44] | Li D R, Wang S S, Xue R B, et al. OMI-observed HCHO in Shanghai, China, during 2010-2019 and ozone sensitivity inferred by an improved HCHO/NO2 ratio[J]. Atmospheric Chemistry and Physics, 2021, 21(20): 15447-15460. |
| [45] | Liu C Q, Zhang L, Wen Y, et al. Sensitivity analysis of O3 formation to its precursors-Multifractal approach[J]. Atmospheric Environment, 2021, 251. DOI:10.1016/j.atmosenv.2021.118275 |