 2022, Vol. 43


2. 中国科学院地球化学研究所, 环境地球化学国家重点实验室, 贵阳 550081;
3. 重庆市农业资源与环境研究重点实验室, 重庆 400716
2. State Key Laboratory of Environmental Geochemistry, Institute of Geochemistry, Chinese Academy of Sciences, Guiyang 550081, China;
3. Chongqing Key Laboratory of Agricultural Resources and Environment, Chongqing 400716, China
汞(Hg)是一种强神经毒性的重金属元素, 在大气中主要以气态单质形态(Hg0)存在. Hg0能够在大气中长时间滞留(0.5~1.5 a), 并通过大气环流进行长距离传输, 因此汞被认为是一种全球性污染物[1~3].全球大气中的汞能够通过干/湿沉降的方式进入陆地生态系统, 以地表径流和地下渗流的方式进入水生生态系统.而水生生态系统中沉降的无机汞可转化为毒性更强的甲基汞(MeHg), 可进一步通过食物链的生物富集和生物放大效应, 对下游生态系统和人体健康造成潜在危害[4, 5].
青藏高原毗邻南亚、东亚和东南亚等重要的汞生产和排放地区.在冬季西风环流和夏季南亚季风的交替控制下, 东亚、南亚和东南亚等地区人为活动排放的汞能够进入青藏高原腹地并沉降到陆地和水生生态系统中[6, 7].然而, 青藏高原独特的生态系统使其成为对全球气候变暖和环境变化最为敏感的区域之一.近年来青藏高原出现明显的增温现象, 其增温速度约为全球平均升高温度的2~3倍[8].气温升高导致青藏高原地区大面积的冰川、积雪和冻土等消融退化, 使得先前固存在其中的汞再释放进入地表水等环境介质中进而影响水生生态系统中汞的地球化学循环[9~11].
青藏高原三江源地区作为长江-黄河的发源地, 其淡水资源环境安全影响着下游数亿人口的生命健康, 探明其地表水中汞的分布、迁移和来源等环境过程对下游生态风险的评估至关重要.由于其地表水生生态系统复杂的水文循环系统和高寒地区较困难的采样条件, 目前仍缺乏对该区域地表水中汞的地球化学循环的深入研究.本文以长江源和黄河源流域地表水为研究对象, 重点探讨了汞的形态和空间分布及其影响因素, 并结合地表水中其他微量重金属的浓度, 利用PMF模型对地表水中汞的来源进行解析, 以期为三江源地区汞生态风险评估提供基础数据和理论支撑, 并加深对全球变暖背景下高寒地区水体中汞的地球化学循环过程的认识.
1 材料与方法 1.1 研究区域概况研究区域位于青藏高原范围内长江源流域和黄河源流域, 北纬31°39′~36°12′, 东经89°45′~103°23′(图 1).该区域是世界上最大的高山湿地生态系统, 同时也是中国重要的生态屏障和水源涵养区.该地区以山地地貌为主, 地形复杂, 地势高耸, 平均海拔在4 000 m以上.植被类型具有显著的水平和垂直地带性, 主要以高寒草原和高寒草甸为主, 并包含草地、荒漠、湿地和灌丛等多种景观类型[12].该区域气候类型为典型高原山地气候, 气候垂直变化十分显著且终年低温干燥, 年平均气温在-5.6~7.8℃之间, 年降水量从东南的773 mm降至西北的262 mm.

|
图 1 研究区域内采样点和年降水量分布示意 Fig. 1 Distribution of sampling sites and annual precipitation in study area |
其中, 长江源流域(北纬32°30′~35°35′, 东经90°43′~96°45′)主要位于青藏高原腹地昆仑山脉和唐古拉山脉之间, 其面积约为13.8×10⁴ km2, 占三江源流域面积的43.2%, 区域内海拔由东向西逐渐升高[13].长江源主要以沱沱河为正源, 以楚玛尔河为北源, 以当曲为南源.此外, 长江源流域包含大面积的冻土, 其中多年冻土分布最为广泛, 占整个长江源流域面积的77%.当前全球变暖加剧了冻土融化, 活跃层厚度增加, 进而导致多年冻土区土壤径流量显著增加[14].
黄河源流域(北纬32°10′~36°59′, 东经90°54′~103°24′)位于青藏高原东北部, 其面积约为12.3×10⁴ km2, 约占整个三江源流域面积的39%.相较于长江源流域, 黄河源流域地势分布一致而海拔较低, 平均海拔在3 000 m以上.黄河源源头主要为约古宗列曲和卡日曲.其中, 约古宗列曲发源于巴颜喀拉山, 卡日曲发源于卡日扎穷山.黄河源流域冻土类型以多年冻土为主, 其面积约为2.5×10⁴ km2, 占黄河源流域面积的85.1%, 随着气候变化, 该区域的多年冻土也呈现出显著的退化趋势[15].
1.2 样品采集和预处理地表水样品于2020年7月采集于长江源流域和黄河源流域, 共选取了19个研究样点, 其中长江源流域选取了12个研究样点, 黄河源流域选取了7个研究样点(图 1).采集的地表水类型包括河流、湖泊和冻土热融湖水样品, 采样深度为表层0~20 cm.采样过程中由GPS记录各样点坐标, 样点具体信息见表 1.
|
|
表 1 长江源和黄河源流域中各研究样点基本信息 Table 1 Description of sampling sites in the Yangtze River and Yellow River source basins |
用于样品采集的特氟龙(聚四氟乙烯, PFA)采样瓶和棕色瓶均在实验室进行了严格地清洗.具体的操作如下:向特氟龙试剂瓶中加入100%反王水溶液(HCl∶HNO3=1∶3, 体积比)后, 置于电热板上以120℃加热12 h, 随后用超纯水洗净残留反王水, 放置烘箱中于65℃加热24 h; 将棕色玻璃瓶等采样容器清洗干净并浸泡于25%的硝酸中12 h, 取出用纯水洗净后置于马弗炉中480℃加热约1.5 h.采样之前, 对上述处理后的采样容器和野外实验所需的工艺超纯盐酸进行汞和其他重金属空白测定, 空白值达到采样要求方可用于样品采集.
采样过程中, 全程佩戴一次性丁腈手套, 样品采集前, 先将容器润洗2~3次.随后, 用特氟龙瓶取250 mL水样, 随后加入1 mL工艺超纯盐酸密封避光低温保存, 用于THg浓度的测定.对用于测定DHg和微量重金属浓度的水样, 用0.45 μm滤膜进行过滤, 过滤之前将过滤器和采样容器分别用超纯水和过滤后的样品润洗3遍, 将滤液储存于250 mL特氟龙瓶中, 并加入1 mL工艺超纯盐酸密封避光低温保存.用于测定分析微量重金属和溶解性有机碳(dissolved organic carbon, DOC)浓度的水样(40 mL)储存于棕色玻璃瓶中, 在4℃低温下避光保存.
1.3 样品测定THg和DHg浓度的测定采用BrCl氧化-SnCl2还原-吹氮气金管富集-二次金汞齐-冷原子荧光光谱法(CVAFS, Brooks Rand Model Ⅲ), 该方法检出限为0.02 ng·L-1[16].具体测定步骤为:在测样前12 h, 向水样中加入水样体积0.5%的BrCl(质量分数为25%), 样品测定前20 min向水样中加入质量分数为25%的NH2OH·HCl以中和多余的BrCl, 随后用质量分数20%的SnCl2将Hg2+还原为气态Hg0并通过金管捕集, 最后利用冷原子荧光测汞仪进行测定.测定过程中, 本研究严格采用空白、平行设置、标准物质标定等方法进行质量控制, 即每隔10个样品测定1次浓度为1ng·L-1的总汞标准溶液(GSB07-1274-2000)、1个系统空白和1对平行样品.标准溶液回收率为95%~105%, 系统空白小于0.1ng·L-1.此外, 样品进行重复平行测试过程中, 其浓度结果标准偏差小于5%, 说明本研究中汞浓度结果的准确度和精确度均已达标.PHg浓度通过THg和DHg浓度的差减法获得[ρ(PHg)=ρ(THg)-ρ(DHg)].
采用等离子体质谱法(ICP-MS, Agilent-7900)测定Cr、Ni、Cu、Zn、As、Cd、Pb、Co、Sr、Ag、Ba、Tl和U的浓度.具体步骤为:取棕色瓶中过滤后水样15 mL(必要时进行稀释), 利用等离子体质谱仪对样品溶液中微量重金属浓度进行测定.测定过程中, 每个样品测定前使用1%HNO3清洗进样管, 以保证空白信号残余低于0.1%.仪器稳定情况下, 每隔10个样品测定1次浓度为10 mg·L-1的重金属标准溶液(Multi-element Calibration Standard 2A)和1对平行样品.标准溶液回收率为92%~108%, 平行测定的数据标准偏差小于5%.此外, DOC浓度由TOC分析仪(TOC-L, 日本岛津; 检出限为4 μg·L-1)测定.
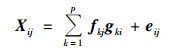
1.4 数据分析正定矩阵因子分解法(positive matrix factorization, PMF)利用相关矩阵和方差矩阵对多维变量进行简化从而定量解析污染源因子[17].本研究采用PMF对地表水中汞的潜在来源进行定量解析, 基本公式如下:
|
(1) |
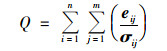
式中, Xij为第i个样本中金属j的浓度, gkj为污染源k对第i个样本的贡献率; fkj为来源k中重金属j的浓度, eij为残差矩阵.PMF模型定义目标函数Q以得到最优解析结果:
|
(2) |
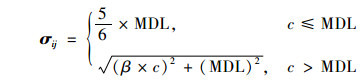
式中, σij为第i个样本中重金属j的不确定度, 不确定度的计算如式(3):
|
(3) |
式中, β为相对标准偏差, c为重金属实测浓度, MDL为重金属测定的方法检出限, 本研究以连续测定11次空白的浓度值的3倍标准偏差作为重金属的MDL.
将数据导入EPA PMF 5.0软件后, 首先尝试设置不同的因子数进行多次运算, 结合研究区域的可能来源类型, 最后确定因子数为3以得到最优的解析结果.经过30次迭代运算后, 最终确定了第9次运算结果, 大部分残差值在-3~3之间并基本符合正态分布, 且计算结果趋于稳定.此外, 重金属含量的实测值与模型预测值之间拟合曲线的R2均大于0.70, 表明拟合结果可信度高, 3个因子数能够充分解释实测数据所包含的信息.EPA PMF5.0模型的具体原理和软件详细操作步骤可见文献[18].
本研究采用Excel2016、Adobe illustrator CS6、Arcmap10.7和SPSS25.0软件完成统计分析和图表绘制.本研究采用独立样本T检验和单因素方差分析对不同区域和不同形态的汞浓度均值进行显著性差异分析; 采用回归分析和皮尔逊相关分析探讨地表水中汞的分布特征及其影响因素.
2 结果与讨论 2.1 地表水中汞的浓度与形态分布特征在丰水期内, 研究区域内所有地表水样品中ρ(THg)介于1.48~41.21ng·L-1之间, 平均值为(8.00±2.78)ng·L-1. ρ(PHg)介于低于检出限至38.86 ng·L-1之间, 平均值为(6.17±10.06)ng·L-1. ρ(DHg)介于1.41~5.67ng·L-1之间, 平均值为(2.78±1.15)ng·L-1.河流、湖泊和冻土热融湖3种不同类型地表水中汞浓度如表 2所示, 河流中的THg和PHg浓度均显著高于湖泊和冻土热融湖(P<0.05, 独立样本T检验, 下同), 而DHg浓度在3种类型地表水中无显著差异(P>0.05).
|
|
表 2 不同地表水类型中THg、DHg和PHg浓度/ng·L-1 Table 2 Concentrations of THg, DHg, and PHg in different types of surface waters/ng·L-1 |
长江源区和黄河源区地表水中汞浓度如图 2, 长江源区地表水中ρ(THg)介于1.59~41.21ng·L-1之间, 平均值为(10.69±11.14)ng·L-1, 显著高于黄河源地表水中THg浓度(P<0.05).此外, 长江源区地表水中ρ(PHg)为低于检出限至38.86ng·L-1, 平均值为(8.46±11.41)ng·L-1, 而ρ(DHg)范围介于1.77~5.67ng·L-1之间, 平均值为(2.96±1.26)ng·L-1, PHg占THg的比例为(79.13±28.96)%, 表明PHg是长江源区地表水中汞的主要形态.黄河源区地表水中ρ(THg)介于1.48~7.63ng·L-1之间, 平均值为(3.37±2.03)ng·L-1.该区域地表水ρ(PHg)范围为低于检出限至2.92 ng·L-1, 平均值为(1.13±1.02)ng·L-1.然而, 与长江源区不同的是, 黄河源区地表水中的汞以DHg为主, ρ(DHg)平均值为(2.47±0.83)ng·L-1, 占THg的比例为(73.29±21.13)%.这主要是由于黄河源流域地表水样品主要来自湖泊或冻土热融湖, 相对稳定的水动力条件使PHg随颗粒物发生沉淀进而导致了水体中较低的PHg浓度[19, 20].

|
图 2 长江源与黄河源流域地表水中汞的浓度 Fig. 2 Hg concentrations in surface waters from source region of the Yangtze River and Yellow River, respectively |
本研究区域地表水中THg浓度和青藏高原其他区域地表水THg浓度的对比如表 3.虽然长江源流域地表水总汞浓度显著高于青藏高原部分地表水(如雅鲁藏布江、曲嘎切河和纳木错等)中THg浓度[22, 24, 25], 但远低于长江中下游受人为排放汞影响严重的水体中的ρ(THg)(100 ng·L-1)[27].同时, 长江源和黄河源流域地表水中THg浓度均未超过中国《地表水环境质量标准》(GB 3838-2002)所规定Ⅰ类水质标准限值[ρ(THg)<50ng·L-1].考虑到无机汞在一定条件下能够转化为MeHg, 其具有较高的毒性并能够通过食物链产生生物富集, 具有更严重的生态风险[28].笔者也注意到, 整个三江源地区水体MeHg占THg的比例小于6%, 说明汞的甲基化过程不会造成该区域的水生生态系统汞的生态风险[29].综上, 长江源和黄河源流域地表水中汞的生态风险较低.
|
|
表 3 青藏高原其他地表水中已报道的THg浓度1) Table 3 Comparison of THg concentrations in other surface waters in the Tibet Plateau |
2.2 地表水中汞浓度变化的影响因素
在丰水期, 长江源区地表水中THg和PHg浓度具有显著的正相关性(图 3, R2=0.99, P<0.01, Pearson相关性分析, 下同), 表明丰水期内长江源流域地表水中THg浓度主要受PHg的影响, 与雅鲁藏布江中汞的浓度受PHg制约的规律一致[24].其内在原因是青藏高原内陆型冰川PHg浓度相对较高, 除了部分汞在冰川消融过程中转化为气态单质汞而引起快速释放外, 其余大多数PHg进入到河流中[30, 31].另外, 先前研究发现丰水期内三江源河流中THg和总悬浮颗粒物(TSP)浓度呈显著的正相关关系, 认为水中悬浮颗粒物是影响汞浓度变化的重要因素[29].而长江源区植被覆盖率相对较低且土壤层薄弱, 因此丰水期流域内土壤侵蚀加剧, 土壤向河流输入的颗粒物增多, 也可能是造成长江河流中汞浓度主要受制于PHg的重要因素[32].值得注意的是, 青藏高原降水中的汞也同样以PHg为主(比例为67%~86%), 偏高比例的PHg的湿沉降也可能是地表水中PHg比例偏高的潜在原因之一[33].

|
图 3 长江源流域地表水中THg和PHg浓度的相关性 Fig. 3 Correlation between THg and PHg in surface waters in source basin of the Yangtze River |
黄河源流域地表水中DHg和DOC浓度呈显著正相关(图 4, R2=0.52, P<0.05), 这说明黄河源区地表水中的汞浓度主要受DOC的影响.考虑到冻土层及其上覆土壤中富含有机质并能够结合与存储大量的汞, 冻土活动层的季节性融化能够释放大量DOC和其结合的汞, 进而随土壤径流或渗流被输送至水体中[34, 35].因此, 黄河源流域地表水中汞的浓度主要受制于汞和DOC在随土壤径流输入过程中的耦合作用, 而非颗粒物相关的土壤侵蚀作用.值得一提的是, 虽然长江源区地表水中DHg浓度和黄河源区基本一致, 但是其地表水的DOC浓度显著低于黄河源流域.另外, 长江源区地表水DHg和DOC浓度无显著相关性(P>0.05), 本研究推测长江源流域地表水中DHg的来源和黄河源流域并不一致.考虑到长江源流域地表水中颗粒物和PHg的输入量显著高于黄河源地区, 长江源区地表水中的DHg来源可能是随土壤小粒径有机颗粒物的输入和PHg进入水体后的转化[36].

|
图 4 黄河源流域地表水中DHg和DOC浓度的相关性 Fig. 4 Correlation between DHg and DOC in surface waters in source basin of the Yellow River |
在采样期内, 长江源地表水DHg在流域内的分布无明显差异, 而THg和PHg浓度整体呈现出自西向东随水流方向下降的空间规律(图 5), 致使长江源流域地表水中PHg浓度与经度(东经)呈显著负相关性(图 6, R2=0.46, P<0.05).此外, 长江源流域上游河流(以沱沱河和楚玛尔河汇流处为界, S14~S19采样点)中THg和PHg浓度略高于下游河流(S8~S13, P=0.051).长江源区河流中PHg浓度降低的趋势受制于水体中总悬浮颗粒物浓度的下降, 呈现出显著的正相关关系(P<0.05)[30].造成该分布规律的原因可能包括以下两个方面, 一方面是长江源区内上游河流坡降急促(布曲、尕尔曲和北麓河的平均坡降分别为0.49%、0.54%和0.40%)不利于悬浮颗粒物的沉降, 而下游河流相对平缓(主流通天河的平均坡降仅为0.26%)使得水体中悬浮颗粒物的自沉降作用加强[37].因此, 悬浮颗粒物的沉降速率的增加促进了悬浮颗粒物的去除过程, 致使水体中PHg浓度下降.另一方面, 长江源区内自西向东随经度增加表现出降水量、植被生产力和土壤有机碳含量的增加, 土壤稳定性和抗蚀性随植被生产力和土壤有机碳含量的增加而增强, 限制了土壤向水体中颗粒物质的输送[38, 39].进而导致了长江源区地表水中THg和PHg浓度总体呈现为自西向东随水流方向下降的趋势.

|
图 5 研究区域内THg、DHg和PHg的空间分布 Fig. 5 Spatial distribution of THg, DHg, and PHg in study area |

|
图 6 长江源地表水中PHg浓度与经度的相关性 Fig. 6 Correlation between PHg in surface waters and longitude in source basin of the Yangtze River |
黄河源区内DHg无显著空间分布特征(图 5), 仅发现鄂陵湖内采样点(S5、S6和S7)的ρ(THg)[(2.64±1.11)ng·L-1, 平均值, 下同]和ρ(PHg)[(0.15±0.24)ng·L-1]显著低于其出口处河流(S3)的ρ(THg)[(7.64±2.60)ng·L-1]和ρ(PHg)(5.14ng·L-1)(P<0.05).这主要归因于湖泊对PHg的“捕集效应”, 其内在原因在于, 相较于河流, 湖泊的地形坡度较小、径流宽度较大, 导致湖泊水动力条件相对稳定, 促使PHg随颗粒物沉降至湖泊底部.出水口水流流速较高, 水体对颗粒物的高强度扰动使得沉淀后的PHg再次被带入下游水流中[19, 20].
2.4 地表水中汞来源的定量解析PMF模型解析结果如图 7.因子1中Cr、Ni和Co具有较高的贡献率, 分别为76.9%、82.1%和81.6%.青藏高原土壤母质中通常富含Cr、Ni和Co, 由土壤母质风化而来的Cr、Ni和Co通常能够与有机质结合而固定在土壤中[40, 41].同时, 长江源区河流中Cr、Ni和Co与DOC浓度均具有显著的正相关关系(P<0.05), 黄河源区地表水中Ni和DOC浓度也呈极显著的正相关性(P<0.01), 表明DOC是控制地表水中Cr、Co和Ni迁移转化的重要因素.考虑到冻土活动层的季节性融化能够释放大量有机质及其结合的重金属元素通过土壤径流或渗流进入水体中, 因子1主要代表重金属的土壤径流或渗流来源.

|
图 7 各因子对重金属的来源贡献率 Fig. 7 Source contributions of various factors to heavy metals |
对于因子2而言, 贡献值较高的重金属包括Tl、Pb、Hg和Cd, 贡献率分别为60.5%、60.2%、51.4%和49.0%.先前研究表明, Hg、Cd和Pb等重金属可与颗粒物结合, 通过大气长距离迁移并沉降至青藏高原地区土壤、冰川和水体产生积累[33, 42].此外, 多数Tl化合物在常温常压下具有较强的挥发性, 并且颗粒态Tl在大气中常进行长距离传输并通过干湿沉降进入生态系统[43, 44].因此, 因子2代表了重金属的大气沉降来源.
因子3中Ba、Sr和U具有较高贡献率, 分别为97.2%、72.5%和73.4%.Ba作为地壳的重要组成元素, 通常存在于重晶石等硫酸盐矿物中[45].水体和土壤中的Sr通常来源于碳酸盐、硅酸盐等矿物的风化[46].此外, 土壤中U的分布通常受土壤母质的显著影响[47].综上, 因子3主要代表了重金属的地质来源.
综上所述, 长江源和黄河源流域地表水中51.4%的Hg来源于大气沉降, 38.8%的Hg为地质来源, 如水流对土壤岩层或沉积物等的侵蚀作用, 而9.7%的Hg来源于土壤径流的输入(图 8).

|
图 8 汞的不同来源贡献 Fig. 8 Contributions of Hg from different sources |
(1) 长江源区地表水中的汞以PHg为主要形态, 浓度主要受冰川融水输入、土壤侵蚀和降水等因素影响; 而黄河源区地表水中汞的主要形态为DHg, 其分布格局主要受制于汞和DOC在随土壤径流输入过程中的耦合作用.
(2) 空间分布上, 长江源区地表水中THg和PHg浓度总体表现为自西向东随水流方向呈下降趋势, 河道坡降和土壤侵蚀强度的空间差异可能是形成这种空间分布格局的关键因素; 此外, 湖泊对PHg的“捕集效应”导致其出口处THg和PHg浓度显著高于湖泊内部.
(3) PMF模型解析结果表明, 长江源和黄河源区地表水中51.4%的汞来源于大气沉降, 38.8%的汞为地质来源, 而9.7%的汞来源于土壤径流或渗流的输入.
| [1] | Obrist D, Kirk J L, Zhang L, et al. A review of global environmental mercury processes in response to human and natural perturbations: Changes of emissions, climate, and land use[J]. Ambio, 2018, 47(2): 116-140. DOI:10.1007/s13280-017-1004-9 |
| [2] | Zhou J, Obrist D, Dastoor A, et al. Vegetation uptake of mercury and impacts on global cycling[J]. Nature Reviews Earth & Environment, 2021, 2(4): 269-284. |
| [3] | Roberts S L, Kirk J L, Muir D C G, et al. Quantification of spatial and temporal trends in atmospheric mercury deposition across Canada over the past 30 years[J]. Environmental Science & Technology, 2021, 55(23): 15766-15775. |
| [4] | Obrist D, Agnan Y, Jiskra M, et al. Tundra uptake of atmospheric elemental mercury drives Arctic mercury pollution[J]. Nature, 2017, 547(7662): 201-204. DOI:10.1038/nature22997 |
| [5] |
马尉斌, 陈秋禹, 尹德良, 等. 三峡水库支流汝溪河河口水体汞的时空变化特征[J]. 环境科学, 2019, 40(5): 2211-2218. Ma W B, Chen Q Y, Yin D L, et al. Temporal and spatial variation of mercury in the water of the Ruxi River Estuary, a typical tributary of the Three Gorges Reservoir area[J]. Environmental Science, 2019, 40(5): 2211-2218. |
| [6] | Tripathee L, Guo J M, Kang S C, et al. Spatial and temporal distribution of total mercury in atmospheric wet precipitation at four sites from the Nepal-Himalayas[J]. Science of the Total Environment, 2019, 655: 1207-1217. DOI:10.1016/j.scitotenv.2018.11.338 |
| [7] | Sun S W, Ma M, He X B, et al. Vegetation mediated mercury flux and atmospheric mercury in the alpine permafrost region of the central Tibetan Plateau[J]. Environmental Science & Technology, 2021, 54(10): 6043-6052. |
| [8] | Yao T D, Thompson L G, Mosbrugger V, et al. Third pole environment (TPE)[J]. Environmental Development, 2012, 3: 52-64. DOI:10.1016/j.envdev.2012.04.002 |
| [9] | Mu C C, Schuster P F, Abbott B W, et al. Permafrost degradation enhances the risk of mercury release on Qinghai-Tibetan Plateau[J]. Science of the Total Environment, 2020, 708. DOI:10.1016/j.scitotenv.2019.135127 |
| [10] | Ci Z J, Peng F, Xue X, et al. Temperature sensitivity of gaseous elemental mercury in the active layer of the Qinghai-Tibet Plateau permafrost[J]. Environmental Pollution, 2018, 238: 508-515. DOI:10.1016/j.envpol.2018.02.085 |
| [11] | Paudyal R, Kang S C, Huang J, et al. Insights into mercury deposition and spatiotemporal variation in the glacier and melt water from the central Tibetan Plateau[J]. Science of the Total Environment, 2017, 599-600: 2046-2053. DOI:10.1016/j.scitotenv.2017.05.145 |
| [12] |
彭凯锋, 蒋卫国, 侯鹏, 等. 三江源国家公园植被时空变化及其影响因子[J]. 生态学杂志, 2020, 39(10): 3388-3396. Peng K F, Jiang W G, Hou P, et al. Spatiotemporal variation of vegetation coverage and its affecting factors in the Three-River-Source National Park[J]. Chinese Journal of Ecology, 2020, 39(10): 3388-3396. |
| [13] |
王根绪, 李元寿, 王一博, 等. 长江源区高寒生态与气候变化对河流径流过程的影响分析[J]. 冰川冻土, 2007, 29(2): 159-168. Wang G X, Li Y S, Wang Y B, et al. Impacts of alpine ecosystem and climate changes on surface runoff in the headwaters of the Yangtze River[J]. Journal of Glaciology and Geocryology, 2007, 29(2): 159-168. |
| [14] | Shi R J, Yang H B, Yang D W. Spatiotemporal variations in frozen ground and their impacts on hydrological components in the source region of the Yangtze River[J]. Journal of Hydrology, 2020, 590. DOI:10.1016/j.jhydrol.2020.125237 |
| [15] |
李静, 盛煜, 吴吉春, 等. 黄河源区冻土分布制图及其热稳定性特征模拟[J]. 地理科学, 2016, 36(4): 588-596. Li J, Sheng Y, Wu J C, et al. Mapping frozen soil distribution and modeling permafrost stability in the source area of the Yellow River[J]. Scientia Geographica Sinica, 2016, 36(4): 588-596. |
| [16] |
阎海鱼, 冯新斌, 商立海, 等. 天然水体中痕量汞的形态分析方法研究[J]. 分析测试学报, 2003, 22(5): 10-13. Yan H Y, Feng X B, Shang L H, et al. Speciation analysis of ultra trace levels of mercury in natural waters[J]. Journal of Instrumental Analysis, 2003, 22(5): 10-13. |
| [17] |
马小雪, 龚畅, 郭加汛, 等. 长江下游快速城市化地区水污染特征及源解析: 以秦淮河流域为例[J]. 环境科学, 2021, 42(7): 3291-3303. Ma X X, Gong C, Guo J X, et al. Water pollution characteristics and source apportionment in rapid urbanization region of the lower Yangtze River: considering the Qinhuai River catchment[J]. Environmental Science, 2021, 42(7): 3291-3303. |
| [18] | Taghvaee S, Sowlat M H, Mousavi A, et al. Source apportionment of ambient PM2.5 in two locations in central Tehran using the positive matrix factorization (PMF) model[J]. Science of the Total Environment, 2018, 628-629: 672-686. |
| [19] | Sun X J, Zhang Q G, Kang S C, et al. Mercury speciation and distribution in a glacierized mountain environment and their relevance to environmental risks in the inland Tibetan Plateau[J]. Science of the Total Environment, 2018, 631-632: 270-278. |
| [20] | Yang H D. Lake sediments may not faithfully record decline of atmospheric pollutant deposition[J]. Environmental Science & Technology, 2015, 49(21): 12607-12608. |
| [21] | Sun S W, Kang S C, Huang J, et al. Distribution and transportation of mercury from glacier to lake in the Qiangyong Glacier basin, southern Tibetan Plateau, China[J]. Journal of Environmental Sciences, 2016, 44: 213-223. |
| [22] |
王康, 康世昌, 郭军明, 等. 青藏高原纳木错流域水体总汞的时空分布特征[J]. 环境科学, 2012, 33(7): 2288-2294. Wang K, Kang S C, Guo J M, et al. Spatial and temporal distribution of total mercury (T-Hg) in different water bodies of Nam Co, Tibetan Plateau[J]. Environmental Science, 2012, 33(7): 2288-2294. |
| [23] | Li C D, Zhang Q G, Kang S C, et al. Distribution and enrichment of mercury in Tibetan lake waters and their relations with the natural environment[J]. Environmental Science and Pollution Research, 2015, 22(16): 12490-12500. |
| [24] | Zheng W, Kang S C, Feng X B, et al. Mercury speciation and spatial distribution in surface waters of the Yarlung Zangbo River, Tibet[J]. Chinese Science Bulletin, 2010, 55(24): 2697-2703. |
| [25] | Sun X J, Wang K, Kang S C, et al. The role of melting alpine glaciers in mercury export and transport: an intensive sampling campaign in the Qugaqie Basin, inland Tibetan Plateau[J]. Environmental Pollution, 2017, 220: 936-945. |
| [26] | Sun X J, Zhang Q G, Li M Y, et al. Mercury variation and export in trans-Himalayan rivers: insights from field observations in the Koshi River[J]. Science of the Total Environment, 2020, 738. DOI:10.1016/j.scitotenv.2020.139836 |
| [27] |
余骏, 张学胜, 李玉成, 等. 巢湖杭埠-丰乐河汞的污染特征及生态风险[J]. 中国环境科学, 2016, 36(8): 2487-2494. Yu J, Zhang X S, Li Y C, et al. Pollution characteristics and ecological risk of mercury in hangbu-fengle river of chaohu lake[J]. China Environmental Science, 2016, 36(8): 2487-2494. |
| [28] | Woerndle G E, Tsui M T K, Sebestyen S D, et al. New insights on ecosystem mercury cycling revealed by stable isotopes of mercury in water flowing from a headwater peatland catchment[J]. Environmental Science & Technology, 2018, 52(4): 1854-1861. |
| [29] | Emmerton C A, Graydon J A, Gareis J A L, et al. Mercury export to the arctic ocean from the Mackenzie River, Canada[J]. Environmental Science & Technology, 2013, 47(14): 7644-7654. |
| [30] | Sun S W, Kang S C, Guo J M, et al. Insights into mercury in glacier snow and its incorporation into meltwater runoff based on observations in the southern Tibetan Plateau[J]. Journal of Environmental Sciences, 2018, 68: 130-142. |
| [31] | Huang J, Kang S C, Guo J M, et al. Seasonal variations, speciation and possible sources of mercury in the snowpack of Zhadang glacier, Mt. Nyainqêntanglha, southern Tibetan Plateau[J]. Science of the Total Environment, 2012, 429: 223-230. |
| [32] | Wang Z W, Wang Q, Zhao L, et al. Mapping the vegetation distribution of the permafrost zone on the Qinghai-Tibet Plateau[J]. Journal of Mountain Science, 2016, 13(6): 1035-1046. |
| [33] | Huang J, Kang S C, Zhang Q G, et al. Spatial distribution and magnification processes of mercury in snow from high-elevation glaciers in the Tibetan Plateau[J]. Atmospheric Environment, 2012, 46: 140-146. |
| [34] | Mu C C, Zhang F, Chen X, et al. Carbon and mercury export from the Arctic rivers and response to permafrost degradation[J]. Water Research, 2019, 161: 54-60. |
| [35] | Schaefer K, Elshorbany Y, Jafarov E, et al. Potential impacts of mercury released from thawing permafrost[J]. Nature Communications, 2020, 11(1). DOI:10.1038/s41467-020-18398-5 |
| [36] |
郑雯, 刘汝海, 袁帅, 等. 夏秋季长江口邻近海域水体中颗粒态汞及溶解态汞的研究[J]. 海洋环境科学, 2020, 39(6): 817-823. Zheng W, Liu R H, Yuan S, et al. Study on particulate mercury and dissolved mercury in adjacent waters of the Yangtze River estuary in summer and autumn[J]. Marine Environmental Science, 2020, 39(6): 817-823. |
| [37] |
李贝贝, 李志威, 胡旭跃, 等. 长江源区河网纵剖面分析[J]. 山地学报, 2018, 36(3): 470-481. Li B B, Li Z W, Hu X Y, et al. Longitudinal profile of river networks in the Yangtze River source region[J]. Mountain Research, 2018, 36(3): 470-481. |
| [38] |
李伟霄, 徐军, 姚雅情, 等. 全球变暖背景下青藏高原三江源地区植被指数(NDVI)时空变化特征探讨[J]. 山地学报, 2021, 39(4): 473-482. Li W X, Xu J, Yao Y Q, et al. Temporal and spatial changes in the vegetation cover (NDVI) in the Three-River headwater region, Tibetan Plateau, China under global warming[J]. Mountain Research, 2021, 39(4): 473-482. |
| [39] |
秦小静, 孙建, 王海明. 三江源土壤养分分布特征及其对主要气候要素的响应[J]. 生态环境学报, 2015, 24(8): 1295-1301. Qin X J, Sun J, Wang H M. Distribution of soil nutrients and response to main climatic factors in Three River Source[J]. Ecology and Environment Sciences, 2015, 24(8): 1295-1301. |
| [40] | Sheng J J, Wang X P, Gong P, et al. Heavy metals of the Tibetan top soils: level, source, spatial distribution, temporal variation and risk assessment[J]. Environmental Science and Pollution Research, 2012, 19(8): 3362-3370. |
| [41] | Wu J, Duan D P, Lu J, et al. Inorganic pollution around the Qinghai-Tibet Plateau: an overview of the current observations[J]. Science of the Total Environment, 2016, 550: 628-636. |
| [42] | Li X Y, He X B, Kang S C, et al. Diurnal dynamics of minor and trace elements in stream water draining Dongkemadi Glacier on the Tibetan Plateau and its environmental implications[J]. Journal of Hydrology, 2016, 541: 1104-1118. |
| [43] |
马强, 王学谦, 宁平, 等. 大气铊污染现状及治理技术研究进展[J]. 环境化学, 2020, 39(12): 3362-3370. Ma Q, Wang X Q, Ning P, et al. Status of atmospheric thallium pollution and research progress of treatment technology[J]. Environmental Chemistry, 2020, 39(12): 3362-3370. |
| [44] |
王春霖, 张永波, 陈永亨. 重金属铊在典型排放源周边大气颗粒物中的形态及来源分析[J]. 环境保护科学, 2016, 42(2): 114-119. Wang C L, Zhang Y B, Chen Y H. Speciation and source analysis of heavy metal thallium in airborne particles around the typical pollution emission sources[J]. Environmental Protection Science, 2016, 42(2): 114-119. |
| [45] |
饶欣婷. 珠江口钡稳定同位素组成的分布特征、控制机制及其指示作用探讨[D]. 厦门: 厦门大学, 2019. Rao X T. On the distributions and controls of stable barium isotopic compositions in the Pearl River estuary and its potential as a new proxy[D]. Xiamen: Xiamen University, 2019. |
| [46] | Cao Y L, Song L, Liu L, et al. Preliminary study on strontium-rich characteristics of shallow groundwater in Dingtao Area, China[J]. Journal of Groundwater Science and Engineering, 2020, 8(3): 244-258. |
| [47] | Boryło A. Determination of uranium isotopes in environmental samples[J]. Journal of Radioanalytical and Nuclear Chemistry, 2013, 295(1): 621-631. |