 2022, Vol. 43


2. 中国科学院大学, 北京 100049;
3. 成都信息工程大学大气科学学院, 高原大气与环境四川省重点实验室, 成都 610225
2. University of Chinese Academy of Sciences, Beijing 100049, China;
3. Plateau Atmospheric and Environment Key Laboratory of Sichuan Province, School of Atmospheric Sciences, Chengdu University of Information Technology, Chengdu 610225, China
近年来, 中国近地面臭氧(O3)浓度呈逐年上升趋势, O3污染事件频繁发生, O3已成为现阶段制约环境改善的重要因素之一[1]. 2021年中国出台的“十四五”规划也将O3及其前体物列为改善空气质量重点关注的污染物[2].有研究表明, O3污染会对人类健康和生态环境等造成不利影响[3~6].挥发性有机物(volatile organic compounds, VOCs)作为O3的关键前体物, 是大气对流层中重要的痕量组分之一[7, 8].有研究证实中国大部分城市的O3污染均属于VOCs控制[5, 9, 10], 因此, 进行环境受体中VOCs的化学特征分析和来源解析对O3污染的有效防控非常关键.
当前国内外关于VOCs的研究主要包括VOCs的化学特征与来源解析、O3与二次有机气溶胶生成潜势[11~14]和健康风险评估[15~17]等方面.例如李陵等[11]对重庆市主城区VOCs进行观测与分析, 发现含氧挥发性有机物(OVOC)和烯烃对臭氧生成潜势(ozone formation potential, OFP)具有较大贡献, 当地主要VOCs来源包括二次生成源、机动车尾气源和工业排放源.黄烯茜等[15]对上海市城郊大气VOCs进行了长期采样分析, OFP计算和健康风险评估结果表明, 当地最主要的活性物种为芳香烃, VOCs的总致癌风险值高于可接受限值, 长期暴露可能有致癌风险.随着仪器设备的发展, 大量新型在线大气化学监测仪器投入使用, 使高时间分辨率、稳定、连续的VOCs数据在线观测成为可能, 如在线质量浓度(mass concentration, MC)与在线质谱(mass spectrometric, MS)技术[18]等, 这对精细化进行VOCs的化学特征分析和来源解析具有重要作用.张栋等[17]和王文美等[19]的研究利用在线测得的小时分辨率VOCs监测数据, 分析其化学特征、反应活性和污染来源, 发现烯烃和芳香烃对OFP的贡献较高, VOCs主要排放源包括汽车排放、液化石油气(LPG)/油气挥发和溶剂使用等.但是, 当前针对不同O3污染形式进行精细化的VOCs特征分析研究仍十分有限, 不利于环境受体中VOCs和O3的精细防治与管控.
北京是中国的首都, 也是中国的政治文化中心.然而, 北京市O3和VOCs污染情况不容乐观.余益军等[20]的研究发现, 北京市2013~2018年O3最大日8 h滑动平均的年均升高速率达到1.59μg·m-3, 其中污染物排放对升高速率贡献了90.4%.近年来, 对北京市环境受体中VOCs的分析研究不在少数.例如Li等[21]的研究发现汽车尾气(39.95%)、天然气/液化石油气(22.04%)和工业源(20.64%)是北京地区VOCs的主要贡献源.Zhan等[22]的研究发现烯烃和芳香烃对北京市夏季OFP的贡献分别占56.8%和30.3%. Zhang等[14]对北京市夏季VOCs进行了观测与分析, 发现乙烯、乙醛、丙烯和间/对-二甲苯对OFP的贡献最高, 工业源(30.24%)、溶剂使用(24.62%)和油气挥发(15.59%)是观测期间VOCs污染的主要来源.但是, 目前少有研究应用在线观测数据针对北京市O3污染时段和非O3污染时段进行时间精细化的VOCs特征分析.因此, 本文利用高时间分辨率的VOCs在线监测数据, 针对北京市城区2020年夏季高O3时段和低O3时段, 分析VOCs的化学特征、OFP和排放来源, 以期对北京市城区O3污染的防治与管控提供数据支持.
1 材料与方法 1.1 观测点位与采样时间监测点位于北京城区东三环北路与农展馆南路交叉口东北, 农业展览馆附近(39.94°N, 116.46°E, 图 1), 采样器距地面约4~5 m, 周围无明显遮挡物, 站点处于典型的城镇区域.根据历史空气质量监测数据, 夏季为北京市O3污染高发时期[20], 故本研究选取夏季7~8月作为典型时段进行分析.本研究的观测时段为2020年7月1日~2020年8月31日.

|
图 1 监测点位示意 Fig. 1 Map of monitoring site |
利用一套在线低温冷阱预浓缩和气相色谱质谱联用系统(GC-MS/FID)进行采样和样品分析.该系统可以自动采集空气样品并进行在线测量, 采样时间分辨率为1 h.采样期间, 对所有环境空气样品, 共定量出107种VOCs, 包括29种烷烃、11种烯烃、16种芳香烃、35种卤代烃和14种OVOC、乙炔及二硫化碳.在线监测系统的具体指标可见文献[23].采样期间严格执行质量控制与保证措施, 每日通过分析标准气体进行单点校准标样, 每周对仪器进行日常维护, 并定期远程登陆仪器在线监测平台, 检查仪器运行分析情况.
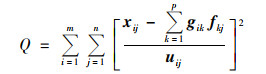
1.3 正定矩阵因子分解模型(PMF)美国环保署(Environmental Protection Agency, EPA)开发的应用广泛的PMF 5.0模型原理如下式[24, 25]:

|
式中, i为样本数, j为观测的化学物种数, p为因子数, xij为样本i中组分j的浓度, gik为第k个源对样本i的贡献, fkj为第k个排放源中组分j的含量, eij为残差.
PMF的解是根据不确定度迭代计算使目标函数Q值达到最小:
|
式中, uij为样本i中组分j的不确定度, 利用最低检测限(MDL)数据应用如下公式计算[26, 27]:

|
臭氧生成潜势(OFP)用于评估VOCs产生O3的能力.即在研究中假设不考虑其他物种的影响下, 观测的VOCs对O3形成产生的最大影响.本研究采用下式计算VOCs的OFP值[28],

|
式中, con(i)为组分i的浓度(μg·m-3), MIRi为组分i的最大增量反应性(maximum increment reactivity, MIR), 具体数据可于文献[29]查得.
2 结果与讨论 2.1 北京市夏季O3超标日分析从北京市环境保护监测中心网站提取观测期间北京市空气质量数据, 整理计算O3日最大8 h浓度平均值, 根据《环境空气质量标准》(GB 3095-2012), 将O3日最大8 h浓度平均值大于160μg·m-3的日期定为高O3浓度时段, 其余日期为低O3浓度时段, 并在后续以此分类进行分析比对.高O3浓度时段具体日期及相应O3浓度如表 1所示.
|
|
表 1 观测期间(2020年)高O3浓度时段具体日期及相应O3浓度 Table 1 Specific dates of high ozone concentration days during the observation period and the corresponding ozone concentrations in 2020 |
图 2和表 2展示了观测期间采样点的气象参数, 包括温度、相对湿度和大气压强, 表 3分别展示了O3浓度与气象参数间的相关系数.可以看出, 观测期间O3浓度与温度和相对湿度存在显著的相关性, 并且和风速存在一定的正相关关系.高O3时段伴随着较高的温度、较低的相对湿度及大气压强, 并且与气象参数的相关性更加明显.有研究表明, 太阳辐射是影响O3光化学生成的重要因素, 而强太阳辐射往往导致较高的温度, 因此温度和O3浓度间呈正相关关系[30, 31].此外, 对O3浓度的分析结果表明, 当O3小时浓度高于200μg·m-3时, 有93.5%时刻的温度高于30℃, 进一步验证了高温有利于O3的光化学反应生成.

|
图 2 观测期间气象参数 Fig. 2 Meteorological parameters during the observation period |
|
|
表 2 观测期间平均O3浓度与气象参数 Table 2 Average ozone concentration and meteorological parameters during the observation period |
|
|
表 3 观测期间O3浓度与气象参数相关性 Table 3 Correlation coefficients between ozone concentration and meteorological parameters during the observation period |
对北京市O3的历史研究结果表明[32, 33], 较高的相对湿度不利于O3的生成, 这主要由于高湿条件会促进O3的干沉降, 从而降低空气中的O3浓度; 并且在水汽充足时, 出现云的可能性较大, 消光效应衰减到达近地面的紫外辐射, 使光化学反应减弱; 同时, 高湿条件下, 水汽中·OH和HO2·等自由基能快速将O3分解为O2, 导致O3浓度降低[34].综合以上原因, 观测期间O3浓度和相对湿度间存在负相关关系.
图 3为观测期间的风玫瑰图, 圆圈内的百分数代表了不同风向的频率, 可以看出, 当地主要盛行偏南风和偏北风, 而在高O3时期, 盛行风向主要为偏南风.Li等[35]的研究发现, 每年夏季北京地区受暖季焚风的影响, 南部干燥的热空气导致该区域温度升高, 在一定程度上加速了O3生成的光化学反应, 这也与何超等[30]和欧盛菊等[32]对北京地区O3和气象因素的研究结果类似.

|
图 3 观测期间风玫瑰图 Fig. 3 Wind roses in different observation periods |
本研究将观测期间107种VOCs在线监测数据按烷烃、烯烃、炔烃、芳香烃、OVOC、卤代烃和有机硫分为7类.表 4展示了观测期间不同O3浓度时段VOCs各类体积分数和占比, 图 4给出了不同O3浓度下VOCs体积分数排名前10的组分.低O3时段φ[总大气挥发性有机物(TVOCs)]为12.33× 10⁻⁹, 排名前3的物质分别为乙烷(11.7%)、甲苯(9.7%)和二氯甲烷(8.0%); 高O3时段φ(TVOCs)较低O3时段上升9.0%, 为13.44×10⁻⁹, 排名前3的物质包括二氯甲烷(9.7%)、甲苯(7.9%)和异戊二烯(7.5%).观测期间φ(TVOCs)平均值为12.65×10⁻⁹.与低O3时段相比, 高O3时段卤代烃和OVOC的占比分别升高了5.8%和3.6%, 烷烃、烯烃和芳香烃的占比分别降低了6.9%、2.6%和3.0%, 这与王艺璇等[36]在天津市郊的观测结果相反, 天津市郊大气中的烷烃和烯烃主要来自于石化工业源和液化石油气, 而北京相关行业占比较低[21, 37].大气中卤代烃的主要来源有汽修行业和制药行业等[38, 39], OVOC则大量来自于二次转化[40, 41], 充足的光照会加快OVOC的生成, 这表明北京城区高O3浓度的发生可能与相关工业排放和气象条件的变化有关.
|
|
表 4 观测期间不同O3浓度时段VOCs各类体积分数和占比 Table 4 Volume fractions and percentages of VOC species at different ozone concentrations during the observation period |

|
图 4 观测期间不同O3浓度下VOCs体积分数排名前10的组分 Fig. 4 Top ten VOCs species with the highest volume fraction at different ozone concentrations during the observation period |
与近3年来发表的北京市VOCs研究结果相比, 如Li等[21]于2018年的研究[29.12×10⁻⁹, φ(TVOCs), 下同]、Yang等[42]于2017年的研究(30.27×10⁻⁹)、张博韬等[43]于2016年的研究(48.93×10⁻⁹)和Liu等[44]于2015年的研究(44.0×10⁻⁹), 本研究观测到的φ(TVOCs)较低(12.65×10⁻⁹), 但其中卤代烃占比明显增加, 近年来北京市城区的φ(TVOCs)整体呈下降趋势.与近3年来发表的中国其他城市夏季VOCs研究结果相比, 北京城区φ(TVOCs)处于较低水平, 近似于天津市郊[45](13.9×10-9), 低于济南市[46](29.39×10-9)、南京市[47](52.05×10-9)和上海市[48](23.8×10-9).近年来北京市采取一系列结构减排和工程减排措施, 严格执行文献[49, 50]的要求, 并出台工业涂装、汽车制造、电子和石化等工业行业系列标准和技术规范[51], 使VOCs排放水平得到了一定程度的控制.
在持续两个月的在线观测期间, 共有10个高O3浓度日期, 而7月16~22日这一周包含3个, 因此这一时期对于研究北京市城区夏季O3和VOCs的问题具有一定代表性.图 5展示了这一观测时期内O3、PM2.5、二氧化氮(NO2)和TVOC的协同变化及该时期内VOCs各组分的变化情况, 其中红色框为高O3时段, O3、PM2.5和NO2纵坐标对应浓度, TVOCs纵坐标对应体积分数.可以看出, TVOCs与NO2的变化趋势基本一致, 整体呈现夜间高午时低的特征, 与O3变化趋势相反.虽然夜间VOCs排放源减少, 但气象条件相对稳定, 污染物不易扩散[52], 且夜间VOCs与大气中自由基的反应减弱, 易造成污染物累积.白天由于太阳辐射和温度升高, O3前体物的光化学反应逐渐增加, 导致前体物浓度降低, O3浓度升高.图 5(c)和5(d)展示了两个高O3日期(7月16日和7月22日)中各污染物的协同变化, 各物质变化趋势整体与前文分析情况相同, 但是在7月22日15:00~16:00, 卤代烃体积分数的不寻常升高导致φ(TVOCs)出现高值, 这可能是由与卤代烃排放相关的汽修行业等的不规律排放造成.连续的在线观测有助于研究人员对污染物时间序列的精确分析, 并对其变化趋势进行准确判断.

|
(a)、(c)和(d)为协同变化; (b)为组分变化 图 5 观测期间主要污染物协同变化及VOCs各组分变化 Fig. 5 Synergistic changes in major pollutants and changes in each component of VOCs during the observation period |
O3前体物发生光化学反应产生的日最大值与前体物VOCs和氮氧化物(NOx)初始浓度的比值关系密切[32].通过计算VOCs与NOx的比值, 可以定性判断大气O3的生成是受VOCs控制还是NOx控制.光化学生成O3反应始于·OH与VOCs反应, 此过程中NOx和VOCs争夺·OH, 在一个特定的VOCs/NOx下, ·OH与VOCs和NOx的反应速率相等, 此时产生的O3浓度最高; 低于该比值时, ·OH和NOx反应占主导地位, O3生成对VOCs敏感, 反之对NOx敏感, VOCs/NOx临界值一般为5.5[53].本研究中污染物数据仅监测NOx中的NO2, 因此VOCs/NOx中的NOx不包括一氧化氮(NO), 使得VOCs/NOx较实际值偏高.图 6展示了观测期间VOCs和NOx初始体积分数(06:00), 结果显示, 观测期间VOCs/NOx在0.24~1.75之间, 均值为0.74, 小于5.5, 表明北京市城区·OH和NOx反应占主导地位, O3生成对VOCs敏感.

|
图 6 北京市城区观测期间VOCs与NOx初始体积分数关系 Fig. 6 Correlation between VOCs and NOx initial volume fraction during the observation period in urban areas of Beijing |
VOCs的OFP值可以合理地评估VOCs参与光化学反应生成O3的能力[21].图 7展示了观测期间不同O3浓度时段VOCs对应的OFP占比和排名前10的组分.由于异戊二烯的OFP显著高于其他组分, 故在图中单独进行分类分析.可以看出, OFP贡献前10的组分主要包括异戊二烯、甲苯、间/对-二甲苯、邻-二甲苯、乙烯、1-戊烯和1, 2, 4-三甲苯等, 前10组分及其对应的OFP贡献的相似性表明观测期间排放源的种类相对稳定.低O3时段环境受体中TVOCs对应的OFP为99.2μg·m-3, VOCs物种活性大小为:芳香烃>其他烯烃>异戊二烯>烷烃>OVOC>卤代烃>炔烃>有机硫, 其中OFP排名前3的组分分别为异戊二烯(25.0%)、甲苯(18.2%)和间/对-二甲苯(11.5%), OFP贡献前10的组分对OFP的贡献率之和达69.4%; 高O3时段OFP较低O3时段上升8.5%, 为107.6μg·m-3, VOCs物种活性大小为:芳香烃>其他烯烃>OVOC>异戊二烯>烷烃>卤代烃>炔烃>有机硫, OFP排名前3的组分相同, 均为异戊二烯(27.6%)、甲苯(15.2%)和间/对-二甲苯(8.4%), OFP贡献前10的组分对OFP的贡献率之和为68.8%, 说明夏季植被排放和与苯系物相关的溶剂使用源对O3的生成贡献较大[38, 54].因此, 对其中人为源, 即与苯系物排放相关的源的管控, 可以有效降低北京地区夏季O3浓度, 这也和Li等[21]的研究结果相似.和低O3时段相比, 高O3时段芳香烃对应的OFP占比降低了10.7%, OVOC和卤代烃对应的OFP占比升高了5.1%和4.8%, 表明光化学生成及汽修行业等卤代烃源对高O3浓度时的贡献较大, 据此可建议当地在晴朗午后对汽修等重点行业进行针对性管控, 从源头对VOCs和O3污染进行防治.

|
(a)和(c)为高O3时段, (b)和(d)为低O3时段 图 7 观测期间不同O3浓度下VOCs组分对应的OFP占比和排名前10物种 Fig. 7 Percentage of OFP corresponding to VOCs at different ozone concentrations during the observation period and the top ten species |
对O3生成中的关键组分而言, 异戊二烯主要来自于植被排放, 排放强度与温度和光照强度密切相关[54, 55].有研究表明, 机动车尾气中也含有一定浓度的异戊二烯[56, 57].图 8展示了VOCs活性组分在不同时段的体积分数小时变化, 可以看出, 不论高O3日和低O3日, 在白天都可以清楚观察到φ(异戊二烯)的峰值.同时, PMF源解析结果也表明, 环境受体中的异戊二烯84.1%来自于植被排放.农业展览馆是一座具有中国传统风格的园林式大型展览馆, 观测站点位于其中, 且东北方向为朝阳公园, 因此可以推测展览馆和公园周边的植被排放对监测站点的异戊二烯贡献较大.BTEX(苯、甲苯、乙苯和二甲苯)是溶剂使用和汽车排放等源的示踪物[58, 59].PMF源解析结果表明环境受体中的BTEX 18.4%来自于溶剂使用, 26.4%来自于汽车排放, 18.0%来自于汽修行业中的溶剂涂料等.和低O3时段相比, 高O3日中前半天φ(BTEX)较高, 而后半天φ(BTEX)较低(图 8), 这与Liu等[44]在北京城区的研究结果相似.表明在高O3时段, 从凌晨开始累积起较高的φ(BTEX), 白天这些组分在大气中发生光化学反应, 晚间较低的φ(BTEX)说明在高O3时段中有更多的苯系物在日间被消耗.因此为了降低环境受体中的O3浓度, 不仅要控制总VOCs的排放强度, 还应考虑具有高化学活性的个别物种.

|
图 8 观测期间VOCs活性组分体积分数日变化 Fig. 8 Diurnal variations in volume fractions of some reactive VOC species during the observation period |
本研究采用美国EPA PMF5.0模型对北京市夏季环境受体中VOCs在线观测数据进行源解析, 分别试验4~10个因子, 根据Q值评估和Fpeak分析, 并结合实际排放源的调研和解析因子的可解释性, 最终确定9个因子时源解析结果最佳.
PMF模型解析得到的源谱结果如图 9所示, 对其中各因子进行分析, 汽油车排放的示踪物为C2~C5烷烃和苯等[58, 60].此外, 2, 2, 4-三甲基戊烷、3-甲基戊烷和甲基环戊烷也是汽油车的潜在VOCs示踪剂[61].这些物种均在第一个因子中具有较高占比, 因此, 因子1被视为汽油车排放.环境空气源排放的背景浓度主要示踪物为氟利昂11、氟利昂113、氟利昂114和四氯化碳[62~65].氟利昂在大气中的寿命很长, 例如, 氟利昂11在大气中的寿命约为55 a[66], 故而因子2可以视作区域气团充分混合的结果——背景排放源.因子3含有较高占比的甲苯、乙苯、邻-二甲苯和间/对-二甲苯等芳香族物质, 它们是溶剂使用的示踪物[58, 59, 67], 常用于油漆涂料、板材装饰和化工溶剂等.因子4的主要示踪物为二氯甲烷、二氯乙烷和二氯丙烷等卤代烃.二氯甲烷是一种以高溶解性能著称的多功能和强力的氯化物溶剂, 常用于汽修行业中的脱除涂料、金属清洗和抛光, 也在制药行业、化工行业中作为加工溶剂被广泛使用[38, 39].但制药行业通常也排放一定比例的苯系物[68], 且二氯乙烷、二氯丙烷也是汽修行业排放VOCs的主要组分[69, 70], 故而此因子判定为汽修行业.丁酮是正丁烷和异戊烷的氧化产物, 是典型二次生成源的示踪剂[71, 72], 故因子5可以被识别为二次生成源.氯甲烷是环境中最丰富的卤代烃, 是生物质燃烧源特有的排放物种[73~75], 故因子6被识别为生物质燃烧源.印刷行业的示踪物为乙酸乙酯.乙酸乙酯是一种用途广泛的精细化工产品, 可用于溶解硝化纤维素、油墨和油脂等, 广泛用于油墨、胶粘剂等的生产中, 是胶版印刷和凹版印刷工艺中最丰富的化合物之一[76].故而因子7被识别为印刷行业.因子8含有较高占比的2, 3-二甲基丁烷, 以及一定组分的乙烷、丙烷.Song等[61]研究了以汽油为燃料和以液化天然气(liquefied natural gas, LNG)为燃料的汽车的VOCs排放, 结果表明, 2, 3-二甲基丁烷是区分LNG燃料车辆和汽油车的关键示踪剂.第9个因子被识别为植被排放, 其代表示踪物为异戊二烯[54, 55], 且该因子贡献的日变化随时间变化, 在午后达到峰值.与近年来北京市VOCs源解析研究结果相比[14, 21, 42, 44, 77~80], 本研究定量解析出之前少有研究的贡献源——背景排放、二次生成和印刷行业, 这与在线观测仪器对卤代烃和OVOC的有效监测有关, 表明多方法在线观测手段对VOCs源解析等研究的开展具有良好的促进作用.

|
①乙烷, ②丙烷, ③异丁烷, ④乙烯, ⑤反-2-戊烯, ⑥1-戊烯, ⑦异戊二烯, ⑧甲基环戊烷, ⑨己烷, ⑩ 3-甲基戊烷, ⑪ 2-甲基戊烷, ⑫ 2, 3-二甲基丁烷, ⑬甲基环己烷, ⑭正庚烷, ⑮ 3-甲基己烷, ⑯ 2-甲基己烷, ⑰ 2, 4-二甲基戊烷, ⑱ 2, 3, 4-三甲基戊烷, ⑲ 2, 2, 4-三甲基戊烷, ⑳ 1-己烯, ㉑乙炔, ㉒苯, ㉓甲苯, ㉔乙苯, ㉕邻-二甲苯, ㉖间/对-二甲苯, ㉗乙烯, ㉘ 1, 2, 4-三甲基苯, ㉙ 1, 2, 3-三甲基甲苯, ㉚间-乙基甲苯, ㉛对-乙基甲苯, ㉜二硫化碳, ㉝ 2-丁酮, ㉞ 4-甲基-2-戊酮, ㉟乙酸乙酯, ㊱氟利昂11, ㊲氟利昂114, ㊳氟利昂113, ㊴四氯化碳, ㊵二氯甲烷, ㊶氯甲烷, ㊷三氯甲烷, ㊸ 1, 1, 2-三氯乙烷, ㊹ 1, 2-二氯乙烷, ㊺ 1, 1-二氯乙烷, ㊻氯乙烷, ㊼ 1, 2-二氯丙烷, ㊽四氯乙烯, ㊾顺-1, 2-二氯乙烯 图 9 北京城区夏季VOCs源谱 Fig. 9 VOCs source profiles in Beijing urban areas in summer |
不同时期各源类对环境受体中VOCs贡献的相对比例如图 10所示.低O3时段中对VOCs贡献占比由高到低的源依次为: 汽车排放(26.4%)、背景排放(15.7%)、溶剂使用(13.0%)、汽修(12.8%)、二次生成源(9.7%)、生物质燃烧(6.1%)、印刷行业(5.7%)、LNG燃料车(5.5%)和植被排放(5.0%).与低O3时段相比, 高O3时段中汽修和二次生成源的占比有明显上升, 分别升高了3.4%和2.6%.源解析结果表明, 汽车排放仍是北京城区最主要的VOCs贡献源, 但是在高O3浓度时期, 汽修源和与光化学反应相关的二次生成源的贡献有显著提升.

|
图 10 观测期间不同O3浓度下各排放源对VOCs贡献 Fig. 10 Contribution of each emission source to VOCs at different ozone concentrations during the observation period |
图 11展示了北京城区不同O3浓度时段VOCs源贡献率的日变化.可以看出, 汽车排放和LNG燃料车排放源呈现早晚高峰特征, 下午时的贡献相对较低.背景排放源的贡献变化较小, 再次印证了对该排放源的正确识别.植被排放源从07:00开始上升, 在午后达到最高, 这与太阳辐射和大气温度的日变化密切相关.

|
图 11 北京城区不同O3浓度时段VOCs源贡献率日变化 Fig. 11 Daily variation in VOCs source contribution at different O3 concentrations in Beijing urban area |
(1) 观测期间监测点φ(TVOCs)为12.65×10⁻⁹, 高O3时段和低O3时段φ(TVOCs)分别为13.44×10⁻⁹和12.33×10⁻⁹, 对应的OFP分别为107.6μg·m-3和99.2μg·m-3.观测期间芳香烃的反应活性最高, 对OFP贡献排名前三的组分均为异戊二烯、甲苯和间/对-二甲苯.与低O3时段相比, 高O3时段芳香烃对应的OFP占比降低了10.7%, OVOC和卤代烃对应的OFP占比升高了5.1%和4.8%.
(2) 观测期间VOCs/NOx均值为0.74, 小于5.5, 表明北京市城区·OH和NOx反应占主导地位, O3生成对VOCs敏感.异戊二烯和苯系物BTEX是对O3生成贡献较大的VOCs活性组分, 环境受体中的异戊二烯84.1%来自于植被排放.BTEX 18.4%来自于溶剂使用, 26.4%来自于汽车排放, 18.0%来自于汽修行业中的溶剂涂料等.
(3) 低O3时段环境受体中VOCs的主要来源包括汽车排放(26.4%)、背景排放(15.7%)、溶剂使用(13.0%)、汽修(12.8%)、二次生成源(9.7%)、生物质燃烧(6.1%)、印刷行业(5.7%)、LNG燃料车(5.5%)和植被排放(5.0%), 高O3时段汽修源和二次生成源贡献分别较低O3时段上升了3.4%和2.6%, 汽车排放是北京城区最主要的VOCs贡献源.
(4) 基于在线观测手段, 本研究定量解析出背景排放、二次生成和印刷行业源对夏季北京城区VOCs的贡献.汽车排放和LNG燃料车排放源呈现早晚高峰特征, 下午时贡献相对较低.背景排放源的贡献变化较小.植被排放源从07:00开始上升, 在午后达到最高, 这与太阳辐射和大气温度的日变化密切相关.
| [1] | 张远航, 郑君瑜, 陈长虹, 等. 中国大气臭氧污染防治蓝皮书(2020)[EB/OL]. https://img74.hbzhan.com/4/20201016/637384586133551705645.pdf, 2020-10-16. |
| [2] | 新华社. 中华人民共和国国民经济和社会发展第十四个五年规划和2035年远景目标纲要[EB/OL]. http://www.gov.cn/xinwen/2021-03/13/content_5592681.htm, 2021-03-12. |
| [3] | Unger N, Bond T C, Wang J S, et al. Attribution of climate forcing to economic sectors[J]. Proceedings of the National Academy of Sciences of the United States of America, 2010, 107(8): 3382-3387. DOI:10.1073/pnas.0906548107 |
| [4] | Anenberg S C, Miller J, Minjares R, et al. Impacts and mitigation of excess diesel-related NOx emissions in 11 major vehicle markets[J]. Nature, 2017, 545(7655): 467-471. DOI:10.1038/nature22086 |
| [5] | Feng Z Z, Kobayashi K, Li P, et al. Impacts of current ozone pollution on wheat yield in China as estimated with observed ozone, meteorology and day of flowering[J]. Atmospheric Environment, 2019, 217. DOI:10.1016/j.atmosenv.2019.116945 |
| [6] | Lim C C, Hayes R B, Ahn J, et al. Long-term exposure to ozone and cause-specific mortality risk in the United States[J]. American Journal of Respiratory and Critical Care Medicine, 2019, 200(8): 1022-1031. DOI:10.1164/rccm.201806-1161OC |
| [7] | Geng F H, Zhao C S, Tang X, et al. Analysis of ozone and VOCs measured in Shanghai: a case study[J]. Atmospheric Environment, 2007, 41(5): 989-1001. DOI:10.1016/j.atmosenv.2006.09.023 |
| [8] | Volkamer R, Jimenez J L, San Martini F, et al. Secondary organic aerosol formation from anthropogenic air pollution: rapid and higher than expected[J]. Geophysical Research Letters, 2006, 33(17). DOI:10.1029/2006GL026899 |
| [9] | Li K W, Chen L H, Ying F, et al. Meteorological and chemical impacts on ozone formation: a case study in Hangzhou, China[J]. Atmospheric Research, 2017, 196: 40-52. DOI:10.1016/j.atmosres.2017.06.003 |
| [10] |
庄立跃. 中国三大城市群近地面臭氧污染特征及其敏感性研究[D]. 广州: 华南理工大学, 2019. Zhuang L Y. Ground level ozone concentration characteristics and formation sensitivity in China's three agglomerations[D]. Guangzhou: South China University of Technology, 2019. |
| [11] |
李陵, 李振亮, 张丹, 等. 重庆市主城区O3污染时期大气VOCs污染特征及来源解析[J]. 环境科学, 2021, 42(8): 3595-3603. Li L, Li Z L, Zhang D, et al. Pollution characteristics and source apportionment of atmospheric VOCs during ozone pollution period in the main urban area of Chongqing[J]. Environmental Science, 2021, 42(8): 3595-3603. |
| [12] |
徐晨曦, 陈军辉, 姜涛, 等. 成都市区夏季大气挥发性有机物污染特征及来源解析[J]. 环境科学, 2020, 41(12): 5316-5324. Xu C X, Chen J H, Jiang T, et al. Characteristics and sources of atmospheric volatile organic compounds pollution in summer in Chengdu[J]. Environmental Science, 2020, 41(12): 5316-5324. |
| [13] |
安俊琳, 朱彬, 王红磊, 等. 南京北郊大气VOCs变化特征及来源解析[J]. 环境科学, 2014, 35(12): 4454-4464. An J L, Zhu B, Wang H L, et al. Characteristics and source apportionment of volatile organic compounds (VOCs) in the northern suburb of Nanjing[J]. Environmental Science, 2014, 35(12): 4454-4464. |
| [14] | Zhang C, Liu X G, Zhang Y Y, et al. Characteristics, source apportionment and chemical conversions of VOCs based on a comprehensive summer observation experiment in Beijing[J]. Atmospheric Pollution Research, 2020, 12(3): 230-241. |
| [15] |
黄烯茜, 廖浩祥, 周勇, 等. 上海城郊大气挥发性有机物污染特征、活性组分及风险评估[J]. 环境污染与防治, 2020, 42(2): 194-198, 203. Huang X Q, Liao H X, Zhou Y, et al. Volatile organic compounds in suburban atmosphere in Shanghai: pollution characterization, activity and health risk[J]. Environmental Pollution and Control, 2020, 42(2): 194-198, 203. |
| [16] | Liang B, Yu X, Mi H P, et al. Health risk assessment and source apportionment of VOCs inside new vehicle cabins: a case study from Chongqing, China[J]. Atmospheric Pollution Research, 2019, 10(5): 1677-1684. DOI:10.1016/j.apr.2019.06.008 |
| [17] |
张栋, 于世杰, 王楠, 等. 郑州市冬季VOCs污染特征、来源及健康风险评估[J]. 环境科学学报, 2020, 40(8): 2935-2943. Zhang D, Yu S J, Wang N, et al. Characteristics, sources and health risk assessment of ambient VOCs in winter of Zhengzhou[J]. Acta Scientiae Circumstantiae, 2020, 40(8): 2935-2943. |
| [18] | Wang F, Yu H F, Wang Z Y, et al. Review of online source apportionment research based on observation for ambient particulate matter[J]. Science of the Total Environment, 2021, 762. DOI:10.1016/j.scitotenv.2020.144095 |
| [19] |
王文美, 高璟赟, 肖致美, 等. 天津市夏季不同臭氧浓度级别VOCs特征及来源[J]. 环境科学, 2021, 42(8): 3585-3594. Wang W M, Gao J Y, Xiao Z M, et al. Characteristics and sources of VOCs at different ozone concentration levels in Tianjin[J]. Environmental Science, 2021, 42(8): 3585-3594. |
| [20] |
余益军, 孟晓艳, 王振, 等. 京津冀地区城市臭氧污染趋势及原因探讨[J]. 环境科学, 2020, 41(1): 106-114. Yu Y J, Meng X Y, Wang Z, et al. Driving factors of the significant increase in surface ozone in the Beijing-Tianjin-Hebei region, China, During 2013-2018[J]. Environmental Science, 2020, 41(1): 106-114. |
| [21] | Li C L, Liu Y F, Cheng B F, et al. A comprehensive investigation on volatile organic compounds (VOCs) in 2018 in Beijing, China: characteristics, sources and behaviours in response to O3 formation[J]. Science of the Total Environment, 2021, 806. DOI:10.1016/j.scitotenv.2021.150247 |
| [22] | Zhan J L, Feng Z M, Liu P F, et al. Ozone and SOA formation potential based on photochemical loss of VOCs during the Beijing summer[J]. Environmental Pollution, 2021, 285. DOI:10.1016/j.envpol.2021.117444 |
| [23] |
邓媛元, 李晶, 李亚琦, 等. 成都双流夏秋季环境空气中VOCs污染特征[J]. 环境科学, 2018, 39(12): 5323-5333. Deng Y Y, Li J, Li Y Q, et al. Characteristics of ambient VOCs at the Shuangliu site in Chengdu, China, during summer and autumn[J]. Environmental Science, 2018, 39(12): 5323-5333. |
| [24] | Paatero P. Least squares formulation of robust non-negative factor analysis[J]. Chemometrics and Intelligent Laboratory Systems, 1997, 37(1): 23-35. DOI:10.1016/S0169-7439(96)00044-5 |
| [25] | Paatero P, Tapper U. Positive matrix factorization: a non-negative factor model with optimal utilization of error estimates of data values[J]. Environmetrics, 1994, 5(2): 111-126. DOI:10.1002/env.3170050203 |
| [26] | Norris G, Duvall R, Brown S, et al. EPA Positive Matrix Factorization (PMF) 5.0 fundamentals and user guide[R]. Washington, DC: U.S. Environmental Protection Agency, Office of Research and Development, 2014. |
| [27] | Ito K, Xue N, Thurston G. Spatial variation of PM2.5 chemical species and source-apportioned mass concentrations in New York city[J]. Atmospheric Environment, 2004, 38(31): 5269-5282. DOI:10.1016/j.atmosenv.2004.02.063 |
| [28] | Carter W P L. Development of ozone reactivity scales for volatile organic compounds[J]. Air & Waste, 1994, 44(7): 881-899. |
| [29] | Carter W P L. Updated maximum incremental reactivity scale and hydrocarbon bin reactivities for regulatory applications[R]. Riverside, CA: California Air Resources Board, 2010. |
| [30] |
何超, 慕航, 杨璐, 等. 中国暖季近地面臭氧浓度空间格局演变及主要气象驱动因素[J]. 环境科学, 2021, 42(9): 4168-4179. He C, Mu H, Yang L, et al. Spatial variation of surface ozone concentration during the warm season and its meteorological driving factors in China[J]. Environmental Science, 2021, 42(9): 4168-4179. |
| [31] |
杨显玉, 易家俊, 吕雅琼, 等. 成都市及周边地区严重臭氧污染过程成因分析[J]. 中国环境科学, 2020, 40(5): 2000-2009. Yang X Y, Yi J J, Lü Y Q, et al. Characteristics and formation mechanism of a severe O3 episode in Chengdu and surrounding areas[J]. China Environmental Science, 2020, 40(5): 2000-2009. DOI:10.3969/j.issn.1000-6923.2020.05.017 |
| [32] |
欧盛菊, 魏巍, 王晓琦, 等. 华北地区典型重工业城市夏季近地面O3污染特征及敏感性[J]. 环境科学, 2020, 41(7): 3085-3094. Ou S J, Wei W, Wang X Q, et al. Pollution characteristics and sensitivity of surface ozone in a typical heavy-industry city of the north China plain in summer[J]. Environmental Science, 2020, 41(7): 3085-3094. |
| [33] |
安俊琳, 王跃思, 孙扬. 气象因素对北京臭氧的影响[J]. 生态环境学报, 2009, 18(3): 944-951. An J L, Wang Y S, Sun Y. Assessment of ozone variations and meteorological effects in Beijing[J]. Ecology and Environmental Sciences, 2009, 18(3): 944-951. DOI:10.3969/j.issn.1674-5906.2009.03.027 |
| [34] |
张莉, 王冠, 陈震, 等. 唐山O3浓度时空变化特征及气象影响分析研究[J]. 环境科学与管理, 2019, 44(7): 25-30. Zhang L, Wang G, Chen Z, et al. Temporal and spatial variation characteristics and meteorological impact analysis of O3 concentration in Tangshan[J]. Environmental Science and Management, 2019, 44(7): 25-30. DOI:10.3969/j.issn.1673-1212.2019.07.006 |
| [35] | Li K, Jacob D J, Shen L, et al. Increases in surface ozone pollution in China from 2013 to 2019: anthropogenic and meteorological influences[J]. Atmospheric Chemistry and Physics, 2020, 20(19): 11423-11433. DOI:10.5194/acp-20-11423-2020 |
| [36] |
王艺璇, 刘保双, 吴建会, 等. 天津市郊夏季VOCs化学特征及其时间精细化的来源解析[J]. 环境科学, 2021, 42(12): 5644-5655. Wang Y X, Liu B S, Wu J H, et al. Chemical characteristics and source apportionment with temporal refinement for VOCs in Tianjin suburb in summer[J]. Environmental Science, 2021, 42(12): 5644-5655. |
| [37] | Wei W, Ren Y T, Yang G, et al. Characteristics and source apportionment of atmospheric volatile organic compounds in Beijing, China[J]. Environmental Monitoring and Assessment, 2019, 191(12). DOI:10.1007/s10661-019-7813-5 |
| [38] | Lyu X, Guo H, Wang Y, et al. Hazardous volatile organic compounds in ambient air of China[J]. Chemosphere, 2020, 246. DOI:10.1016/j.chemosphere.2019.125731 |
| [39] |
钱益斌, 钟昌琴, 杨安富, 等. 海南某化工园区大气VOCs组成、来源及健康风险[J]. 环境科学与技术, 2020, 43(5): 115-123. Qian Y B, Zhong C Q, Yang A F, et al. Characteristics, source apportionment and health risk assessment of volatile organic compounds in the atmosphere of a chemical industrial park in Hainan[J]. Environmental Science & Technology, 2020, 43(5): 115-123. |
| [40] | Chen W T, Shao M, Lu S H, et al. Understanding primary and secondary sources of ambient carbonyl compounds in Beijing using the PMF model[J]. Atmospheric Chemistry and Physics, 2014, 14(6): 3047-3062. DOI:10.5194/acp-14-3047-2014 |
| [41] |
王琴, 邵敏, 魏强, 等. 北京及周边地区大气羰基化合物的时空分布特征初探[J]. 环境科学, 2011, 32(12): 3522-3530. Wang Q, Shao M, Wei Q, et al. Spatial and temporal variations of ambient carbonyl compounds in Beijing and its surrounding areas[J]. Environmental Science, 2011, 32(12): 3522-3530. |
| [42] | Yang S D, Li X, Song M D, et al. Characteristics and sources of volatile organic compounds during pollution episodes and clean periods in the Beijing-Tianjin-Hebei region[J]. Science of the Total Environment, 2021, 799. DOI:10.1016/j.scitotenv.2021.149491 |
| [43] |
张博韬, 安欣欣, 王琴, 等. 2015年北京大气VOCs时空分布及反应活性特征[J]. 环境科学, 2018, 39(10): 4400-4407. Zhang B T, An X X, Wang Q, et al. Temporal variation, spatial distribution, and reactivity characteristics of air VOCs in Beijing 2015[J]. Environmental Science, 2018, 39(10): 4400-4407. |
| [44] | Liu Y F, Song M D, Liu X G, et al. Characterization and sources of volatile organic compounds (VOCs) and their related changes during ozone pollution days in 2016 in Beijing, China[J]. Environmental Pollution, 2020, 257. DOI:10.1016/j.envpol.2019.113599 |
| [45] |
罗瑞雪, 刘保双, 梁丹妮, 等. 天津市郊夏季的臭氧变化特征及其前体物VOCs的来源解析[J]. 环境科学, 2021, 42(1): 75-87. Luo R X, Liu B S, Liang D N, et al. Characteristics of ozone and source apportionment of the precursor VOCs in Tianjin suburbs in summer[J]. Environmental Science, 2021, 42(1): 75-87. |
| [46] |
高素莲, 闫学军, 刘光辉, 等. 济南市夏季臭氧重污染时段VOCs污染特征及来源解析[J]. 生态环境学报, 2020, 29(9): 1839-1846. Gao S L, Yan X J, Liu G H, et al. Characteristics and source apportionment of ambient VOCs in serious ozone pollution period of summer in Ji'nan[J]. Ecology and Environmental Sciences, 2020, 29(9): 1839-1846. |
| [47] |
杨笑笑, 汤莉莉, 张运江, 等. 南京夏季市区VOCs特征及O3生成潜势的相关性分析[J]. 环境科学, 2016, 37(2): 443-451. Yang X X, Tang L L, Zhang Y J, et al. Correlation analysis between characteristics of VOCs and ozone formation potential in summer in Nanjing urban district[J]. Environmental Science, 2016, 37(2): 443-451. DOI:10.3969/j.issn.1000-6923.2016.02.021 |
| [48] | Liu Y H, Wang H L, Jing S G, et al. Characteristics and sources of volatile organic compounds (VOCs) in Shanghai during summer: implications of regional transport[J]. Atmospheric Environment, 2019, 215. DOI:10.1016/j.atmosenv.2019.116902 |
| [49] | 北京市人民政府办公厅. 北京市人民政府办公厅关于印发市发展改革委等部门制定的《北京市新增产业的禁止和限制目录(2018年版)》的通知[EB/OL]. http://www.beijing.gov.cn/zhengce/zhengcefagui/201905/t20190522_61514.html, 2018-09-26. |
| [50] | 北京市人民政府办公厅. 北京市人民政府办公厅关于印发《北京市工业污染行业生产工艺调整退出及设备淘汰目录(2017年版)》的通知[EB/OL]. http://www.beijing.gov.cn/zhengce/zhengcefagui/201905/t20190522_60404.html, 2017-07-18. |
| [51] | 北京市生态环境局. 结构调整、工程治理、精细化管理减排并重北京市工业领域VOCs治理成效明显[EB/OL]. http://sthjj.beijing.gov.cn/bjhrb/index/xxgk69/zfxxgk43/fdzdgknr2/xwfb/10891012/index.html, 2020-11-19. |
| [52] |
杨晓旻, 施双双, 张晨, 等. 南京市黑碳气溶胶时间演变特征及其主要影响因素[J]. 环境科学, 2020, 41(2): 620-629. Yang X M, Shi S S, Zhang C, et al. Temporal evolution and main influencing factors of black carbon aerosol in Nanjing[J]. Environmental Science, 2020, 41(2): 620-629. |
| [53] | 唐孝炎, 张远航, 邵敏. 大气环境化学[M]. (第二版). 北京: 高等教育出版社, 2006. |
| [54] | Mo Z W, Shao M, Wang W J, et al. Evaluation of biogenic isoprene emissions and their contribution to ozone formation by ground-based measurements in Beijing, China[J]. Science of the Total Environment, 2018, 627: 1485-1494. DOI:10.1016/j.scitotenv.2018.01.336 |
| [55] | Watson J G, Chow J C, Fujita E M. Review of volatile organic compound source apportionment by chemical mass balance[J]. Atmospheric Environment, 2001, 35(9): 1567-1584. DOI:10.1016/S1352-2310(00)00461-1 |
| [56] | Christensen C S, Skov H, Palmgren F. C5-C8 non-methane hydrocarbon measurements in Copenhagen: concentrations, sources and emission estimates[J]. Science of the Total Environment, 1999, 236(1-3): 163-171. DOI:10.1016/S0048-9697(99)00274-0 |
| [57] | Wagner P, Kuttler W. Biogenic and anthropogenic isoprene in the near-surface urban atmosphere — a case study in Essen, Germany[J]. Science of the Total Environment, 2014, 475: 104-115. DOI:10.1016/j.scitotenv.2013.12.026 |
| [58] | Guo H, Wang T, Louie P K K. Source apportionment of ambient non-methane hydrocarbons in Hong Kong: application of a principal component analysis/absolute principal component scores (PCA/APCS) receptor model[J]. Environmental Pollution, 2004, 129(3): 489-498. DOI:10.1016/j.envpol.2003.11.006 |
| [59] | Yuan B, Shao M, Lu S H, et al. Source profiles of volatile organic compounds associated with solvent use in Beijing, China[J]. Atmospheric Environment, 2010, 44(15): 1919-1926. DOI:10.1016/j.atmosenv.2010.02.014 |
| [60] | Grosjean E, Rasmussen R A, Grosjean D. Toxic air contaminants in Porto Alegre, Brazil[J]. Environmental Science & Technology, 1999, 33(12): 1970-1978. |
| [61] | Song C B, Liu Y, Sun L N, et al. Emissions of volatile organic compounds (VOCs) from gasoline- and liquified natural gas (LNG)-fueled vehicles in tunnel studies[J]. Atmospheric Environment, 2020, 234. DOI:10.1016/j.atmosenv.2020.117626 |
| [62] | Kim E, Brown S G, Hafner H R, et al. Characterization of non-methane volatile organic compounds sources in Houston during 2001 using positive matrix factorization[J]. Atmospheric Environment, 2005, 39(32): 5934-5946. DOI:10.1016/j.atmosenv.2005.06.045 |
| [63] | Liu Y, Shao M, Fu L L, et al. Source profiles of volatile organic compounds (VOCs) measured in China: Part I[J]. Atmospheric Environment, 2008, 42(25): 6247-6260. DOI:10.1016/j.atmosenv.2008.01.070 |
| [64] | Ling Z H, Guo H, Cheng H R, et al. Sources of ambient volatile organic compounds and their contributions to photochemical ozone formation at a site in the Pearl River Delta, southern China[J]. Environmental Pollution, 2011, 159(10): 2310-2319. DOI:10.1016/j.envpol.2011.05.001 |
| [65] | Saeaw N, Thepanondh S. Source apportionment analysis of airborne VOCs using positive matrix factorization in industrial and urban areas in Thailand[J]. Atmospheric Pollution Research, 2015, 6(4): 644-650. DOI:10.5094/APR.2015.073 |
| [66] | Elkins J, Thompson T M, Swanson T H, et al. Decrease in the growth rates of atmospheric chlorofluorocarbons 11 and 12[J]. Nature, 1993, 364(6440): 780-783. DOI:10.1038/364780a0 |
| [67] | Choi E, Choi K, Yi S M. Non-methane hydrocarbons in the atmosphere of a Metropolitan City and a background site in South Korea: sources and health risk potentials[J]. Atmospheric Environment, 2011, 45(40): 7563-7573. DOI:10.1016/j.atmosenv.2010.11.049 |
| [68] | Cheng N N, Jing D J, Zhang C, et al. Process-based VOCs source profiles and contributions to ozone formation and carcinogenic risk in a typical chemical synthesis pharmaceutical industry in China[J]. Science of the Total Environment, 2021, 752. DOI:10.1016/j.scitotenv.2020.141899 |
| [69] |
李洁, 谢轶嵩. 南京市汽车维修行业VOCs成分谱及臭氧生成潜势[J]. 中国环境管理干部学院学报, 2018, 28(5): 75-77. Li J, Xie Y S. Source profiles and ozone formation potential of volatile organic compounds from automobile maintenance industry in Nanjing[J]. Journal of EMCC, 2018, 28(5): 75-77. |
| [70] |
方莉, 刘继业, 聂磊, 等. 北京市典型汽修企业VOCs排放特征与臭氧影响分析[J]. 环境工程, 2020, 38(10): 146-150, 155. Fang L, Liu J Y, Nie L, et al. VOCs emission characteristics and ozone impact analysis of typical automobile repair enterprises in Beijing[J]. Environmental Engineering, 2020, 38(10): 146-150, 155. |
| [71] | Pang X B, Mu Y J, Zhang Y J, et al. Contribution of isoprene to formaldehyde and ozone formation based on its oxidation products measurement in Beijing, China[J]. Atmospheric environment, 2009, 43(13): 2142-2147. DOI:10.1016/j.atmosenv.2009.01.022 |
| [72] | Kota S H, Park C, Hale M C, et al. Estimation of VOC emission factors from flux measurements using a receptor model and footprint analysis[J]. Atmospheric Environment, 2014, 82: 24-35. |
| [73] | Li S L, Park M K, Jo C O, et al. Emission estimates of methyl chloride from industrial sources in China based on high frequency atmospheric observations[J]. Journal of Atmospheric Chemistry, 2017, 74(2): 227-243. |
| [74] | Blake N J, Blake D R, Sive B C, et al. Biomass burning emissions and vertical distribution of atmospheric methyl halides and other reduced carbon gases in the South Atlantic region[J]. Journal of Geophysical Research, 1996, 101(D19): 24151-24164. |
| [75] | Guo H, Ding A J, Wang T, et al. Source origins, modeled profiles, and apportionments of halogenated hydrocarbons in the greater Pearl River Delta region, southern China[J]. Journal of Geophysical Research, 2009, 114(S11). DOI:10.1029/2008JD011448 |
| [76] | Zheng J Y, Yu Y F, Mo Z W, et al. Industrial sector-based volatile organic compound (VOC) source profiles measured in manufacturing facilities in the Pearl River Delta, China[J]. Science of the Total Environment, 2013, 456-457: 127-136. |
| [77] | Wang G, Cheng S Y, Wei W, et al. Characteristics and source apportionment of VOCs in the suburban area of Beijing, China[J]. Atmospheric Pollution Research, 2016, 7(4): 711-724. |
| [78] |
刘丹, 解强, 张鑫, 等. 北京冬季雾霾频发期VOCs源解析及健康风险评价[J]. 环境科学, 2016, 37(10): 3693-3701. Liu D, Xie Q, Zhang X, et al. Source apportionment and health risk assessment of VOCs during the haze period in the winter in Beijing[J]. Environmental Science, 2016, 37(10): 3693-3701. |
| [79] | Zhang H, Li H, Zhang Q Z, et al. Atmospheric volatile organic compounds in a typical urban area of Beijing: pollution characterization, health risk assessment and source apportionment[J]. Atmosphere, 2017, 8(3). DOI:10.3390/atmos8030061 |
| [80] | Wei W, Ren Y T, Yang G, et al. Characteristics and source apportionment of atmospheric volatile organic compounds in Beijing, China[J]. Environmental Monitoring and Assessment, 2019, 191(12). DOI:10.1007/s10661-019-7813-5 |