 2022, Vol. 43


2. 天津理工大学环境科学与安全工程学院, 天津 300384;
3. 山东省淄博生态环境监测中心, 淄博 255000
2. College of Environmental Science & Safety Engineering, Tianjin University of Technology, Tianjin 300384, China;
3. Shandong Zibo Eco-Environmental Monitoring Center, Zibo 255000, China
“十三五”期间, 我国重点区域细颗粒物(PM2.5)浓度明显下降, 而臭氧(O3)浓度升高成为影响空气质量改善的重要因素[1], PM2.5和O3之间具有复杂的关联性, 二者的协同治理也成为我国打赢蓝天保卫战的关键[2].挥发性有机物(volatile organic compounds, VOCs)在大气光化学反应中扮演着极其重要的角色, 是O3和二次有机气溶胶(secondary organic aerosols formation, SOA)生成的重要前体物[3~5], 对光化学烟雾和霾污染治理有着不可忽视的作用.此外, 加拿大、美国和其他国际机构将多种VOCs物种认定为有害空气污染物, 会对人体产生致癌作用[6].城市环境空气中的VOCs主要来自人为源和自然源, 受各种工业活动、交通排放、燃料燃烧和植被挥发释放影响[7].正是因为VOCs来源的复杂性, 使得VOCs治理工作有一定难度, 文献[8]旨在重点区域加强监督管理, 有针对性的进行管控, 有效改善空气质量.
我国针对VOCs开展了大量研究, 研究地点集中在京津冀[9~11]、长三角[12~14]、珠三角[15~17]和成渝地区[18~20], 研究内容主要包括污染特征[13, 19, 20], 来源解析[11~14]和健康风险评价[12, 15, 21].本研究地点位于我国山东省淄博市, 是文献[8]中提到的重点城市之一, 是典型的重工业城市, 石油化工、建材和医药等行业, 均排放大量VOCs物质[22].相关学者也对当地大气污染开展了研究, 王雨燕等[22]研究了当地重点工业行业VOCs的排放特征, 计算出各重点行业的主要排放环节; 吴丽萍等[23]的研究发现, 该市近地面O3月变化呈双峰型, 日变化呈单峰型, 白天和夜间分别受区域和局地污染影响较大; Li等[24]的研究发现, 其雾、霾期间PM2.5浓度比雾、霾前高76.78%, 燃煤和机动车排放是主要来源.但对不同O3污染情况下环境VOCs的相关研究较少.本研究在淄博市城区开展VOCs连续监测, 分析不同O3污染情况下VOCs的污染特征、化学反应活性和污染成因, 探讨VOCs对大气复合污染的影响, 以期为类似重工业城市O3和PM2.5协同治理提供借鉴.
1 材料与方法 1.1 观测场地与观测时间本研究选取淄博市的城区监测站点(117.90°E, 36.82°N)开展大气VOCs在线监测, 监测时间为2020年7月1~31日.监测站点东边和北边建有学校和医院, 周边还有大量居住区, 毗邻交通主干道和一条河流, 周边无明显局地排放源, 可以很好地反映一定区域范围内的大气污染状况.
1.2 仪器设备采用美国热电公司生产的Thermo Fisher 5900在线气相色谱分析仪, 系统时间分辨率为1 h, 采样开始前, 采样泵用样品气吹扫采样管线2 min, 此时富集管冷却至30℃, 随后开始采样.采样时, 环境空气进入吸附管, 至富集管内通过500 mL气体后停止, 经除水后进入富集管冲洗并加热, 随后管中吸附的物质被蒸发吹进气相色谱仪(GC)中的毛细色谱柱进行分离, 最后进入火焰离子化检测器(FID)进行检测, 将检测物质的出峰面积与校准气峰面积比较得到测量结果[25].共检测出烷烃类物质29种, 烯烃类10种, 炔烃类为乙炔, 芳香烃类16种, 共计56种VOCs物质(实际检测出57种, 间-二甲苯和对-二甲苯合称为间/对-二甲苯, 故为56种).气象数据及其他污染物数据由站点内部相应仪器测量, 由市环保局环境自动监测监控系统(http://60.210.111.130:8002)获得.
1.3 质量控制与保证为保证在线监测数据的可靠性, 使用美国林德(Linde)公司的臭氧前体物PAMS-57标气分别配制2×10⁻⁹、4×10⁻⁹、6×10⁻⁹、8×10⁻⁹和10×10-9体积分数的标气, 在采样前对仪器进行多点标定, 以目标物种的标气浓度为横坐标, 响应峰面积为纵坐标做出该物种的标准曲线, 并保证各物种标准曲线r2在0.99以上.采样开始后每周通一次体积分数为2×10⁻⁹的标气进行单点校准, 偏差阈值设置为20%, 即保证90%的VOCs组分定量结果和理论值之比在1±0.2范围内.空气样品分析完, 手动将所有样品谱图与标准物质谱图进行核对.其余站点质控要求和其他辅助设施都符合相应规定[26].
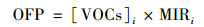
1.4 化学反应活性分析方法 1.4.1 臭氧生成潜势(OFP)臭氧生成潜势(ozone formation potential, OFP)常用来衡量VOCs生成O3的最大能力, 常使用最大增量反应活性系数法(MIR系数法)[27]来计算VOCs的OFP, 其计算公式为:
|
(1) |
式中, OFP为VOCs的臭氧生成潜势, μg·m-3; [VOCs]i为i个VOCs物种的浓度, μg·m-3; MIRi为i个VOCs物种的的最大增量反应系数, 数值见文献[28, 29].
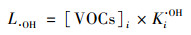
1.4.2 ·OH消耗速率(L·OH)VOCs与·OH的反应是O3生成过程的关键步骤, 而RO2是产生O3的关键中间物, 通常用·OH消耗速率(·OH radical loss rate, L·OH)来评估不同VOCs物种对日间光化学反应的相对贡献.计算公式为:
|
(2) |
式中, L·OH为VOCs的·OH消耗速率, s-1; [VOCs]i为物质i的浓度, mol·m-3; Ki·OH为物质i与·OH的反应速率常数, m3·(mol·s)-1, 由文献[30]获得.
1.4.3 二次有机气溶胶生成潜势(SOAp)二次有机气溶胶(SOA)是人为源和自然源排放的VOCs在大气中经过氧化等反应生成的微粒, 常采用气溶胶生成系数法(FAC)[31, 32]估算其二次有机气溶胶生成潜势(secondary organic aerosols formation potential, SOAp), 计算公式为:

|
(3) |
式中, SOAp为VOCs的二次有机气溶胶生成潜势, μg·m-3; VOCst为环境空气中VOCs的浓度, μg·m-3; FVOCr为VOCs物种参与反应的分数, %; FAC为SOA的生成系数, %, 其中FVOCr与FAC由烟雾箱实验获得, 数值见文献[31~34].
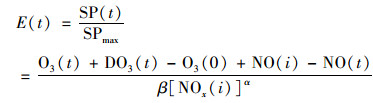
1.5 烟雾产量模型(SPM)烟雾产量模型(smog production model, SPM)广泛应用于O3敏感性的判断[35, 36], 此概念最早由Johnson[37]提出, Blanchard等[38]之后对其进行了改进, 提高了O3敏感性预测的准确性, 其是一种基于观测的模型(observation-based model, OBM), 使用一系列半经验公式来计算光化学反应的程度, 反应程度E(t)计算公式为:
|
(4) |
式中, SP为光化学烟雾产量; O3(t)和NO(t)分别为t时刻O3和NO的体积分数; DO3(t)为t时刻O3的累积沉降损失, 具体估算方式见文献[38]; O3(0)为环境O3的背景体积分数, 取40×10-9[35]; NO(i)和NOx(i)分别为NO和NOx输入量, 具体的计算方法见文献[38]; α和β为经验参数, 分别取2/3和19[38]; 所有物种均采用体积分数表示, ×10-9.
2 结果与讨论 2.1 VOCs污染特征 2.1.1 VOCs组成特征环境空气质量标准[39]中规定, O3日最大8 h均值(O3-8h-Max)二级浓度限值为160μg·m-3, 超过此值即为O3轻度污染.依此判断监测期间污染日共有16 d, 清洁日共有15 d, ρ(O3)小时均值分别为(119.4±81.9)μg·m-3和(84.2±37.3)μg·m-3.
如图 1所示, 污染日ρ(TVOC)小时均值为(50.6±28.3)μg·m-3, 其中烷烃占比最大(67.1%), 其次是芳香烃(17.8%)和烯烃(11.4%), 炔烃占比最小(3.7%).清洁日ρ(TVOC)小时均值为(38.2±24.9)μg·m-3, 其中烷烃占比最大(67.8%), 其次是芳香烃(14.2%)和烯烃(13.6%), 炔烃占比最小(4.4%).污染日相较清洁日的ρ(TVOC)均值增长了32.5%, 各组分贡献率均为: 烷烃>芳香烃>烯烃>炔烃, 两者之间的烷烃和炔烃占比相差小于1%, 较为接近, 芳香烃和烯烃有一定差别, 污染日的芳香烃贡献率高于清洁日.

|
图 1 污染日和清洁日VOCs的浓度、OFP、L·OH和SOAp Fig. 1 VOCs concentration, OFP, L·OH, and SOAp during the polluted and non-polluted period |
如图 2所示, 污染日排名前10的VOCs物种浓度之和高于清洁日, 优势物种贡献率之和分别为69.2%和63.7%.两者优势物种大体一致, 主要为烷烃类物质, 仅有苯和乙烯两个物种不同.甘浩等[40]此前对淄博市化工园区的研究也表明烷烃在VOCs各组分中占比最高, 说明烷烃对当地VOCs浓度有很大的贡献.任义君等[41]在郑州的研究也表明, 污染日和非污染日的主要物种均包含乙烷、丙烷、乙炔、乙烯、甲苯、异丁烷和正丁烷等物种, 与本研究的结果基本一致.

|
图 2 污染日和清洁日VOCs排名前10物种浓度及贡献率 Fig. 2 Concentration and contribution of the top ten VOCs species during the polluted and non-polluted period |
图 3(a)~3(i)为气象参数及主要污染物日变化情况, 可以看出, TVOC的日变化趋势与烷烃和芳香烃较为一致, 两种组分对TVOC的贡献率之和超过了80%, 对TVOC日变化趋势有较高影响.污染日的TVOC和NOx在各小时的浓度均值大多高于清洁日, TVOC和NOx的浓度在污染日和清洁日大致都呈现夜间高、白天低的日变化趋势, 这是夜间光化学作用减弱、边界层较低、稀释或者扩散过程减缓导致污染物积累的影响[42], 白天风速较大, 温度较高, 污染物被稀释及光化学反应所消耗[13].污染日和清洁日O3浓度变化则呈现出白天高, 夜间低的变化趋势, 均表现为单峰型结构, 峰值出现在13:00~15:00左右, 污染日白天的O3浓度较清洁日明显偏高, 日变化幅度较大.日出后, O3浓度升高, 同一时刻TVOC和NOx浓度下降, 这主要是白天太阳的高辐射和温度上升导致光化学反应加剧造成的, 之后随着太阳辐射减弱及温度下降又逐渐降低[43].

|
图 3 污染日和清洁日气象参数及主要污染物日变化 Fig. 3 Diurnal variation in meteorological parameters and major pollutants during the polluted and non-polluted period |
VOCs各组分浓度和化学反应活性差异较大, 对O3生成有着不同的影响[44].L·OH和OFP都可以计算出某一地区VOCs的臭氧生成能力, 但前者仅考虑到单个VOC物种与·OH的反应速率, 后者综合考虑了后续反应, 二者综合比较, 可以更好地判断对臭氧生成贡献较大的VOCs物种.SOA是城市PM2.5的重要组成部分[45, 46], 结合文献[31~34], 该研究共有27种VOCs可计算SOAp, 其中烷烃类VOCs 11种, 烯烃类1种(异戊二烯), 芳香烃类15种.
2.2.1 化学反应活性水平如图 1和图 4所示, 污染日和清洁日的OFP值分别为(85.5±42.4)μg·m-3和(71.5±41.8)μg·m-3, 低于同样重工业发达的天津市[10](123.9μg·m-3), 二者VOCs各组分贡献率均为: 烯烃>芳香烃>烷烃>炔烃; L·OH值分别为(4.2±2.3)s-1和(3.6±2.2)s-1, 二者VOCs各组分贡献率均为: 烯烃>烷烃>芳香烃>炔烃.从各类VOCs组分数值来看, 污染日各类VOCs组分的OFP和L·OH也均高于清洁日, 从各组分对OFP和L·OH的贡献率来看, 污染日烷烃和芳香烃高于清洁日, 炔烃相差不大, 而烯烃低于清洁日.

|
图 4 VOCs各组分OFP、L·OH和SOAp及贡献率 Fig. 4 OFP, L·OH, and SOAp of each VOCs category and their contribution |
污染日VOCs的SOAp约为(0.56±0.33)μg·m-3, 其中芳香烃占比最大(79.3%), 其次是烯烃(10.7%)和烷烃(10.0%), 和天津市[10](0.57μg·m-3)水平相当; 清洁日为(0.37±0.26)μg·m-3, 贡献率依次为芳香烃(75.1%)、烷烃(12.7%)和烯烃(12.2%), 和重庆市夏秋季郊区(0.36μg·m-3)接近[18].污染日VOCs的SOAp比清洁日高出了51.4%, 其中芳香烃升高幅度最大, 高出了59.2%, 其次是烯烃和烷烃, 可见芳香烃类是对SOA形成贡献最大的VOCs物种.
2.2.2 化学反应活性日变化如图 3(g)所示, 污染日和清洁日VOCs的OFP呈现出夜间高白天低的变化特征, 和TVOC的浓度日变化基本一致[图 3(i)].图 3(g)和3(k)显示, 污染日的OFP和L·OH在早高峰时期(06:00~09:00)都有一个明显的上升趋势, 此时ρ(TVOC)受交通排放影响导致浓度升高.污染日L·OH在晚高峰时期(16:00~18:00)也有一个明显的上升, 这是由于此时较高的温度、O3混合比和强太阳辐射促进了VOCs与·OH的反应速率[13].图 3(l)和3(i)显示, 污染日VOCs的SOAp日变化特征也和TVOC浓度日变化基本一致, 大致呈现夜间高白天低的变化特征.
2.2.3 优势贡献物种表 1为污染日和清洁日VOCs对OFP和L·OH贡献排名前10物种及其贡献率, 从物质种类上看, 污染日和清洁日的优势物种基本一致, 且多为烯烃和芳香烃类物质.从贡献率来看, 优势物种在污染日和清洁日对OFP贡献率之和分别是68.4%和68.5%, 对L·OH贡献率之和分别是75.2%和74.7%, 相差不大.总体来看, 污染日和清洁日烯烃对浓度的贡献率分别为11.4%和13.6%, 却分别贡献了OFP的45.7%和51.4%, L·OH的66.9%和70.5%(如图 4), 这是因为较活泼的烯烃和芳香烃更易参与光化学反应[47].当地夏季VOCs的OFP和L·OH主要由烯烃所贡献, 这和其他地区[48, 49]的研究结果是一致的.因此, 防治其臭氧污染, 应重点关注此类物质的管控.从单个VOCs物种看, 污染日和清洁日对SOAp贡献最高的物质均为甲苯, 分别占比31.1%和26.1%, 该物质主要来源于交通排放和化工厂的溶剂挥发[11], 贡献高的还有苯、异戊二烯和间/对-二甲苯等物质, Zhang等[49]的研究提出这些化合物是中国城市中形成SOA较高的物种.因此控制城市SOA的生成, 应重点关注芳香烃类物质的排放.
|
|
表 1 污染日和清洁日对OFP和L·OH贡献排名前10物种1) Table 1 ten species that contribute to OFP and L·OH during the polluted and non- polluted period |
2.3 污染成因分析 2.3.1 气象因素的影响
污染日和清洁日主要污染物浓度及气象参数情况如表 2所示, 结果显示, 污染日温度要高于清洁日, 太阳辐射较强, 这有利于光化学反应的进行, 导致O3浓度较高, 有研究也表明当温度在一定范围内时与O3浓度大致呈正相关关系[43, 50].图 5中显示了污染日和清洁日的风向风速, 二者风向大体一致, 污染日的风速要低于清洁日, 不利于污染物的扩散[9], 使得污染日的各项污染物小时平均浓度均高于清洁日.
|
|
表 2 污染日和清洁日的主要污染物和气象参数1) Table 2 Main pollutants and meteorological parameters during the polluted and non-polluted period |

|
图 5 污染日和清洁日风玫瑰图 Fig. 5 Wind rose diagram during the polluted and non- polluted period |
图 6给出了温度和相对湿度与TVOC、NOx和O3浓度之间的相互关系.可以看出, 当温度为19~27℃, 相对湿度为71% ~95%时, TVOC和NOx浓度较高; 当温度为26~34℃, 相对湿度为40% ~75%时, O3浓度较高.由图 3(c)、3(d)和3(i)可知, TVOC、NOx和O3浓度呈现明显的日变化特征, 污染日白天温度高于27℃, 清洁日则在27℃左右, 使得污染日白天O3浓度比清洁日高, TVOC和NOx浓度在白天下降.

|
黑框表示浓度较高区域 图 6 温度、相对湿度和各污染物的相互关系 Fig. 6 Relationship between temperature, relative humidity, and pollutants |
VOCs/NOx通常用于对臭氧生成敏感性的简单判断方法[51], 一般认为臭氧敏感区属性诊断的临界值为8[52], 当VOCs/NOx(VOCs使用含碳体积分数, NOx使用体积分数)比值小于4时, O3形成受VOCs的控制, 大于15时, 受NOx的控制, 比值在4~15之间属于过渡区, 减少VOCs和NOx对O3控制都有效[35].为了尽可能真实反映O3光化学反应的敏感性, 选取光化学反应较强时刻(08:00~16:00)的VOCs/NOx比值[53].如图 7所示, 污染日和清洁日的比值大多都小于8, 说明O3形成主要受VOCs控制, 这和其他城市地区的研究结果一致[17, 54].对比污染日和清洁日VOCs/NOx比值, 小于4的比例较为接近, 分别为57.7%和62.4%, 清洁日要略大一些, 其余比值均处于4~15之间的过渡区, 说明污染日和清洁日O3敏感性均处于VOCs控制区和过渡区.

|
图 7 污染日和清洁日VOCs/NOx比值 Fig. 7 VOCs/NOx ratios during the polluted and non- polluted period |
上述VOCs/NOx比值法存在一定局限性, 其经验临界值可能不适合本地区, 且没有考虑污染物的区域迁移, 因此一般与SPM进行互补分析[35].根据SPM计算出的反应程度E(t)值, 可将臭氧敏感性分为3种类型: E(t)<0.6时表示VOCs控制, E(t)>0.9表示NOx控制, 0.6<E(t)<0.9表示过渡控制区域[55].图 8为污染日和清洁日08:00~16:00的E(t)值, 结果与VOCs/NOx比值法略有不同, 污染日08:00~11:00的反应程度E(t)<0.6, 12:00~16:00为0.6<E(t)<0.9, 说明污染日的臭氧敏感性呈现出VOCs控制区和过渡区交替的态势, 清洁日08:00~16:00反应程度E(t)<0.6, 臭氧敏感性均处于VOCs控制区.因此, 对O3污染的管控, 除了要重视VOCs, 也要关注NOx的排放情况, 进行二者的协同治理.

|
图 8 污染日和清洁日E(t)值 Fig. 8 The E(t) during the polluted and non- polluted period |
(1) 污染日较清洁日ρ(TVOC)小时均值高出了32.5%, 分别为(50.6±28.3)μg·m-3和(38.2±24.9)μg·m-3, 各组分贡献率均为: 烷烃>芳香烃>烯烃>炔烃, 污染日的芳香烃贡献率高于清洁日, 优势物种基本一致, 多为烷烃类.污染日和清洁日TVOC浓度日变化均呈夜间高白天低的变化趋势, 烷烃和芳香烃影响较大; O3浓度则呈现相反的夜间低白天高的趋势.
(2) 污染日VOCs的OFP和L·OH均高于清洁日, 各组分对OFP和L·OH贡献率均为烯烃最高.污染日和清洁日VOCs的SOAp均为芳香烃类的贡献最大, 前者的SOAp比后者高51.4%, 其中升幅最大的为芳香烃.污染日OFP呈夜间高白天低的日变化趋势, OFP在早高峰、L·OH在早晚高峰均出现明显上升趋势, 污染日SOAp日变化特征与VOCs保持一致.VOCs的OFP和L·OH优势物种多为活性较强的烯烃和芳香烃类物质, 对SOAp贡献较高的物种多为芳香烃, 烯烃和芳香烃类是对O3和SOA形成影响最大的VOCs物种, 应重点关注.
(3) 温度、相对湿度和风速对TVOC、NOx和O3的浓度有一定影响.通过VOCs/NOx值判断污染日和清洁日O3敏感性均处于VOCs控制区和过渡区, 而SPM分析污染日08:00~16:00期间处于VOCs控制区和过渡区交替的态势, 清洁日则都处于VOCs控制区, O3的管控可以关注VOCs和NOx的协同治理.
| [1] |
姜华, 常宏咪. 我国臭氧污染形势分析及成因初探[J]. 环境科学研究, 2021, 34(7): 1576-1582. Jiang H, Chang H M. Analysis of China's ozone pollution situation, preliminary investigation of causes and prevention and control recommendations[J]. Research of Environmental Sciences, 2021, 34(7): 1576-1582. |
| [2] |
李红, 彭良, 毕方, 等. 我国PM2.5与臭氧污染协同控制策略研究[J]. 环境科学研究, 2019, 32(10): 1763-1778. Li H, Peng L, Bi F, et al. Strategy of coordinated control of PM2.5 and ozone in China[J]. Research of Environmental Sciences, 2019, 32(10): 1763-1778. |
| [3] | Atkinson R. Atmospheric chemistry of VOCs and NOx[J]. Atmospheric Environment, 2000, 34(12-14): 2063-2101. DOI:10.1016/S1352-2310(99)00460-4 |
| [4] | Wang Y Y, Du H Y, Xu Y Q, et al. Temporal and spatial variation relationship and influence factors on surface urban heat island and ozone pollution in the Yangtze River Delta, China[J]. Science of the Total Environment, 2018, 631-632: 921-933. DOI:10.1016/j.scitotenv.2018.03.050 |
| [5] | An J L, Shi Y Z, Wang J X, et al. Temporal variations of O3 and NOx in the urban background atmosphere of Nanjing, East China[J]. Archives of Environmental Contamination and Toxicology, 2016, 71(2): 224-234. DOI:10.1007/s00244-016-0290-8 |
| [6] | Bari M A, Kindzierski W B. Ambient volatile organic compounds (VOCs) in Calgary, Alberta: sources and screening health risk assessment[J]. Science of the Total Environment, 2018, 631-632: 627-640. DOI:10.1016/j.scitotenv.2018.03.023 |
| [7] | Liu Y, Shao M, Fu L L, et al. Source profiles of volatile organic compounds (VOCs) measured in China: Part Ⅰ[J]. Atmospheric Environment, 2008, 42(25): 6247-6260. DOI:10.1016/j.atmosenv.2008.01.070 |
| [8] | 生态环境部. 2020年挥发性有机物治理攻坚方案[R]. 北京: 生态环境部, 2020. |
| [9] | Wu S, Tang G Q, Wang Y H, et al. Vertically decreased VOC concentration and reactivity in the planetary boundary layer in winter over the North China Plain[J]. Atmospheric Research, 2020, 240. DOI:10.1016/j.atmosres.2020.104930 |
| [10] |
高璟赟, 肖致美, 徐虹, 等. 2019年天津市挥发性有机物污染特征及来源[J]. 环境科学, 2021, 42(1): 55-64. Gao J Y, Xiao Z M, Xu H, et al. Characterization and source apportionment of atmospheric VOCs in Tianjin in 2019[J]. Environmental Science, 2021, 42(1): 55-64. |
| [11] | Yuan B, Shao M, Lu S H, et al. Source profiles of volatile organic compounds associated with solvent use in Beijing, China[J]. Atmospheric Environment, 2010, 44(15): 1919-1926. DOI:10.1016/j.atmosenv.2010.02.014 |
| [12] |
张玉欣, 安俊琳, 林旭, 等. 南京北郊冬季挥发性有机物来源解析及苯系物健康评估[J]. 环境科学, 2017, 38(1): 1-12. Zhang Y X, An J L, Lin X, et al. Source apportionment of volatile organic compounds and health assessment of benzene series in northern suburb of Nanjing in winter[J]. Environmental Science, 2017, 38(1): 1-12. |
| [13] | Huang W W, Zhao Q Y, Liu Q, et al. Assessment of atmospheric photochemical reactivity in the Yangtze River Delta using a photochemical box model[J]. Atmospheric Research, 2020, 245. DOI:10.1016/j.atmosres.2020.105088 |
| [14] | Cai C J, Geng F H, Tie X X, et al. Characteristics and source apportionment of VOCs measured in Shanghai, China[J]. Atmospheric Environment, 2010, 44(38): 5005-5014. DOI:10.1016/j.atmosenv.2010.07.059 |
| [15] | Zhang Z J, Yan X Y, Gao F L, et al. Emission and health risk assessment of volatile organic compounds in various processes of a petroleum refinery in the Pearl River Delta, China[J]. Environmental Pollution, 2018, 238: 452-461. DOI:10.1016/j.envpol.2018.03.054 |
| [16] | Wu F K, Yu Y, Sun J, et al. Characteristics, source apportionment and reactivity of ambient volatile organic compounds at Dinghu Mountain in Guangdong province, China[J]. Science of the Total Environment, 2016, 548-549: 347-359. DOI:10.1016/j.scitotenv.2015.11.069 |
| [17] | Zou Y, Deng X J, Wang B G, et al. An analysis of the impacts of VOCs and NOx on the ozone formation in Guangzhou[J]. Atmospheric Chemistry and Physics Discussions, 2014, 14: 18849-18877. |
| [18] |
刘芮伶, 李礼, 余家燕, 等. 重庆市夏秋季VOCs对臭氧和二次有机气溶胶生成潜势的估算[J]. 环境科学研究, 2017, 30(8): 1193-1200. Liu R L, Li L, Yu J Y, et al. Estimation of the formation potential of ozone and secondary organic aerosols in summer and autumn in Chongqing[J]. Research of Environmental Sciences, 2017, 30(8): 1193-1200. |
| [19] |
徐晨曦, 陈军辉, 韩丽, 等. 成都市2017年夏季大气VOCs污染特征、臭氧生成潜势及来源分析[J]. 环境科学研究, 2019, 32(4): 619-626. Xu C X, Chen J H, Han L, et al. Analyses of pollution characteristics, ozone formation potential and sources of VOCs atmosphere in Chengdu City in summer 2017[J]. Research of Environmental Sciences, 2019, 32(4): 619-626. |
| [20] |
徐晨曦, 陈军辉, 韩丽, 等. 宜宾市冬季挥发性有机物污染特征及来源[J]. 环境科学研究, 2019, 32(6): 1020-1025. Xu C X, Chen J H, Han L, et al. Pollution characteristics and source apportionments of volatile organic compounds in Yibin city in winter[J]. Research of Environmental Sciences, 2019, 32(6): 1020-1025. |
| [21] |
王楚涵, 张鑫, 吴鸣, 等. 沈阳市郊区环境空气中醛酮类化合物的污染特征与来源分析[J]. 环境科学研究, 2020, 33(12): 2771-2784. Wang C H, Zhang X, Wu M, et al. Pollution characterization and source analyses of carbonyls in the ambient air in a suburban area of Shenyang[J]. Research of Environmental Sciences, 2020, 33(12): 2771-2784. |
| [22] |
王雨燕, 王秀艳, 杜淼, 等. 淄博市重点工业行业VOCs排放特征[J]. 环境科学, 2020, 41(3): 1078-1084. Wang Y Y, Wang X Y, Du M, et al. Emission characteristics of volatile organic compounds from typical industries in Zibo[J]. Environmental Science, 2020, 41(3): 1078-1084. |
| [23] |
吴丽萍, 李梦辉, 张向炎, 等. 淄博市2016-2019年近地面大气臭氧时空分布特征[J]. 环境科学研究, 2021, 34(5): 1044-1052. Wu L P, Li M H, Zhang X Y, et al. Spatial-temporal characteristics of ground ozone in Zibo city from 2016 to 2019[J]. Research of Environmental Sciences, 2021, 34(5): 1044-1052. |
| [24] | Li M H, Wu L P, Zhang X Y, et al. Comparison of PM2.5 chemical compositions during haze and non-haze days in a heavy industrial city in North China[J]. Aerosol and Air Quality Research, 2020, 20(9): 1950-1960. DOI:10.4209/aaqr.2019.11.0591 |
| [25] | 李思遠. 大气及废气中挥发性有机物在线快速监测与应用研究[D]. 济南: 山东建筑大学, 2019. |
| [26] | HJ 1010-2018, 环境空气挥发性有机物气相色谱连续监测系统技术要求及检测方法[S]. |
| [27] | Carter W P L. Reactivity estimates for selected consumer product compounds[R]. California: California Air Resources Board, 2008. |
| [28] | Zhang Y N, Xue L K, Carter W P L, et al. Development of ozone reactivity scales for volatile organic compounds in a Chinese megacity[J]. Atmospheric Chemistry and Physics Discussions, 2021. DOI:10.5194/acp-2021-44 |
| [29] | Carter W P L. Updated maximum incremental reactivity scale and hydrocarbon bin reactivities for regulatory applications[R]. California: California Air Resources Board, 2010. |
| [30] | Carter W P L. Development of the SAPRC-07 chemical mechanism[J]. Atmospheric Environment, 2010, 44(40): 5324-5335. DOI:10.1016/j.atmosenv.2010.01.026 |
| [31] | Grosjean D. In situ organic aerosol formation during a smog episode: estimated production and chemical functionality[J]. Atmospheric Environment. Part A. General Topics, 1992, 26(6): 953-963. DOI:10.1016/0960-1686(92)90027-I |
| [32] | Grosjean D, Seinfeld J H. Parameterization of the formation potential of secondary organic aerosols[J]. Atmospheric Environment (1967), 1989, 23(8): 1733-1747. DOI:10.1016/0004-6981(89)90058-9 |
| [33] | Martín-Reviejo M, Wirtz K. Is benzene a precursor for secondary organic aerosol?[J]. Environmental Science & Technology, 2005, 39(4): 1045-1054. |
| [34] | Kroll J H, Ng N L, Murphy S M, et al. Secondary organic aerosol formation from isoprene photooxidation under high-NOx conditions[J]. Geophysical Research Letters, 2005, 32(18). DOI:10.1029/2005GL023637 |
| [35] | Li K W, Chen L H, Ying F, et al. Meteorological and chemical impacts on ozone formation: a case study in Hangzhou, China[J]. Atmospheric Research, 2017, 196: 40-52. DOI:10.1016/j.atmosres.2017.06.003 |
| [36] | Han L X, Chen L H, Li K W, et al. Source apportionment of volatile organic compounds (VOCs) during ozone polluted days in Hangzhou, China[J]. Atmosphere, 2019, 10(12). DOI:10.3390/atmos10120780 |
| [37] | Johnson G M. A simple model for predicting the ozone concentration of ambient air[A]. In: Proceedings of the Eighth International Clean Air Conference[C]. Holroyd Centre: Clean Air Society of Australia and New Zealand, 1984. 715-731. |
| [38] | Blanchard C L, Lurmann F W, Roth P M, et al. The use of ambient data to corroborate analyses of ozone control strategies[J]. Atmospheric Environment, 1999, 33(3): 369-381. DOI:10.1016/S1352-2310(98)00223-4 |
| [39] | GB 3095-2012, 环境空气质量标准[S]. |
| [40] |
甘浩, 徐勃, 张向炎, 等. 淄博市化工园区夏季环境VOCs污染特征及健康风险评价[J]. 环境科学研究, 2022, 35(1): 20-29. Gan H, Xu B, Zhang X Y, et al. Characteristics and health risk assessment of atmospheric VOCs in a chemical industrial park of Zibo in summer[J]. Research of Environmental Sciences, 2022, 35(1): 20-29. |
| [41] |
任义君, 马双良, 王思维, 等. 郑州市春季大气污染过程VOCs特征、臭氧生成潜势及源解析[J]. 环境科学, 2020, 41(6): 2577-2585. Ren Y J, Ma S L, Wang S W, et al. Ambient VOCs characteristics, ozone formation potential, and source apportionment of air pollution in spring in Zhengzhou[J]. Environmental Science, 2020, 41(6): 2577-2585. DOI:10.3969/j.issn.1000-6923.2020.06.028 |
| [42] | Baudic A, Gros V, Sauvage S, et al. Seasonal variability and source apportionment of volatile organic compounds (VOCs) in the Paris megacity (France)[J]. Atmospheric Chemistry and Physics, 2016, 16(18): 11961-11989. DOI:10.5194/acp-16-11961-2016 |
| [43] | Zhang L, Zhao T L, Gong S L, et al. Updated emission inventories of power plants in simulating air quality during haze periods over East China[J]. Atmospheric Chemistry and Physics, 2018, 18(3): 2065-2079. DOI:10.5194/acp-18-2065-2018 |
| [44] |
李琦, 桂丽, 刘明, 等. 西安人为源VOCs排放特征及其对O3和SOA生成潜势的影响[J]. 环境科学研究, 2019, 32(2): 253-262. Li Q, Gui L, Liu M, et al. Emission characteristics of anthropogenic VOCs in Xi'an city and its contribution to ozone formation potential and secondary organic aerosols formation potential[J]. Research of Environmental Sciences, 2019, 32(2): 253-262. |
| [45] | Turpin B J, Huntzicker J J. Identification of secondary organic aerosol episodes and quantitation of primary and secondary organic aerosol concentrations during SCAQS[J]. Atmospheric Environment, 1995, 29(23): 3527-3544. DOI:10.1016/1352-2310(94)00276-Q |
| [46] | Huang R J, Zhang Y L, Bozzetti C, et al. High secondary aerosol contribution to particulate pollution during haze events in China[J]. Nature, 2014, 514(7521): 218-222. DOI:10.1038/nature13774 |
| [47] |
曹梦瑶, 林煜棋, 章炎麟. 南京工业区秋季大气挥发性有机物污染特征及来源解析[J]. 环境科学, 2020, 41(6): 2565-2576. Cao M Y, Lin Y Q, Zhang Y L. Characteristics and source apportionment of atmospheric VOCs in the Nanjing industrial area in autumn[J]. Environmental Science, 2020, 41(6): 2565-2576. DOI:10.3969/j.issn.1000-6923.2020.06.027 |
| [48] |
刘营营, 王丽涛, 齐孟姚, 等. 邯郸大气VOCs污染特征及其在O3生成中的作用[J]. 环境化学, 2020, 39(11): 3101-3110. Liu Y Y, Wang L T, Qi M Y, et al. Characteristics of atmospheric VOCs and their role in O3 generation in Handan[J]. Environmental Chemistry, 2020, 39(11): 3101-3110. DOI:10.7524/j.issn.0254-6108.2019112301 |
| [49] | Zhang G Q, Wang N, Jiang X J, et al. Characterization of ambient volatile organic compounds (VOCs) in the area adjacent to a petroleum refinery in Jinan, China[J]. Aerosol and Air Quality Research, 2017, 17(4): 944-950. DOI:10.4209/aaqr.2016.07.0303 |
| [50] | Xiong Y, Du K. Source-resolved attribution of ground-level ozone formation potential from VOC emissions in Metropolitan Vancouver, BC[J]. Science of the Total Environment, 2020, 721. DOI:10.1016/j.scitotenv.2020.137698 |
| [51] | Seinfeld J H. Urban air pollution: state of the science[J]. Science, 1989, 243(4892): 745-752. DOI:10.1126/science.243.4892.745 |
| [52] | National Research Council, Division on Earth and Life Studies, Environment and Resources Commission on Geosciences, et al. Rethinking the ozone problem in urban and regional air pollution[M]. Washington: National Academies Press, 1991. |
| [53] |
李凯, 刘敏, 梅如波. 泰安市大气臭氧污染特征及敏感性分析[J]. 环境科学, 2020, 41(8): 3539-3546. Li K, Liu M, Mei R B. Pollution characteristics and sensitivity analysis of atmospheric ozone in Taian city[J]. Environmental Science, 2020, 41(8): 3539-3546. DOI:10.3969/j.issn.1000-6923.2020.08.034 |
| [54] | Jia C H, Mao X X, Huang T, et al. Non-methane hydrocarbons (NMHCs) and their contribution to ozone formation potential in a petrochemical industrialized city, Northwest China[J]. Atmospheric Research, 2016, 169: 225-236. DOI:10.1016/j.atmosres.2015.10.006 |
| [55] | Blanchard C L, Stoeckenius T. Ozone response to precursor controls: comparison of data analysis methods with the predictions of photochemical air quality simulation models[J]. Atmospheric Environment, 2001, 35(7): 1203-1215. |