 2022, Vol. 43


2. 湖北省大气复合污染研究中心, 武汉 430074;
3. 湖北省环境监测中心站, 武汉 430074
2. Research Centre for Complex Air Pollution of Hubei Province, Wuhan 430074, China;
3. Eco-Environmental Monitoring Centre of Hubei Province, Wuhan 430074, China
过度排放的人为污染物加之不利的气象条件, 使得我国冬季灰霾污染事件频发[1].污染物的区域传输也是加剧局部地区空气污染的重要因素之一[2].在区域传输作用下, 老化的二次气溶胶容易吸湿增长, 导致下风向地区空气质量下降, PM2.5浓度升高[3~4].在一次冬季霾污染事件中, 区域传输对北京市PM2.5的贡献率达到55%[5].长三角地区的相关研究表明[6], 河北、河南和湖北的污染物输送是造成江苏省霾污染的原因之一.上海市环境空气质量主要受北、东和西这3个方向的气团影响, 其中北向气团占全部气团的44.8%[7].在偏北气流的作用下, 上海市大气颗粒物处于高浓度水平[8].Chen等[9]的研究对2015年的一次重霾事件分析发现, 北风携带污染物进入珠江三角洲, 使其北部地区PM2.5浓度的增长早于南部地区1 d.华中地区地处中国中部和东部区域大气传输的十字路口[10], 具有独特的“非静稳”气象条件, 即强风、无逆温现象和不稳定的大气边界层结构[11].目前, 有关大气污染物区域传输的研究主要集中于京津冀[12~14]、长江三角洲[15~17]和珠江三角洲地区[18~20], 华中地区的相关研究较少[21].
近年来, 基于PM2.5在线监测仪器获取的高时间分辨率的化学组分数据[22~23], 开展重污染过程的成因解析和污染物来源的准确溯源研究, 成为研究的热点[24].现有研究主要是基于PM2.5小时分辨率数据, 分析PM2.5的化学组成, 并通过受体模型量化其来源[25~27].如Gao等[28]的研究分别采用主成分分析法、正定矩阵因子法(positive matrix factorization, PMF)和多元线性模型这3种模型对北京市PM2.5来源进行了解析.Tian等[29]的研究基于天津市PM2.5高时间分辨率数据探讨了PMF源解析模型的不确定性和最优建模方案.高时间分辨率源解析结果为了解重污染形成机制提供了重要的基础信息[30].将受体模型与轨迹模拟相结合能够区分局地排放与区域传输对PM2.5的影响[31].
武汉是华中地区唯一的国家中心城市, 大气污染问题较为突出[32]. 2019年武汉市污染天占总天数的32.9%, 首要污染物为PM2.5有38 d[33].而区域传输是导致武汉市PM2.5浓度急剧上升的重要原因之一. Yu等[11]的研究表明, 在一次重污染事件中非本地源排放的大气污染物对武汉市PM2.5浓度贡献超过65%.武汉大气PM2.5的污染来源主要为燃煤电厂、机动车尾气排放和周边郊区生物质燃烧[34~37].目前, 基于小时分辨率观测数据的相关研究较少[38].此外, 探讨区域传输在武汉市霾污染事件形成中的作用研究较少[39], 尤其是在冬季重污染过程中, 实时气团来向下PM2.5各类源贡献的潜在源区的分析不足.
本研究基于小时分辨率PM2.5组分(水溶性离子、微量元素和碳组分)观测数据, 采用PMF模型进行来源解析, 结合后向轨迹模式中的聚类分析、浓度权重分析(concentration weighted trajectory, CWT), 分析PM2.5的传输路径及不同气团来向下各类贡献源的潜在源区, 以期为区域大气污染防控提供支撑.
1 材料与方法 1.1 样品采集本研究监测点位(30.60°N, 114.28°E)位于武汉市环境科学研究院楼顶(图 1), 周边分布有居民区和商业区, 人口密集, 交通流量大, 属于城市中心交通和居民混合区站点.

|
图 1 观测点位示意 Fig. 1 Location of the observational site |
本研究中利用在线观测仪器, 测量了PM2.5的质量浓度及化学组分, 包括水溶性离子(water-soluble ions, WSIs)、微量元素(trace element, TE)和碳组分.时间段为2019年12月1日00:00至12月31日23:00.PM2.5质量浓度的监测采用TEOM-1405F型环境颗粒物在线监测仪[25].水溶性离子组分(NH4+、Na+、Mg2+、K+、Ca2+、Cl-、NO3-和SO42-)采用MARGA-ADI2080型离子在线分析仪监测[40].通过定期添加溴化锂(LiBr)进行内部校准, 使得相对误差保持在10%以内.使用阴阳离子标准溶液建立标准校准曲线, 回收率均高于95%[41~42].微量元素监测采用XactTM 625型大气重金属在线监测仪定量PM2.5中K、Ca、Cr、Mn、Fe、Cu、Zn、As、Ba和Pb的浓度.监测期间定期进行采样流量的核查, 流量的相对误差保持在±5%以内.监测期间定期对空白膜激发, 对比空白膜和样品斑点的光谱, 检查同种元素的特征峰, 对采集信号与能量之间的转换进行线性校准[28].PM2.5中有机碳(organic carbon, OC)和元素碳(elemental carbon, EC)采用Sunset RT-4型气溶胶有机碳元素碳在线分析仪监测, 并通过在每个样品分析结束时自动注入已知量的甲烷(氦气氛围下5% CH4气体), 并以该外标气体对系统分析结果进行归一化校正[43].
1.2 PMF模型本研究采用PMF 5.0对PM2.5的实时源贡献进行解析.PMF模型法是基于大量的受体观测数据, 输出可能污染来源的源贡献矩阵和污染源成分谱矩阵.PMF模型不需要源成分谱的输入, 该法采取了非负值的约束条件, 利用数据标准偏差来进行优化[44].本研究选取2~9个因子分别进行迭代运算.根据运行结果, 选取Qtrue和Qrobust最为稳定且接近的一组, 保证大部分数据残差能够在±3范围以内.同时, 解析结果能做出合理解释.通过对计算结果的比较和判断, 最终确定因子数为7.
1.3 后向轨迹分析和CWT分析本研究利用MeteoInfo软件结合TrajStat插件对研究期间气团进行模拟. 气象数据来源于美国国家环境预报中心(NCEP).将观测点设为起始点, 起始高度为500 m, 轨迹时长为48 h, 计算每小时的后向轨迹.基于聚类分析, 共得到4类轨迹(图 2).其中, 第一类气团来自山西省西南部(35.5%), 经由河南中东部传输至观测点; 第二类气团来自安徽省西南部(40.6%), 经湖北省东部传输至观测点, 传输通道为长江航道; 第四类气团来自湖南省中西部(15.6%), 经湖南北部和湖北东南部传输至观测点.三者均为500 hPa以下的低空中短距离传输气团.第三类气团来自内蒙古自治区西部(8.33%), 经宁夏、山西、山西和河南长距离传输过程至观测点, 且传输过程中气团由高空降为低空.

|
图 2 武汉市12月气团后向轨迹聚类分析 Fig. 2 Cluster analysis of backward trajectories transported to Wuhan in December |
观测期间大气ρ(PM2.5)范围为13.0~163 μg·m-3, 平均值为(75.1±29.2)μg·m-3, 超出二级浓度限值.由图 3可以看出, 研究期间共发生了两次污染过程, 分别为12月6日03:00[ρ(PM2.5)为85.0 μg·m-3]至7日00:00(83.0 μg·m-3)、12月12日18:00(75.0 μg·m-3)至16日07:00(75.0 μg·m-3).其中, 第一次污染过程共持续22 h, 主要受西北气团影响, 风向由东北向转为西北向.气温在12月6日15:00到达峰值12.6℃, 此后持续下降.该阶段考虑为一次冷锋过境, 过境前气温达到高值, 过境时由冷气团控制使得气温骤降.第一次污染过程持续时间较短, 主要由冷锋过境导致外来污染物输送所致; 第二次污染过程共持续86 h, 属于典型的本地污染物排放累积过程.风速维持在0.16~2.30 m·s-1, 风向在东北、北和东南之间转换, 并在东南向维持了31 h(90.1°~166°).湿度呈现波动上升趋势, 12月15日06:00达到峰值76.7%, 此后小幅下降后继续上升, 至12月16日07:00达到最高值87.0%.高湿度和低风速的气象条件加剧气态前体物的二次转化、促进颗粒物吸湿增长, 导致PM2.5的大量积累. ρ(PM2.5)逐步增加到12月14日09:00的最高值(163 μg·m-3), 且自12月14日07:00连续6 h浓度维持在150 μg·m-3以上. 12月15日18:00风向发生突变, 从偏东风转为北风, ρ(PM2.5)开始迅速下降, 最大降幅为0.8倍, 至12月17日00:00的最低值为26.0 μg·m-3.

|
图 3 观测期间PM2.5与气象参数时间序列 Fig. 3 Time series of PM2.5 and meteorological parameters during the observation period |
PM2.5各组分浓度的时间变化如图 4所示.第一次污染过程中水溶性离子占主导, 平均ρ(WSIs)为(105±27.9)μg·m-3, 是第二次污染过程的1.3倍.水溶性离子于12月6日04:00达到最高值(150 μg·m-3), 是研究期间平均浓度的2.0倍; 第二次污染过程中PM2.5各组分浓度均出现明显的峰值.其中, ρ(EC)、ρ(OC)和ρ(TE)分别在12月的14日11:00(4.34 μg·m-3)、14日00:00(23.4 μg·m-3)和13日21:00(10.7 μg·m-3)达到最高值, 是研究期间其平均浓度的1.9、1.6和2.0倍.水溶性离子在污染期间呈现小幅下降而后上升于12月15日15:00达到峰值(126 μg·m-3).

|
EC: 元素碳; OC: 有机碳; TE: 微量元素; WSIs: 水溶性离子 图 4 观测期间PM2.5化学组成时间序列及污染时期统计箱型图 Fig. 4 Time series of chemical composition in PM2.5 during observation period and statistical box chart of pollution episodes |
不同污染时期水溶性离子中各离子变化如图 5所示.第一次污染过程中各离子较清洁时段均有所上升.其中, ρ(NH4+)、ρ(NO3-)和ρ(SO42-)的浓度明显升高, 分别是清洁时段的1.6、1.7和2.1倍.反映出西北向气团在远距离传输过程中, 大气污染物老化充分, 促进二次离子的生成.第二次污染过程中各离子较清洁时段变化幅度较小, 其中, SO42-增幅最大, ρ(SO42-)为清洁时段的1.4倍.

|
图 5 观测期间不同污染时期各水溶性离子浓度对比 Fig. 5 Comparison of the concentration of water-soluble inorganic ions in different pollution periods during the observation period |
OC/EC值可用来评价大气中二次污染的程度[45].本研究中, 清洁时段OC/EC值的变化范围为3.11~13.9, 第一次污染过程为4.69~6.23, 第二次污染过程为4.21~8.73.前人指出, OC/EC值为1.00~4.20时, 碳组分来自机动车尾气排放; OC/EC值为2.50~10.5时, 碳组分来自燃煤排放; OC/ EC值为3.80~13.2时, 碳组分来自生物质燃烧[46, 47].因此, 两次污染过程主要受燃煤排放的影响, 而清洁时段受燃煤排放和生物质燃烧的共同影响.
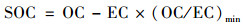
当OC/EC值超过2时, 可以认为存在二次反应生成的二次有机碳(secondary organic carbon, SOC)[48].由图 6可知, 各时段均存在SOC污染.通过OC/EC最小比值法可以估计SOC的浓度, 计算公式为:

|
图 6 观测期间不同污染时期碳组分对比 Fig. 6 Comparison of the concentration of the carbonaceous components in different pollution periods during the observation period |
|
式中, (OC/EC)min为样品中OC/EC的最小值.
本研究中(OC/EC)min选择3.11(12月4日11:00)、4.69(12月6日16:00)和4.21(12月13日16:00)分别代表清洁时段与两次污染过程的最小值.经计算清洁时段与两次污染过程中平均ρ(SOC)分别为(3.90±2.50)、(1.92±0.91)和(4.19±1.61)μg·m-3.第二次污染过程SOC值更高, 该阶段二次有机组分有明显地生成.这是因为冬季本地燃煤排放使得有机物增多, 污染期间大气颗粒物难以扩散, 前体物滞留时间长, 促进二次反应的发生, 因此SOC浓度较高[46].
2.3 PM2.5实时源贡献本研究解析得到的7类因子源成分谱如图 7所示.因子1中EC(43.2%)、OC(41.6%)和K(42.8%)的贡献率较大, 定义因子1为机动车尾气[49]; 因子2中贡献率较高的物种为Pb(52.0%)和As(49.3%), Pb来自化石燃料的燃烧[50], As被认为是煤燃烧的示踪剂[51], 定义因子2为燃煤; 因子3中贡献率较高的物种为SO42-(83.3%)、NH4+(69.1%)和NO3-(65.7%), 定义因子3为二次源; 因子4中Na+(77.1%)、Cl-(66.7%)和K+(32.3%)的占比较高, Cl-易在生物质燃烧排放的颗粒物中富集[52], K+是生物质燃烧的标识性元素[53], 定义因子4为生物质燃烧; 因子5中贡献较高的是Cr(63.1%)和As(37.5%), Cr主要来自钢铁制造、镀铬和不锈钢生产等冶炼过程[54], As也大量存在于冶炼行业排放的污染物中[55], 定义因子5为钢铁冶炼; 因子6中Zn(53.7%)、Mn(46.8%)、Fe(39.4%)和Cu(36.1%)等地壳元素贡献率较高, Zn、Mn和Fe大量存在于刹车和车辆轮胎的磨损粉尘中[56], 定义因子6为道路尘; 因子7中Ca(60.1%)、Ba(49.7%)、Fe(29.3%)和K(22.8%)等贡献率高, Ca是矿质组成元素之一, 在烟花爆竹制作过程中常用粘土封住爆竹的两端[57], Ba是烟花爆竹中主要的火焰着色剂[58], 烟花爆竹中常用KNO3作为燃烧主要的氧化剂[59~62].此外, 该因子的贡献量呈现特殊时段高值的特征, 在12月22日(冬至)前后出现大幅突增及回落, 最高值出现在12月22日07:00(86.0 μg·m-3, 图 8), 推测为庆祝冬至节气燃放烟花爆竹所致, 因此定义因子7为烟花爆竹燃放.

|
图 7 12月武汉市大气PM2.5源成分谱 Fig. 7 Source profiles of PM2.5 in Wuhan in December |

|
(a)机动车尾气, (b)燃煤, (c)二次源,(d)生物质燃烧, (e)钢铁冶炼, (f)道路尘, (g)烟花爆竹燃放 图 8 观测期间不同气团来向下各类污染源贡献量的时间序列及污染过程的来源特征对比 Fig. 8 Time series of contributions of pollution sources under different air masses during the observation period and comparison of source characteristics of pollution processes |
图 8给出了不同气团来向下, 各类污染源贡献的实时变化.观测期间对武汉市大气PM2.5贡献最大的是二次源(34.1%), 其次是机动车尾气(23.7%)、燃煤(11.5%)、道路尘(10.9%)、钢铁冶炼(8.7%)和烟花爆竹燃放(5.7%), 贡献率最小的是生物质燃烧(5.3%).对比两次污染过程的来源特征可以发现, 第一次污染过程中二次源贡献率最高(49.2%), 其次机动车尾气的贡献为25.5%; 第二次污染过程是以机动车尾气(27.0%)、二次源(26.5%)和燃煤(17.6%)为主要贡献源.与第一次污染过程相比, 二次源和生物质燃烧的贡献比例明显下降, 而其余5类源的贡献率均有不同程度地上升, 其中第二次污染过程燃煤的贡献率上升了2.7倍.
在4类气团中, 第二类气团反映了局地排放的影响. 12月6日18:00至8日19:00阶段为第二类气团主导, 该阶段钢铁冶炼与燃煤呈现出相似的峰值变化, 两者的贡献量均从12月7日01:00开始波动上升, 于12月8日08:00同时达到最高值(69.6 μg·m-3和75.5 μg·m-3). 12月12日23:00至15日09:00同样为第二类气团主导, 该阶段烟花爆竹燃放、道路尘、钢铁冶炼、燃煤和机动车尾气均出现明显的峰值.其中, 当烟花爆竹燃放在12月13日19:00出现最高值(45.5 μg·m-3)时, 道路尘也同样达到最高贡献量(71.7 μg·m-3).Tian等[63]的研究认为烟花爆竹的引爆会将已沉积在地面上的物质发生再悬浮, 从而使得颗粒物中地壳元素含量升高.此外, 机动车尾气和燃煤均在该阶段达到最高贡献量(124 μg·m-3和84.7 μg·m-3).上述两个时段, 钢铁冶炼、燃煤、道路尘和机动车尾气排放贡献同时表现出高值, 这与Li等[64]基于船舶走航观测的研究结果相似, 即长江沿线城市中与煤燃烧相关的PM污染十分严重; 长江沿线道路和建筑活动使得各类尘再悬浮呈现高值; 沿江分布的造船厂和钢铁冶炼等工业呈现高贡献值.这反映出沿江密集分布的工业过程、长江沿线各类工业企业原料和产品运输导致的机动车尾气排放, 以及道路尘对颗粒物的影响.
此外, 12月19日17:00至26日01:00阶段值得注意.生物质燃烧在12月20日00:00呈现高值(49.9 μg·m-3), 紧接着于04:00快速降低, 降幅达到0.5倍.同时, 二次源贡献量快速升高, 至12:00达到最高值(295 μg·m-3).时下气团为局地排放的第二类气团, 其对应的气象条件为高湿和低风速, 风速最低值达到0.31 m·s-1, 风向由西北风转为东北风.二次离子呈现明显峰值, ρ(NH4+)和ρ(NO3-)的最高值分别达到21.8 μg·m-3和24.5 μg·m-3, ρ(SO42-)自00:00开始逐步上升, 至12:00到达最高值(25.7 μg·m-3). ρ(K+)自01:00开始逐步上升至13:00到达最高值(1.16 μg·m-3), ρ(Cl-)自02:00开始上升至05:00达到最高值(6.77 μg·m-3), 此后大幅下降, 降幅达到0.5倍.Li等[65]的研究表明生物质燃烧排放的新鲜颗粒物中含有大量的KCl, 少量与SO42-结合生成K2SO4.此后, 在颗粒物传输过程中, KCl粒子与SO2之间发生光化学氧化和水相反应, 形成K2SO4并释放气态HCl.这反映出04:00之后生物质燃烧排放烟羽老化, KCl粒子向硫酸盐和硝酸盐发生转化[66].
2.4 PM2.5源贡献的日变化各类源贡献的昼夜变化如图 9所示, 钢铁冶炼的贡献量在08:00出现最高值[(17.5±18.8)μg·m-3], 01:00为最低值[(10.4±10.9)μg·m-3], 呈现白天贡献量高和夜晚贡献量低的规律, 这与钢铁冶炼过程变化有关[67].生物质燃烧的贡献量在中午12:00[(8.92±5.09)μg·m-3]和晚上22:00[(9.67±8.43)μg·m-3]出现两个峰值, 推测与城市周边地区居民仍使用生物质燃烧做饭和取暖有关.机动车尾气的贡献量在上午09:00[(42.1±24.8)μg·m-3]和晚上20:00[(41.6±19.5)μg·m-3]出现两个明显峰值, 这反映了早、晚交通高峰.其贡献量的最高值出现在凌晨01:00[(45.0±24.7)μg·m-3], 这与武汉市货车限行政策有关[68].

|
图 9 观测期间各类污染源贡献量的昼夜变化 Fig. 9 Diurnal variations in contributions of pollution sources during the observation period |
图 10对比了清洁时段与两次污染过程各类源的贡献.第一次污染过程与清洁时段及第二次污染过程相比, 二次源贡献明显升高, 且为占比最高的源.二次源的贡献率在凌晨03:00达到最高值(64.0%), 说明夜间高湿环境促进了液相反应的发生, 进而对二次离子的生成产生较大的促进作用[69].

|
(a)清洁时段, (b)EP1, (c)EP2; EP1共持续22 h, 其中18:00~19:00因TE和碳组分数据缺失所以模型输出各类源的贡献量空白 图 10 清洁和污染时段各类污染源贡献率的昼夜变化 Fig. 10 Diurnal variations in contribution rates of pollution sources during clean and pollution periods |
第二次污染过程与其它时段相比, 二次源和生物质燃烧的贡献比例明显下降, 约为清洁时段的0.7和0.3倍; 机动车尾气、燃煤、钢铁冶炼和道路尘的贡献率升高, 增幅达到1.2、1.7、1.1和1.1倍.如前所述, 上述源类的贡献高值, 气团来向为武汉东部短距离传输, 反映了沿江密集的工业过程、运输尾气排放和扰动引起的尘贡献.由此可见, 武汉东部地区, 长江沿线的工业分布对于武汉市冬季大气PM2.5的影响需要引起重视.
2.5 各类源的潜在贡献源区根据气团后向轨迹, 叠加PMF实时源解析结果, 采用CWT模型加权计算WCWT值, 从而得到各污染源的潜在源区.如图 11所示, 二次源主要受山东西南部菏泽、安徽合肥以北地区和河南除南阳以外地区的影响.机动车尾气主要受河北沧州以南地区、山东泰安以西地区、江西南昌以西北部地区、安徽铜陵以南地区和湖北武汉以东地区的影响.烟花爆竹燃放主要受湖北荆州以东地区、湖南益阳以东北部地区、江西吉安以北地区和河南南阳的影响.近些年尽管地方政府出台了严格的烟花燃放管控措施, 部分城市如北京[70]、上海[71]和深圳[72]等地因烟花燃放造成的霾污染仍时有发生.Yao等[73]的研究发现, 由于城区禁燃的相关规定, 部分烟花燃放开始由市区向郊区转移, 导致上海郊区在除夕夜前后PM2.5浓度要明显高于市区.湖南与江西省是我国重要的烟花爆竹生产基地.与其它地区相比, 其高贡献量可能是由于存在更多的烟花爆竹售卖点和燃放量.钢铁冶炼主要受湖北荆门以东地区、江西吉安以北地区和安徽黄山的部分影响.燃煤与其有相似的贡献量空间分布, 而目前钢铁冶炼、工业生产的锅炉主要以煤为燃烧燃料[74].这表明长江两岸分布的各种大型电厂、石化和钢铁工业、农田和船舶排放对长江航道的区域空气质量产生的影响[75].

|
(a)机动车尾气, (b)燃煤, (c)二次源, (d)生物质燃烧, (e)钢铁冶炼, (f)道路尘, (g)烟花爆竹燃放 图 11 观测期间PM2.5各贡献源的潜在源区 Fig. 11 Potential source regions for contributing sources of PM2.5 during the observation period |
生物质燃烧在研究区及其以北的区域呈现出较高的贡献量, 主要集中在河南全部地区、安徽除黄山和宣城以外地区、江苏镇江以北地区、河北保定以南地区和山西吕梁以南地区, 而研究区以南的区域贡献量较低.生物质燃烧排放主要集中在农业活动密集、农村人口数量多的区域[76].Wu等[77]的研究表明, 东北平原、华北平原、北方干旱半干旱区和黄土高原的秸秆焚烧(田间和室内)是生物质燃烧排放的主要来源, 平均贡献率为73%.由此, 冬季华北平原地区生物质燃烧排放的污染物经区域传输会对武汉产生影响.
3 结论(1) 2019年12月武汉市大气平均ρ(PM2.5)为(75.1±29.2)μg·m-3, 超出二级浓度限值.观测期间共有两次污染过程, 第一次污染过程主要受来自山西省西南部经由河南中东部传输至观测点的气团(35.5%)影响; 第二次污染过程则主要以来自安徽省西南部经长江航道传输至观测点的气团(40.6%)为主.第一次污染过程中水溶性离子升高是PM2.5呈现高值的主要原因, ρ(NH4+)、ρ(NO3-)和ρ(SO42-)分别是清洁时段的1.6、1.7和2.1倍; 第二次污染过程中二次有机组分有明显的生成.
(2) 观测期间对武汉市大气PM2.5贡献最大的是二次源(34.1%), 其次是机动车尾气(23.7%)、燃煤(11.5%)、道路尘(10.9%)、钢铁冶炼(8.7%), 烟花爆竹燃放(5.7%), 贡献率最小的是生物质燃烧(5.3%).
(3) 钢铁冶炼贡献量的日变化最高值出现在08:00[(17.5±18.8)μg·m-3], 01:00为最低值[(10.4±10.9)μg·m-3], 呈现白天贡献量高和夜晚贡献量低的现象; 生物质燃烧的贡献量在中午12:00[(8.92±5.09)μg·m-3]和晚上22:00[(9.67±8.43)μg·m-3]出现双峰; 机动车尾气的贡献量在上午09:00[(42.1±24.8)μg·m-3]和晚上20:00[(41.6±19.5)μg·m-3]出现明显峰值.
(4) 第一次污染过程中, 二次源贡献率明显升高且为占比最高的污染来源, 说明西北来向气团下的长距离传输有利于二次组分的生成和老化; 第二次污染过程中, 机动车尾气、燃煤、钢铁冶炼和道路尘的贡献率升高, 主要分布在湖北、江西西北部地区和安徽南部地区, 反映出沿江密集分布的工业过程排放、工业原材料和产品运输导致的尾气排放和运输扰动产生的道路扬尘等对于武汉市冬季大气PM2.5的影响.
(5) 生物质燃烧主要集中在河南、安徽除黄山和宣城以外地区、江苏镇江以北地区、河北保定以南地区和山西吕梁以南地区; 观测期间发现传输贡献高值(49.9 μg·m-3), 传输老化导致二次组分贡献增多.冬季华北平原区域生物质燃烧排放经传输对武汉大气PM2.5的影响不容忽视.
| [1] | Wang J, Hu Z M, Chen Y Y, et al. Contamination characteristics and possible sources of PM10 and PM2.5 in different functional areas of Shanghai, China[J]. Atmospheric Environment, 2013, 68: 221-229. DOI:10.1016/j.atmosenv.2012.10.070 |
| [2] | Hu W Y, Zhao T L, Bai Y Q, et al. Importance of regional PM2.5 transport and precipitation washout in heavy air pollution in the Twain-Hu Basin over Central China: Observational analysis and WRF-Chem simulation[J]. Science of the Total Environment, 2021, 758. DOI:10.1016/j.scitotenv.2020.143710 |
| [3] | Guo J P, Lou M Y, Miao Y C, et al. Trans-Pacific transport of dust aerosols from East Asia: Insights gained from multiple observations and modeling[J]. Environmental Pollution, 2017, 230: 1030-1039. DOI:10.1016/j.envpol.2017.07.062 |
| [4] | Miao Y C, Guo J P, Liu S H, et al. Relay transport of aerosols to Beijing-Tianjin-Hebei region by multi-scale atmospheric circulations[J]. Atmospheric Environment, 2017, 165: 35-45. DOI:10.1016/j.atmosenv.2017.06.032 |
| [5] | Jiang C, Wang H, Zhao T, et al. Modeling study of PM2.5 pollutant transport across cities in China's Jing-Jin-Ji region during a severe haze episode in December 2013[J]. Atmospheric Chemistry and Physics, 2015, 15(10): 5803-5814. DOI:10.5194/acp-15-5803-2015 |
| [6] | Yu S C, Zhang Q Y, Yan R C, et al. Origin of air pollution during a weekly heavy haze episode in Hangzhou, China[J]. Environmental Chemistry Letters, 2014, 12(4): 543-550. DOI:10.1007/s10311-014-0483-1 |
| [7] | Wang H L, Qiao L P, Lou S R, et al. Chemical composition of PM2.5 and meteorological impact among three years in urban Shanghai, China[J]. Journal of Cleaner Production, 2016, 112: 1302-1311. DOI:10.1016/j.jclepro.2015.04.099 |
| [8] | Fu X, Cheng Z, Wang S X, et al. Local and regional contributions to fine particle pollution in winter of the Yangtze River Delta, China[J]. Aerosol and Air Quality Research, 2016, 16(4): 1067-1080. DOI:10.4209/aaqr.2015.08.0496 |
| [9] | Chen Q, Sheng L F, Gao Y, et al. The effects of the trans-regional transport of PM2.5 on a heavy haze event in the Pearl River Delta in January 2015[J]. Atmosphere, 2019, 10(5). DOI:10.3390/atmos10050237 |
| [10] | Shen L J, Wang H L, Zhao T L, et al. Characterizing regional aerosol pollution in central China based on 19 years of MODIS data: Spatiotemporal variation and aerosol type discrimination[J]. Environmental Pollution, 2020, 263. DOI:10.1016/j.envpol.2020.114556 |
| [11] | Yu C, Zhao T L, Bai Y Q, et al. Heavy air pollution with a unique "non-stagnant" atmospheric boundary layer in the Yangtze River middle basin aggravated by regional transport of PM2.5 over China[J]. Atmospheric Chemistry and Physics, 2020, 20(12): 7217-7230. DOI:10.5194/acp-20-7217-2020 |
| [12] | Chen B, Xu X D. Climatology of wintertime long-distance transport of surface-layer air masses arriving urban Beijing in 2001-2012[J]. Atmospheric Environment, 2017, 151: 70-81. DOI:10.1016/j.atmosenv.2016.12.003 |
| [13] |
姚森, 张晗宇, 王晓琦, 等. 2016年1月京津冀地区大气污染特征与多尺度传输量化评估[J]. 环境科学, 2021, 42(2): 534-545. Yao S, Zhang H Y, Wang X Q, et al. Air pollution characteristics and quantitative evaluation of multi-scale transport in the Beijing-Tianjin-Hebei region in January, 2016[J]. Environmental Science, 2021, 42(2): 534-545. |
| [14] | Kong S F, Han R, Bai R P, et al. Receptor modeling of PM2.5, PM10 and TSP in different seasons and long-range transport analysis at a coastal site of Tianjin, China[J]. Science of the Total Environment, 2010, 408(20): 4681-4694. DOI:10.1016/j.scitotenv.2010.06.005 |
| [15] | Ding A J, Fu C B, Yang X Q, et al. Ozone and fine particle in the western Yangtze River Delta: an overview of 1 yr data at the SORPES station[J]. Atmospheric Chemistry and Physics, 2013, 13(11): 5813-5830. DOI:10.5194/acp-13-5813-2013 |
| [16] |
李瑞, 李清, 徐健, 等. 秋冬季区域性大气污染过程对长三角北部典型城市的影响[J]. 环境科学, 2020, 41(4): 1520-1534. Li R, Li Q, Xu J, et al. Regional air pollution process in winter over the Yangtze River Delta and its influence on typical Northern cities[J]. Environmental Science, 2020, 41(4): 1520-1534. |
| [17] | Fu X, Wang S X, Cheng Z, et al. Source, transport and impacts of a heavy dust event in the Yangtze River Delta, China, in 2011[J]. Atmospheric Chemistry and Physics, 2014, 14(3): 1239-1254. DOI:10.5194/acp-14-1239-2014 |
| [18] | Cheng S Y, Wang F, Li J, et al. Application of trajectory clustering and source apportionment methods for investigating trans-boundary atmospheric PM10 pollution[J]. Aerosol and Air Quality Research, 2013, 13(1): 333-342. DOI:10.4209/aaqr.2012.06.0154 |
| [19] | Cui H Y, Chen W H, Dai W, et al. Source apportionment of PM2.5 in Guangzhou combining observation data analysis and chemical transport model simulation[J]. Atmospheric Environment, 2015, 116: 262-271. DOI:10.1016/j.atmosenv.2015.06.054 |
| [20] | Lu X C, Yao T, Li Y, et al. Source apportionment and health effect of NOx over the Pearl River Delta region in southern China[J]. Environmental Pollution, 2016, 212: 135-146. DOI:10.1016/j.envpol.2016.01.056 |
| [21] | Sun J J, Huang L, Liao H, et al. Impacts of regional transport on particulate matter pollution in China: a review of methods and results[J]. Current Pollution Reports, 2017, 3(3): 182-191. DOI:10.1007/s40726-017-0065-5 |
| [22] | Dall'Osto M, Querol X, Amato F, et al. Hourly elemental concentrations in PM2.5 aerosols sampled simultaneously at urban background and road site during SAPUSS-diurnal variations and PMF receptor modelling[J]. Atmospheric Chemistry and Physics, 2013, 13(8): 4375-4392. DOI:10.5194/acp-13-4375-2013 |
| [23] | Morishita M, Keeler G J, Kamal A S, et al. Identification of ambient PM2.5 sources and analysis of pollution episodes in Detroit, Michigan using highly time-resolved measurements[J]. Atmospheric Environment, 2011, 45(8): 1627-1637. DOI:10.1016/j.atmosenv.2010.09.062 |
| [24] | Xu Q C, Wang S X, Jiang J K, et al. Nitrate dominates the chemical composition of PM2.5 during haze event in Beijing, China[J]. Science of the Total Environment, 2019, 689: 1293-1303. DOI:10.1016/j.scitotenv.2019.06.294 |
| [25] | Liu Y, Zheng M, Yu M Y, et al. High-time-resolution source apportionment of PM2.5 in Beijing with multiple models[J]. Atmospheric Chemistry and Physics, 2019, 19(9): 6595-6609. DOI:10.5194/acp-19-6595-2019 |
| [26] | Gao J J, Wang K, Wang Y, et al. Temporal-spatial characteristics and source apportionment of PM2.5 as well as its associated chemical species in the Beijing-Tianjin-Hebei region of China[J]. Environmental Pollution, 2018, 233: 714-724. DOI:10.1016/j.envpol.2017.10.123 |
| [27] | Peng X, Shi G L, Gao J, et al. Characteristics and sensitivity analysis of multiple-time-resolved source patterns of PM2.5 with real time data using Multilinear Engine 2[J]. Atmospheric Environment, 2016, 139: 113-121. DOI:10.1016/j.atmosenv.2016.05.032 |
| [28] | Gao J, Peng X, Chen G, et al. Insights into the chemical characterization and sources of PM2.5 in Beijing at a 1-h time resolution[J]. Science of the Total Environment, 2016, 542: 162-171. DOI:10.1016/j.scitotenv.2015.10.082 |
| [29] | Tian Y Z, Zhang Y F, Liang Y L, et al. PM2.5 source apportionment during severe haze episodes in a Chinese megacity based on a 5-month period by using hourly species measurements: explore how to better conduct PMF during haze episodes[J]. Atmospheric Environment, 2020, 224. DOI:10.1016/j.atmosenv.2020.117364 |
| [30] | Lv L L, Chen Y J, Han Y, et al. High-time-resolution PM2.5 source apportionment based on multi-model with organic tracers in Beijing during haze episodes[J]. Science of the Total Environment, 2021, 772. DOI:10.1016/j.scitotenv.2020.144766 |
| [31] | Bressi M, Sciare J, Ghersi V, et al. Sources and geographical origins of fine aerosols in Paris (France)[J]. Atmospheric Chemistry and Physics, 2014, 14(16): 8813-8839. DOI:10.5194/acp-14-8813-2014 |
| [32] | Lyu X P, Wang Z W, Cheng H R, et al. Chemical characteristics of submicron particulates (PM1.0) in Wuhan, Central China[J]. Atmospheric Research, 2015, 161-162: 169-178. DOI:10.1016/j.atmosres.2015.04.009 |
| [33] | 武汉市生态环境局. 2019年武汉市生态环境状况公报[EB/OL]. http://hbj.wuhan.gov.cn/fbjd_19/xxgkml/zwgk/hjjc/hjzkgb/202006/t20200608_1369067.html, 2020-06-08. |
| [34] | Liu D R, Deng Q L, Ren Z G, et al. Variation trends and principal component analysis of nitrogen oxide emissions from motor vehicles in Wuhan City from 2012 to 2017[J]. Science of the Total Environment, 2020, 704. DOI:10.1016/j.scitotenv.2019.134987 |
| [35] | Lyu X P, Chen N, Guo H, et al. Chemical characteristics and causes of airborne particulate pollution in warm seasons in Wuhan, central China[J]. Atmospheric Chemistry and Physics, 2016, 16(16): 10671-10687. DOI:10.5194/acp-16-10671-2016 |
| [36] | Zhang F, Wang Z W, Cheng H R, et al. Seasonal variations and chemical characteristics of PM2.5 in Wuhan, central China[J]. Science of the Total Environment, 2015, 518-519: 97-105. DOI:10.1016/j.scitotenv.2015.02.054 |
| [37] | Liao W J, Zhou J B, Zhu S J, et al. Characterization of aerosol chemical composition and the reconstruction of light extinction coefficients during winter in Wuhan, China[J]. Chemosphere, 2020, 241. DOI:10.1016/j.chemosphere.2019.125033 |
| [38] | Zheng H, Kong S F, Chen N, et al. Significant changes in the chemical compositions and sources of PM2.5 in Wuhan since the city lockdown as COVID-19[J]. Science of the Total Environment, 2020, 739. DOI:10.1016/j.scitotenv.2020.140000 |
| [39] | Lu M M, Tang X, Wang Z F, et al. Investigating the transport mechanism of PM2.5 pollution during January 2014 in Wuhan, central China[J]. Advances in Atmospheric Sciences, 2019, 36(11): 1217-1234. DOI:10.1007/s00376-019-8260-5 |
| [40] | Jongejan P A C, Bai Y, Veltkamp A C, et al. An automated field instrument for the determination of acidic gases in air[J]. International Journal of Environmental Analytical Chemistry, 1997, 66(4): 241-251. DOI:10.1080/03067319708028367 |
| [41] | Chow J C, Watson J G. Guideline on Speciated Particulate Monitoring[Z]. US EPA, 1998.4-37. |
| [42] | Khlystov A, Wyers G P, Slanina J. The steam-jet aerosol collector[J]. Atmospheric Environment, 1995, 29(17): 2229-2234. DOI:10.1016/1352-2310(95)00180-7 |
| [43] | Bauer J J, Yu X Y, Cary R, et al. Characterization of the sunset semi-continuous carbon aerosol analyzer[J]. Journal of the Air & Waste Management Association, 2009, 59(7): 826-833. |
| [44] | Paatero P, Tapper U. Positive matrix factorization: a non-negative factor model with optimal utilization of error estimates of data values[J]. Environmetrics, 1994, 5(2): 111-126. DOI:10.1002/env.3170050203 |
| [45] | Chow J C, Watson J G, Lu Z Q, et al. Descriptive analysis of PM2.5 and PM10 at regionally representative locations during SJVAQS/AUSPEX[J]. Atmospheric Environment, 1996, 30(12): 2079-2112. DOI:10.1016/1352-2310(95)00402-5 |
| [46] | Schauer J J, Kleeman M J, Cass G R, et al. Measurement of emissions from air pollution sources. 2. C1 through C30 organic compounds from medium duty diesel trucks[J]. Environment Science & Technology, 1999, 33(10): 1578-1587. |
| [47] | Schauer J J, Kleeman M J, Cass G R, et al. Measurement of emissions from air pollution sources. 5. C1 through C32 organic compounds from gasoline-powered motor vehicles[J]. Environmental Science & Technology, 2002, 36(6): 1169-1180. |
| [48] | Lian X B, Huang J P, Huang R J, et al. Impact of city lockdown on the air quality of COVID-19-hit of Wuhan city[J]. Science of the Total Environment, 2020, 742. DOI:10.1016/j.scitotenv.2020.140556 |
| [49] |
肖致美, 徐虹, 李立伟, 等. 基于在线观测的天津市PM2.5污染特征及来源解析[J]. 环境科学, 2020, 41(10): 4355-4363. Xiao Z M, Xu H, Li L W, et al. Characterization and source apportionment of PM2.5 based on the online observation in Tianjin[J]. Environmental Science, 2020, 41(10): 4355-4363. |
| [50] | Tian H Z, Wang Y, Xue Z G, et al. Trend and characteristics of atmospheric emissions of Hg, As, and Se from coal combustion in China, 1980-2007[J]. Atmospheric Chemistry and Physics, 2010, 10(23): 11905-11919. DOI:10.5194/acp-10-11905-2010 |
| [51] | Zhou S Z, Davy P K, Huang M J, et al. High-resolution sampling and analysis of ambient particulate matter in the Pearl River Delta region of southern China: source apportionment and health risk implications[J]. Atmospheric Chemistry and Physics, 2018, 18(3): 2049-2064. DOI:10.5194/acp-18-2049-2018 |
| [52] | Yao X H, Lau A P S, Fang M, et al. Size distributions and formation of ionic species in atmospheric particulate pollutants in Beijing, China: 1-inorganic ions[J]. Atmospheric Environment, 2003, 37(21): 2991-3000. DOI:10.1016/S1352-2310(03)00255-3 |
| [53] | Duan F K, Liu X D, Yu T, et al. Identification and estimate of biomass burning contribution to the urban aerosol organic carbon concentrations in Beijing[J]. Atmospheric Environment, 2004, 38(9): 1275-1282. DOI:10.1016/j.atmosenv.2003.11.037 |
| [54] | Song F, Gao Y. Size distributions of trace elements associated with ambient particular matter in the affinity of a major highway in the New Jersey-New York metropolitan area[J]. Atmospheric Environment, 2011, 45(37): 6714-6723. DOI:10.1016/j.atmosenv.2011.08.031 |
| [55] |
邓林俐, 张凯山, 殷子渊, 等. 基于PMF模型的PM2.5中金属元素污染及来源的区域特征分析[J]. 环境科学, 2020, 41(12): 5276-5287. Deng L L, Zhang K S, Yin Z Y, et al. Characterization of metal pollution of regional atmospheric PM2.5 and its sources based on the PMF model[J]. Environmental Science, 2020, 41(12): 5276-5287. |
| [56] |
张剑飞, 姜楠, 段时光, 等. 郑州市PM2.5化学组分的季节变化特征及来源解析[J]. 环境科学, 2020, 41(11): 4813-4824. Zhang J F, Jiang N, Duan S G, et al. Seasonal chemical composition characteristics and source apportionment of PM2.5 in Zhengzhou[J]. Environmental Science, 2020, 41(11): 4813-4824. DOI:10.3969/j.issn.1000-6923.2020.11.021 |
| [57] | Kong S F, Li L, Li X X, et al. The impacts of firework burning at the Chinese Spring Festival on air quality: insights of tracers, source evolution and aging processes[J]. Atmospheric Chemistry and Physics, 2015, 15(4): 2167-2184. DOI:10.5194/acp-15-2167-2015 |
| [58] | Wang Y, Zhuang G S, Xu C, et al. The air pollution caused by the burning of fireworks during the lantern festival in Beijing[J]. Atmospheric Environment, 2007, 41(2): 417-431. DOI:10.1016/j.atmosenv.2006.07.043 |
| [59] | Moreno T, Querol X, Alastuey A, et al. Recreational atmospheric pollution episodes: inhalable metalliferous particles from firework displays[J]. Atmospheric Environment, 2007, 41(5): 913-922. DOI:10.1016/j.atmosenv.2006.09.019 |
| [60] | Dutcher D D, Perry K D, Cahill T A, et al. Effects of indoor pyrotechnic displays on the air quality in the Houston Astrodome[J]. Journal of the Air & Waste Management Association, 1999, 49(2): 156-160. |
| [61] | Kulshrestha U C, Rao T N, Azhaguvel S, et al. Emissions and accumulation of metals in the atmosphere due to crackers and sparkles during Diwali festival in India[J]. Atmospheric Environment, 2004, 38(27): 4421-4425. DOI:10.1016/j.atmosenv.2004.05.044 |
| [62] | Drewnick F, Hings S S, Curtius J, et al. Measurement of fine particulate and gas-phase species during the New Year's fireworks 2005 in Mainz, Germany[J]. Atmospheric Environment, 2006, 40(23): 4316-4327. DOI:10.1016/j.atmosenv.2006.03.040 |
| [63] | Tian Y Z, Wang J, Peng X, et al. Estimation of the direct and indirect impacts of fireworks on the physicochemical characteristics of atmospheric PM10 and PM2.5[J]. Atmospheric Chemistry and Physics, 2014, 14(18): 9469-9479. DOI:10.5194/acp-14-9469-2014 |
| [64] | Li Z, Li C L, Ye X N, et al. Air quality in the middle and lower reaches of the Yangtze River channel: a cruise campaign[J]. Atmospheric Chemistry and Physics, 2018, 18(19): 14445-14464. DOI:10.5194/acp-18-14445-2018 |
| [65] | Li J, Pósfai M, Hobbs P V, et al. Individual aerosol particles from biomass burning in southern Africa: 2, Compositions and aging of inorganic particles[J]. Journal of Geophysical Research: Atmospheres, 2003, 108(D13). DOI:10.1029/2002JD002310 |
| [66] | Li J, Anderson J R, Buseck P R. TEM study of aerosol particles from clean and polluted marine boundary layers over the North Atlantic[J]. Journal of Geophysical Research: Atmospheres, 2003, 108(D6). DOI:10.1029/2002JD002106 |
| [67] | Merico E, Grasso F M, Cesari D, et al. Characterisation of atmospheric pollution near an industrial site with a biogas production and combustion plant in southern Italy[J]. Science of the Total Environment, 2020, 717. DOI:10.1016/j.scitotenv.2020.137220 |
| [68] | Kleeman M J, Schauer J J, Cass G R. Size and composition distribution of fine particulate matter emitted from motor vehicles[J]. Environment Science & Technology, 2000, 34(7): 1132-1142. |
| [69] | Ravishankara A R. Heterogeneous and multiphase chemistry in the troposphere[J]. Science, 1997, 276(5315): 1058-1065. DOI:10.1126/science.276.5315.1058 |
| [70] | Zhang Y Y, Wei J M, Tang A H, et al. Chemical characteristics of PM2.5 during 2015 Spring Festival in Beijing, China[J]. Aerosol and Air Quality Research, 2017, 17(5): 1169-1180. DOI:10.4209/aaqr.2016.08.0338 |
| [71] | Chang Y H, Deng C R, Cao F, et al. Assessment of carbonaceous aerosols in Shanghai, China - part 1: long-term evolution, seasonal variations, and meteorological effects[J]. Atmospheric Chemistry and Physics, 2017, 17(16): 9945-9964. DOI:10.5194/acp-17-9945-2017 |
| [72] | Lai Y H, Brimblecombe P. Regulatory effects on particulate pollution in the early hours of Chinese New Year, 2015[J]. Environmental Monitoring and Assessment, 2017, 189(9). DOI:10.1007/s10661-017-6167-0 |
| [73] | Yao L, Wang D F, Fu Q Y, et al. The effects of firework regulation on air quality and public health during the Chinese Spring Festival from 2013 to 2017 in a Chinese megacity[J]. Environment International, 2019, 126: 96-106. DOI:10.1016/j.envint.2019.01.037 |
| [74] | Sun Z Y, Zong Z, Tian C G, et al. Reapportioning the sources of secondary components of PM2.5: a combined application of positive matrix factorization and isotopic evidence[J]. Science of the Total Environment, 2021, 764. DOI:10.1016/j.scitotenv.2020.142925 |
| [75] | Fu H B, Shang G F, Lin J, et al. Fractional iron solubility of aerosol particles enhanced by biomass burning and ship emission in Shanghai, East China[J]. Science of the total Environment, 2014, 481: 377-391. DOI:10.1016/j.scitotenv.2014.01.118 |
| [76] | Wu J, Kong S F, Zeng X, et al. First high-resolution emission inventory of levoglucosan for biomass burning and non-biomass burning sources in China[J]. Environmental Science & Technology, 2021, 55(3): 1497-1507. |
| [77] | Wu J, Kong S F, Wu F Q, et al. The moving of high emission for biomass burning in China: View from multi-year emission estimation and human-driven forces[J]. Environment International, 2020, 142. DOI:10.1016/j.envint.2020.105812 |