 2021, Vol. 42


2. 中国科学院生态环境研究中心, 北京 100085;
3. 中国科学院大学, 北京 100049
2. Research Center for Eco-Environment Sciences, Chinese Academy of Sciences, Beijing 100085, China;
3. University of Chinese Academy of Sciences, Beijing 100049, China
持久性有机污染物(persistent organic pollutants, POPs)由于其具有长期残留性、生物蓄积性、半挥发性和高毒性, 已经成为主要环境问题之一, 引起了全球范围的关注[1].六氯丁二烯(hexachlorobutadiene, HCBD)是一种卤化脂肪烃[2], 2012年被提议作为持久性有机污染物的候选者[3].在调查和研究了其危害后, 2015年斯德哥尔摩公约第七次缔约方大会, HCBD作为一种新型的持久性有机污染物增列入《关于持久性有机污染物的斯德哥尔摩公约》附件A(消除类)[4], 缔约方必须采取措施消除HCBD的生产和使用.2017年第八次缔约方大会将其增列入附件C(无意生产类), 来控制其无意释放[5].
HCBD可以用作液压油、润滑剂和传热液, 也可以用于生产铝、石墨棒和聚合物的溶剂[6], 以及农业活动中的除草剂[7].20世纪80年代, 工业和农业上的广泛应用导致自然界产生了大量的HCBD, 由于其三致毒性以及潜在的生殖毒性等, 很多国家已经停止了其有意生产, 但是无意排放仍然存在, 主要来自工业生产及应用[8].近年来, 欧美等国家HCBD无意排放量大幅下降.1975~2011年美国HCBD无意排放量从50 t下降到1.06 t, 环境中的浓度也有所降低[9].欧洲经济委员会成员国HCBD排放情况与美国类似[10].Wang等[8]的研究估算, 1992~2016年我国HCBD排放量从60.8 t增加到2 871.5 t, 工业活动年均总排放量为1 043.3 t, 其中HCBD生产部门年均总排放量达864.3 t, 占总量的82.8%.生产部门主要包括生产三氯乙烯[11~13](trichloroethylene, TCE)、四氯乙烯[14~16](perchloroethylene, PCE) 和电解法制造镁[17]的过程中的副产物.TCE生产过程中HCBD排放量占生产部门总排放量的73.0%, PCE生产过程占24.5%[8].镁生产过程中产生的HCBD仅占总量的1%[18], 主要是因为2000年新型工艺皮江法广泛应用于镁的制造, 该方法是用硅铁还原剂将煅烧白云石还原成金属镁的热还原法, 此过程中不会产生HCBD[19].HCBD的工业应用主要包括油漆[20]、防水塑料[21]和橡胶[22]的生产, 但这些过程中HCBD排放量不足总量的8%.因此, 我国工业活动中HCBD排放主要来自TCE和PCE生产过程中的副产物.
据文献[23]估计, 在欧盟27个成员国中, 每年最终排入污泥中的HCBD总量为6 kg.有研究表明, 我国不同地区37个污水处理厂的污泥中HCBD检出率为76.0%[24, 25], 中国台湾高雄3个排污口附近也检测到了HCBD[n.d.(未检出, 下同)~47.4 ng ·g-1][26].长江、淮河、黄河、海河和辽河这5个主要流域典型饮用水源中HCBD浓度范围为0.1~1.23 μg ·L-1[27], 远高于日本(n.d.~0.000 043 μg ·L-1)[28]、西班牙(n.d.~0.000 05 μg ·L-1)[29]和韩国(0.029~0.067 μg ·L-1)[30]的检出水平.河南省检测到大气中HCBD为15.5 μg ·m-3[31], 而2013年在美国市区中检测到HCBD平均浓度仅为0.09 μg ·m-3[32].这些数据都表明, 我国是HCBD的主要排放国.
京津冀、长三角和珠三角地区作为我国重点城市集群, 人口数量庞大, 经济和工业发展迅猛, 同时伴随的环境污染问题也越来越严重.鉴于此, 本研究以2018年为基准年, 对我国京津冀、长三角和珠三角地区HCBD的来源以及污染特征进行分析, 以期为经济快速发展区HCBD污染防治措施及相关政策制定提供科学支撑.
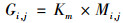
1 材料与方法 1.1 研究对象本文以HCBD为研究对象, 以中国三大经济快速发展区京津冀(北京、天津和河北)、长三角(浙江、上海、安徽和江苏)及珠三角地区(广东)为研究区域.环境中HCBD污染主要有2类来源:工业生产过程中的副产物以及污水处理厂污水污泥中的无意排放, 其中工业来源占主导地位(图 1).我国HCBD的工业来源主要是TCE和PCE生产过程中产生的副产物.TCE和PCE主要用作金属脱脂剂、金属清洗剂、金属部件加工表面处理剂、溶剂、有机萃取剂、织物及羊毛干洗剂等[33~36].而HCBD作为其工业生产中的副产物处理途径分为4类:第1类作为普通的工业废物处理, 第2类从混合副产品中提纯, 第3类进行分馏回收, 第4类高温焚烧.含有HCBD的工业废水和生活废水最终通过污水处理厂排放到地表水.同时未经有效处理处置的污泥和含有HCBD的固体废物一起被填埋, 极易对土壤造成二次污染.HCBD可通过地表渗流和土壤淋溶这2个主要途径进入地下水.因此, 本研究以2018年为基准年份, 探讨其主要排放源工业生产过程和污水处理厂, 并分析HCBD在水体和土壤中的污染特征.

|
图 1 HCBD来源与污染途径示意 Fig. 1 Schematic diagram of HCBD sources and pollution pathways |
本研究中TCE和PCE生产总量来自于浙江巨化股份有限公司、安徽芜湖融汇化工有限公司和深圳铭诚化工有限公司等企业2018年度报告数据[37~40], 生活废水和工业废水排放量来自各省份2019年统计年鉴数据[41~48], 具体数据见表 1, 污泥排放量是基于废水排放量同时依据文献[49]中的污泥估算法进行计算.
|
|
表 1 2018年三大经济快速发展区废水排放量及TCE和PCE产量 Table 1 Wastewater discharge and TCE and PCE output in China's rapid economic development area in 2018 |
1.3 研究方法 1.3.1 工业生产中HCBD排放量的估算方法
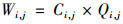
HCBD作为工业生产过程的副产物时排放量计算公式:
|
(1) |
式中, G为HCBD年排放量, t; K为HCBD排放系数, 其中在TCE生产过程中的排放系数为0.4%[50], 在PCE生产过程中的排放系数为0.4%[8]; M为产品产量, t; i为HCBD排放年份; j为HCBD排放省份; m为工业产品种类.
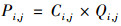
1.3.2 废水中HCBD年排放量的估算方法HCBD在废水中的年排放量计算公式:
|
(2) |
式中, W为HCBD在废水中的年排放量, kg; C为污水处理厂出水口HCBD的平均浓度, mg ·L-1; Q为年废水排放量, 万t; i为HCBD排放年份; j为HCBD排放省份.
1.3.3 污泥中HCBD年排放量的估算方法HCBD在污泥中的年排放量计算公式:
|
(3) |
式中, P为HCBD在污泥中的年排放量, kg; C为污水处理厂污泥中HCBD的平均含量, ng ·g-1; Q为污泥年排放量, 万t; i为HCBD排放年份; j为HCBD排放省份.
2 结果与讨论 2.1 HCBD工业来源以2018年为基准年份, 对京津冀、长三角和珠三角地区的TCE和PCE生产过程中HCBD的排放量进行计算.经过估算, 2018年三大区域工业生产过程中排放的HCBD总量为498.46 t, 其中长三角地区HCBD总排放量达497.8 t, 远高于京津冀(0.370 t)和珠三角(0.296 t)地区.这主要是因为三大区域TCE和PCE年产量在万t以上的工厂主要集中在长三角地区.该地区工业活动中HCBD排放有66.9%来自TCE的生产过程.而京津冀和珠三角地区HCBD的工业排放全部来自于TCE的生产.这主要是因为TCE作为氯碱行业下游产品在国内得到飞速发展, 其产量逐年增加[51]. 2013年浙江巨化股份有限公司电化厂实现年均产能8万t、安徽芜湖融汇化工有限公司实现年均产能8万t[52].我国PCE生产起步较晚, 20世纪50年代开始从事其研制, 直至80年代才真正实现工业化.PCE生产厂家集中在安徽省、浙江省和江苏省, 其中浙江巨化股份有限公司生产量最大, 年产量达4万t[53].总体来看, 三大区域中长三角地区工业活动无意排放HCBD总量最高, 其中TCE生产过程排放量占比高于PCE生产过程.Wang等[8]的研究估算2016年我国HCBD工业活动中无意排放总量达1 043.3 t, 而其主要来源于TCE和PCE的生产.近年来, 欧美等国家无意排放的HCBD大幅度下降, 2011年美国HCBD无意排放量仅为1.064 t[5], 欧洲氯代烃生产过程中HCBD排放量也下降到0.7~500 kg[8].本研究中估算结果, 仅三大区域工业生产过程中HCBD排放总量就达498.46 t.因此与其他国家相比, 我国工业生产过程中HCBD的无意排放量较高.随着HCBD排放量增加, 对于环境的压力越来越大, 因此对于HCBD的研究刻不容缓.
2.2 HCBD污水处理厂来源 2.2.1 污水中HCBD来源在我国三大经济快速发展区中, 污水处理厂进水口HCBD[24, 25, 54~58]浓度较高.图 2为三大区域污水处理厂进水及出水中HCBD的分布.长三角地区4个省份进水口HCBD的平均浓度范围在2.27~4.56 μg ·L-1, 高于珠三角(0.28~3.42 μg ·L-1)和京津冀地区(1.03~1.4 μg ·L-1).其中浙江省污水处理厂进水口HCBD浓度中位数偏高为5.2 μg ·L-1, 几乎是河北省(0.7 μg ·L-1)的7倍.这是因为长三角地区工业发展较为迅速, TCE和PCE的主要生产厂也集中在此, 导致工业废水中HCBD浓度偏高.安徽某污水处理厂进水口HCBD浓度高达9.34 μg ·L-1, 该厂的污水主要来源是一家油漆工厂排放的工业废水[24], 江苏省某橡胶厂工业废水排放至污水处理厂中HCBD的浓度也高达7.23 μg ·L-1[59]. Wang等[8]的研究表明, 油漆和橡胶的生产是我国HCBD消费部门中污染排放的主要来源, 因此, 其生产工厂排放的废水中HCBD的浓度较高.经过污水处理厂处理后, 出水口处HCBD的浓度减少.三大区域出水口HCBD浓度均未超过0.1 μg ·L-1, 其中长三角地区出水口HCBD平均浓度为0.05 μg ·L-1, 高于京津冀和珠三角地区.虽然出水口HCBD浓度较低, 但是含有HCBD的废水会进入地表水, 并通过地表渗流作用污染土壤和地下水.

|
图 2 我国三大经济快速发展区污水处理厂进出水口HCBD浓度 Fig. 2 HCBD concentrations in inlet and outlet of wastewater treatment plants in China's rapid economic development areas |
自2004年以来, 我国三大区域废水排放总量整体呈现增长趋势, 2012年后增长速度缓慢, 其中广东省和江苏省是废水产生大省.广东省2018年废水排放总量达7.89×10⁵万t, 占三大区域的28.7%, 其中生活废水排放量为6.99×10⁵万t.同年江苏省废水排放总量为5.83×10⁵万t, 占三大区域的21.2%.长三角、珠三角和京津冀这三大区域中, 生活污水年排放量均高于工业废水年排放量.
根据废水中污染物的年排放量计算公式(2), 对京津冀、长三角、珠三角地区2018年废水中HCBD的排放量进行估算.估算结果如图 3, 长三角地区生活废水中HCBD总排放量为68.5 kg, 高于京津冀(14.7 kg)和珠三角地区(6.99 kg), 占三大区域生活废水中HCBD排放总量的76.0%.其中江苏省排放量为30.3 kg, 占长三角地区排放总量的44.2%.京津冀地区生活废水中HCBD排放量有63.1%来自于河北省.基于地区生产总值估算了HCBD排放强度, 三大区域废水中HCBD排放强度均低于0.000 5 kg ·亿元-1, 由此可见生活污水中HCBD污染程度较低.三大区域工业废水中HCBD总排放量为275 kg, 其中有74.9%来自长三角地区, 而该地区中江苏省工业废水中HCBD排放量为120 kg, 占长三角地区的58.5%.江苏、安徽和浙江这3个省份工业废水HCBD排放强度相比其他省份较高, 这表明其经济发展的环境成本较大.虽然三大区域生活废水排放量(2.26×10⁶万t)远高于工业废水排放量(4.89×10⁵万t), 但是工业废水中HCBD排放量(275 kg)高于生活废水中HCBD排放量(90.2 kg), 这是因为工业废水中HCBD浓度偏高.总体来看, 三大区域中长三角地区废水中HCBD排放量最高, 这与该地区工业发展相关, 一些无意排放HCBD的生产工厂集中在该地区, 给环境造成较大压力.

|
图 3 2018年我国三大经济快速发展区废水中HCBD排放总量及排放强度 Fig. 3 Total emissions and intensity of HCBD discharged from wastewater in China's rapid economic development areas in 2018 |
含有HCBD的污水经处理后, 一部分会留在废水中, 一部分进入污泥.Gong等[60]的研究表明, 废水处理可以去除部分污染物, 但HCBD很容易吸附在污泥中而使处理不彻底.因此, 污水处理厂污泥中HCBD的排放也应该引起重视.表 2为京津冀、长三角和珠三角地区污水处理厂污泥中HCBD的含量.可以看出, 工业废水处理厂污泥中HCBD的含量明显高于生活污水处理厂污泥中的含量.江苏省一家处理化工厂工业废水的污水处理厂污泥中的含量测得的最大值为110 ng ·g-1, 浙江省一家处理油漆厂工业废水的污水处理厂污泥中的含量也高达10.7 ng ·g-1.由于HCBD被用于油漆和橡胶中溶剂的生产, 所以处理来自油漆厂废水的污水处理厂污泥中HCBD含量偏高.处理生活污水的城镇污水处理厂污泥中HCBD含量普遍较低, 均没有超过0.5 ng ·g-1.污泥中HCBD含量与污水中相似, 均是工业污染高于生活污染.
|
|
表 2 三大经济快速发展区污水处理厂污泥中HCBD的含量1) Table 2 Concentration of HCBD in the sludge of wastewater treatment plants in China's rapid economic development areas |
文献[49]中指出, 污水处理厂污泥主要来自初次沉淀池和二次沉淀池等工艺环节, 每104m3污水经处理后污泥产生量(按含水率80%计)一般约为5~10 t, 但其实际产量与进水水质及处理工艺等因素相关.根据2015年实际污水排放量产生的污泥量[62], 本研究中估算污泥年排放量时按照每104m3污水经处理后产生7.2 t污泥(按含水率80%计)进行计算.图 4为2018年京津冀、长三角和珠三角地区污泥中HCBD总排放量. 2018年三大区域生活污泥中HCBD总排放量为164.3 kg, 其中长三角地区排放量为105 kg, 占三大区域的63.9%, 几乎是京津冀(18.9 kg)、珠三角(40.2 kg)地区总排放量的2倍.工业污泥中HCBD排放量远高于生活污泥, 其总排放量为353.9 kg, 其中长三角地区占比为75.8%, 这与工业废水中HCBD排放量占比相近.虽然江苏省污泥中HCBD排放量较大, 但是其排放强度和浙江省相近.虽然三大区域生活污泥排放量(325万t)高于工业污泥排放量(70.4万t), 但是工业污泥中HCBD排放量高于生活污泥中HCBD排放量, 这是因为工业污泥中HCBD含量偏高.三大区域污泥中HCBD总排放量为518.2 kg, 高于污水中HCBD总排放量365.3 kg. HCBD更易在污泥中沉积, 并随着污泥填埋等处置释放到环境中.因此, 污水处理厂中HCBD的污染排放问题要引起重视.根据估算结果, 2018年三大区域污水处理厂污水污泥中无意排放的HCBD总量为883.5 kg, 远小于工业生产中无意排放的HCBD总量498.4 t.而TCE和PCE的产量呈上升趋势, 因此工业生产中的无意排放仍是HCBD最主要来源.

|
图 4 2018年我国三大经济快速发展区污泥中HCBD的总排放量及排放强度 Fig. 4 Total emissions and intensity of HCBD discharged from sludge in China's rapid economic development areas in 2018 |
结合三大区域HCBD工业来源和污水处理厂污水污泥排放的分析结果, 可以看出, 在三大经济快速发展区中, HCBD排放主要来自于长三角地区.这是因为长三角地区工业发展较快, 而快速的工业化进程不断加大对环境保护的压力, 使得污染物排放到环境当中, 危害了人类健康, 因此分析其污染分布情况也能为下一步治理工作提供支撑.
2.3 水体中HCBD的污染特征在HCBD被作为副产物生产和使用以及作为废物处理处置的过程中, 可能会释放到周围的环境.由于HCBD具有半挥发性, 因此其可以迁移到其他地区, 并且通过挥发、吸收、沉积和生物蓄积而在不同的介质中进行转移.自2012年HCBD被提议作为持久性有机污染物以来, 许多国家已经停止或限制其商业生产和使用, 这使得HCBD排放量有所下降, 但在某些区域, HCBD的含量会随着历史残留物的释放以及无意生产而增加.
京津冀、长三角和珠三角地区水体中均有不同程度的HCBD污染, 其中珠三角地区自然水体中HCBD平均浓度最高.图 5显示了这三大区域水体中HCBD的平均浓度.长三角地区4个省份自然水体中HCBD平均浓度范围为0.09~0.47 μg ·L-1[63~65]. 上海市自然水体中HCBD的浓度非常低, 仅检测到0.09 μg ·L-1的HCBD, 其余3个省市HCBD浓度相对较高[67~70], 但都没有超过自然水体中的标准浓度限值0.6 μg ·L-1[71].京津冀地区自然水体中HCBD含量整体较低, 北京、天津和河北平均浓度分别为0.23、0.39和0.13 μg ·L-1, 在很多市区并未检测出HCBD[72, 73].珠三角地区自然水体中HCBD的含量较高, 平均浓度为0.64 μg ·L-1(剔除极值点349.02 μg ·L-1)超过标准浓度限值, 其中广东省东江流域的河水中HCBD的浓度为1.04 μg ·L-1[74].广东省某废弃工厂地下水中HCBD浓度高达349.02 μg ·L-1[75].该区域HCBD浓度含量较高主要是因为废弃化工厂未经妥善处理而污染地下水.Maire等[76]的研究发现, 1960年法国氯代有机物泄漏产生了含有HCBD的液体, 然后迁移到10 m深的土壤, 通过长时间释放到地下水, 导致地下水中HCBD含量高达1 400 μg ·L-1.总体来看, 自然水体中HCBD含量与工业污染相关, 一些高排放地区自然水体中的HCBD含量也相对较高.Lysychenko等[77]的研究发现, 1973~2001年间, 约有15 000 t含有大量HCBD的工业废物被填埋在某垃圾处理厂, 附近地表水和土壤样品中均检测到较高含量的HCBD, 分别为4 000 μg ·L-1和30 ng ·g-1.因此, 妥善处理含有HCBD的工业废物, 以免其污染水体和土壤.

|
虚线表示世界卫生组织规定标准浓度限值 图 5 三大快速经济发展区水体中HCBD的浓度 Fig. 5 Concentration of HCBD in water bodies in China's rapid economic development areas |
2007年7月1日起我国全面实施新版《生活饮用水卫生标准》(GB 5749-2006), 毒理指标中的有机化合物新增至53项, 其中HCBD成为一项重要的水质检测指标[78].一些研究报道指出, 中国一些城市饮用水中均检测到了HCBD.北京、天津和河北这3个省市饮用水中检测到HCBD平均浓度均未超过0.2 μg ·L-1[79~83].长三角地区中, 安徽省和上海市的饮用水中HCBD的含量较低, 平均浓度分别为0.12 μg ·L-1和0.04 μg ·L-1, 江苏省的平均浓度为0.23 μg ·L-1, 浙江省饮用水中检测出HCBD的浓度高于其他3个省份为0.25 μg ·L-1[84].珠三角地区饮用水中HCBD平均浓度为0.04 μg ·L-1, 三大区域饮用水中HCBD浓度均未超过世界卫生组织规定的浓度限值0.6 μg ·L-1.对于HCBD而言, 人体中无可见不良作用剂量水平为0.05 mg ·kg-1[85], 有研究发现人通过大气、食物和饮用水等途径每日摄入HCBD约为0.1×10⁻⁴~2×10⁻⁴ mg ·kg-1[86], 因此, 除去高污染地区, 正常的情况下, 环境中的HCBD对于人体健康的危害不大.
2.4 土壤中HCBD的污染特征HCBD进入土壤环境中可能通过以下方式:地表径流、使用含HCBD杂质的有机氯农药残留、在处理处置含有HCBD的废弃物过程中意外泄漏以及工厂等点源周围大气的迁移和沉积等[17].
虽然污染物水平较低,但是在三大经济快速发展区的农业土壤中也广泛存在HCBD.长三角地区农田表层土壤中检测到HCBD, 其范围为0.07~8.47 ng ·g-1[87].江苏省镇江、盐城和淮安市农田土壤中HCBD含量均未超过8 ng ·g-1[88~90].安徽省农田土壤中的HCBD含量为0.51 ng ·g-1[91], 浙江省土壤中含量为1.67 ng ·g-1[92].长三角地区农田土壤中HCBD含量均高于京津冀(0.03~1.12 ng ·g-1)和珠三角地区(1.77 ng ·g-1).中国并没有关于农田土壤中HCBD的浓度限值, 根据加拿大萨斯喀彻温省环境部发表的含量限值, 农业细粒土壤中HCBD的限值为10 ng ·g-1[93].图 6为三大经济快速发展区土壤中HCBD的含量, 可以发现, 三大区域农田土壤中HCBD的含量较低且均未超过限值.在三大区域中, 京津冀地区土壤中HCBD的含量相对较少, 长三角和珠三角地区土壤中HCBD污染情况相较于京津冀地区较为严重, 这与2个地区的农业发展有关.2018年长三角地区总耕地面积为1.5×10⁷ hm2[44~47], 占三大区域总耕地面积的58.1%.该地区单位面积农药使用量为16.0 kg ·hm-2, 高于京津冀[41~43](11.8 kg ·hm-2)和珠三角[48](13.3 kg ·hm-2)地区.农田耕种过程中使用含有HCBD的农药, 导致HCBD进入土壤环境, 因为其具有持久性很难被降解, 即使现在农药使用率很低但因其历史使用也会导致现在农田土壤环境中HCBD的残留.

|
虚线表示加拿大萨斯喀彻温省环境部发表农业细粒土壤中HCBD的含量限值 图 6 三大经济快速发展区土壤中HCBD的含量 Fig. 6 Concentration of HCBD in the soil in China's rapid economic development areas |
除了农田土壤外, 化工厂、橡胶厂、农药厂以及油漆厂周边的土壤中也检测到较高含量的HCBD.长三角地区中江苏省某化工厂土壤中发现了较高浓度的HCBD, 其含量为27.9 ng ·g-1[24], 该化工厂主要生产氯代有机物.本研究发现, 随着离该厂区距离的增加, HCBD的浓度快速下降, 该厂是污染的主要源头.广东省某农药厂周围土壤中也检测到较高的HCBD达28.67 ng ·g-1[94].京津冀地区中某垃圾焚烧厂周围土壤中HCBD含量高达53 ng ·g-1[95].HCBD在土壤中的分布具有局部区域性, 一些工厂周围成为主要的高污染地区.一部分以填埋形式进行处理的含有HCBD的工业废弃物, 其渗滤液会随着时间推移进入土壤中, 再经过渗流进入地下水, 日积月累造成浅层地下水水质变差.2011年Matejczyk等[96]在报告中阐述, 在波兰上西里西亚省的22个垃圾填埋场中, 有45%的渗滤液检出HCBD.某些情况下, 有害化学废物可能被存放在简易填埋场中, 随着时间发展, 废弃物容器被腐蚀因此会产生有毒渗滤液.由于防渗层设计不良, 渗滤液将直接排放到环境中, 污染周围土壤和地下水, 最终通过食物链进入人体.HCBD可在人体中形成有毒代谢, 对人体健康产生不利影响, 如果人体长期接触HCBD, 那么致癌的可能性会增加.根据文献[23]中收录的HCBD危害实例, 俄罗斯葡萄园的工人由于长期接触含有HCBD的杀虫剂, 导致动脉低血压症、上呼吸道和肝脏病变等病症的发病率增加.虽然三大区域农田土壤中HCBD平均浓度都在限制范围内, 对于生物群体的安全性影响较低, 但是在一些浓度含量相对较高的工业点源附近风险性较高, 如果长期生活在高污染地区附近, 那么人体健康将面临极大风险.因此对于HCBD污染较重的地区应该引起高度关注.
3 结论本文研究了中国三大经济快速发展区京津冀、长三角和珠三角地区HCBD的主要来源和排放量, 以及在水体和土壤中的分布特征.2018年长三角、京津冀和珠三角地区来自TCE和PCE生产副产物的HCBD总排放量分别为497.8、0.37和0.29 t, 其中来自TCE生产副产物的占比为66.9%.污水处理厂污水中HCBD的排放量为274.5、59.5和31.2 kg, 污泥中为373.5、65.5和79.1 kg, 其中工业和生活污水处理厂排放量分别为628.9 kg和254.6 kg.分析表明, 三大区域HCBD主要来源是TCE生产副产物, 长三角地区HCBD排放量最高.长三角、京津冀和珠三角地区自然水体中HCBD平均浓度分别为0.35、0.25和0.64 μg ·L-1, 饮用水中HCBD平均浓度为0.16、0.09和0.04 μg ·L-1.工业土壤中HCBD含量显著高于农田土壤, 分别为9.3~24.6 ng ·g-1和0.13~2.67 ng ·g-1, 主要是受该地区产生HCBD副产物的企业影响.总体来看, 由于长三角地区氯代烃生产、油漆、塑料和橡胶等工业企业发展迅速, 该地区HCBD排放量显著高于其他两个地区, 导致污染较重, 亟需引起重视.
| [1] | O'Dwyer T. Tracking the distribution of persistent organic pollutants[J]. Applied Catalysis B: Environmental, 1996, 11(1): N2-N3. |
| [2] | Cristofori P, Defazio R, Chiusolo A, et al. Hyaline droplet accumulation in kidney of rats treated with hexachloro-1:3-butadiene: influence of age, dose and time-course[J]. Journal of Applied Toxicology, 2013, 33(3): 183-189. DOI:10.1002/jat.1732 |
| [3] | Persistent Organic Pollutants Review Committee. Risk profile on hexachlorobutadiene[EB/OL]. http://chm.pops.int/Default.aspx?tabid=2301, 2012-07-21. |
| [4] | U.S. Environmental Protection Agency Office of Water. Health effects support document for hexachlorobutadiene[R]. Washington: U.S. Environmental Protection Agency, 2003. |
| [5] | Persistent Organic Pollutants Review Committee. Evaluation of new information in relation to the listing of hexachlorobutadiene in Annex C to the Stockholm Convention on Persistent Organic Pollutants (executive summary)[EB/OL]. http://chm.pops.int/TheConvention/POPsReviewCommittee/Reports/tabid/2301/Default.aspx, 2016-10-11. |
| [6] | Cristofori P, Sauer A V, Trevisan A. Three common pathways of nephrotoxicity induced by halogenated alkenes[J]. Cell Biology and Toxicology, 2015, 31(1): 1-13. DOI:10.1007/s10565-015-9293-x |
| [7] | Lava R, Majoros L I, Dosis I, et al. A practical example of the challenges of biota monitoring under the Water Framework Directive[J]. TrAC Trends in Analytical Chemistry, 2014, 59: 103-111. DOI:10.1016/j.trac.2014.02.018 |
| [8] | Wang L, Bie P J, Zhang J B. Estimates of unintentional production and emission of hexachlorobutadiene from 1992 to 2016 in China[J]. Environmental Pollution, 2018, 238: 204-212. DOI:10.1016/j.envpol.2018.03.028 |
| [9] | UNEP. Evaluation of new information for the addition of hexachlorobutadiene to annex c of the stockholm convention[EB/OL]. http://chm.pops.int/TheConvention/POPsReviewCommittee/Meetings/POPRC11/POPRC11Foll%20owup/tabid/4723/Default.aspx, 2016-06-23. |
| [10] | EU. Study on waste related issues of newly listed POPs and candidate POPs[EB/OL]. https://ec.europa.eu/environment/waste/studies/pdf/POP_Waste_2010.pdf, 2020-08-23. |
| [11] |
解玉梅. 三氯乙烯国内外市场分析[J]. 化工技术经济, 2005, 23(4): 20-23. Xie Y M. Market analysis of trichloroethylene at home and abroad[J]. Chemical Techno-Economics, 2005, 23(4): 20-23. DOI:10.3969/j.issn.1673-9647.2005.04.006 |
| [12] |
刘鹏. 氯产品发展建议及主要产业链搭建[J]. 氯碱工业, 2013, 49(4): 1-7, 10. Liu P. Proposals to develop products consuming chlorine and construction of main industrial chains[J]. Chlor-Alkali Industry, 2013, 49(4): 1-7, 10. DOI:10.3969/j.issn.1008-133X.2013.04.001 |
| [13] |
董长江, 王强. 三氯乙烯生产工艺优化[J]. 氯碱工业, 2018, 54(8): 25-27. Dong C J, Wang Q. Optimization of trichloroethylene production process[J]. Chlor-Alkali Industry, 2018, 54(8): 25-27. DOI:10.3969/j.issn.1008-133X.2018.08.009 |
| [14] |
张艳梅, 商超平. 四氯乙烯的生产和应用[J]. 中国氯碱, 2006(6): 9-13. Zhang Y M, Shang C P. Production and application of tetrachloroethylene[J]. China Chlor-Alkali, 2006(6): 9-13. DOI:10.3969/j.issn.1009-1785.2006.06.004 |
| [15] | 曹凤显. 论四氯乙烯的生产[J]. 中国化工贸易, 2015(17): 297. DOI:10.3969/j.issn.1674-5167.2015.17.285 |
| [16] |
张凤君, 王斯佳, 马慧, 等. 三氯乙烯和四氯乙烯在土壤和地下水中的污染及修复技术[J]. 科技导报, 2012, 30(18): 65-72. Zhang F J, Wang S J, Ma H, et al. Contaminations and remediation technologies of trichloroethylene and perchloroethylene in the soil and groundwater: a review[J]. Science & Technology Review, 2012, 30(18): 65-72. DOI:10.3981/j.issn.1000-7857.2012.18.010 |
| [17] | Kong Q Q, Wang Y, Yang X. A review on hexachloro-1, 3-butadiene (HCBD): sources, occurrence, toxicity and transformation[J]. Bulletin of Environmental Contamination and Toxicology, 2020, 104(1): 1-7. DOI:10.1007/s00128-019-02744-5 |
| [18] |
韩余, 田琳, 唐阵武. 六氯丁二烯的来源、环境分布及其生态风险研究进展[J]. 环境污染与防治, 2019, 41(2): 216-223. Han Y, Tian L, Tang Z W. Research progress in distributions, sources and ecological risks of hexachlorobutadiene[J]. Environmental Pollution and Control, 2019, 41(2): 216-223. |
| [19] |
吴秀铭. 中国镁工业的现状与展望[J]. 有色金属加工, 2002, 31(2): 1-3. Wang X M. Current situation and prospect of China's magnesium industry[J]. Nonferrous Metals Processing, 2002, 31(2): 1-3. DOI:10.3969/j.issn.1671-6795.2002.02.001 |
| [20] | Baij L, Buijs J, Hermans J J, et al. Quantifying solvent action in oil paint using portable laser speckle imaging[J]. Scientific Reports, 2020, 10(1): 10574. DOI:10.1038/s41598-020-67115-1 |
| [21] |
李晶晶, 李大纲, 郭勇, 等. 新型木塑外墙挂板的耐水性研究[J]. 新型建筑材料, 2010, 37(8): 51-54. Li J J, Li D G, Guo Y, et al. Study on waterproof property of new wood-plastic composite siding[J]. New Building Materials, 2010, 37(8): 51-54. DOI:10.3969/j.issn.1001-702X.2010.08.015 |
| [22] | Sultan J N, McGarry F J. Effect of rubber particle size on deformation mechanisms in glassy epoxy[J]. Polymer Engineering and Science, 1973, 13(1): 29-34. DOI:10.1002/pen.760130105 |
| [23] | General. Report of the persistent organic pollutants review committee on the work of its ninth meeting[EB/OL]. http://chm.pops.int/TheConvention/POPsReviewCommittee/Reports/tabid/2301/Default.aspx, 2013-04-18. |
| [24] | Zhang H Y, Wang Y W, Sun C, et al. Levels and distributions of hexachlorobutadiene and three chlorobenzenes in biosolids from wastewater treatment plants and in soils within and surrounding a chemical plant in China[J]. Environmental Science & Technology, 2014, 48(3): 1525-1531. |
| [25] | Cai Q Y, Mo C H, Wu Q T, et al. Occurrence of organic contaminants in sewage sludges from eleven wastewater treatment plants, China[J]. Chemosphere, 2007, 68(9): 1751-1762. DOI:10.1016/j.chemosphere.2007.03.041 |
| [26] | Lee C L, Song H J, Fang M D. Pollution topography of chlorobenzenes and hexachlorobutadiene in sediments along the Kaohsiung coast, Taiwan—a comparison of two consecutive years' survey with statistical interpretation[J]. Chemosphere, 2005, 58(11): 1503-1516. DOI:10.1016/j.chemosphere.2004.11.095 |
| [27] | Chen X C, Luo Q, Wang D H, et al. Simultaneous assessments of occurrence, ecological, human health, and organoleptic hazards for 77 VOCs in typical drinking water sources from 5 major river basins, China[J]. Environmental Pollution, 2015, 206: 64-72. DOI:10.1016/j.envpol.2015.06.027 |
| [28] | Persistent Organic Pollutants Review Committee. The national implementation plan of Japan under the Stockholm convention on persistent organic pollutants[EB/OL]. https://www.env.go.jp/chemi/pops/plan/en_full.pdf, 2016-07-23. |
| [29] | Santolaria Z, Arruebo T, Pardo A, et al. Evaluation of airborne organic pollutants in a pyrenean glacial lake (the Sabocos Tarn)[J]. Water, Air, & Soil Pollution, 2015, 226(11). DOI:10.1007/s11270-015-2648-3 |
| [30] | Cho E, Khim J, Chung S, et al. Occurrence of micropollutants in four major rivers in Korea[J]. Science of the Total Environment, 2014, 491-492: 138-147. DOI:10.1016/j.scitotenv.2014.03.025 |
| [31] |
南淑清, 张霖琳, 张丹, 等. 郑州市环境空气中VOCs的污染特征及健康风险评价[J]. 生态环境学报, 2014, 23(9): 1438-1444. Nan S Q, Zhang L L, Zhang D, et al. Pollution condition and health risk assessment of VOCs in ambient air in Zhengzhou[J]. Ecology and Environmental Sciences, 2014, 23(9): 1438-1444. DOI:10.3969/j.issn.1674-5906.2014.09.005 |
| [32] | USEPA. 2013 National Monitoring Programs Annual Report (UATMP, NATTS, CSATAM)[EB/OL]. https://www3.epa.gov/ttn/amtic/files/ambient/airtox/2013nmpreport.pdf, 2015-10-08. |
| [33] | Ahmad M, Lee S S, Dou X M, et al. Effects of pyrolysis temperature on soybean stover- and peanut shell-derived biochar properties and TCE adsorption in water[J]. Bioresource Technology, 2012, 118: 536-544. DOI:10.1016/j.biortech.2012.05.042 |
| [34] | Schlicker O, Ebert M, Fruth M, et al. Degradation of TCE with iron: the role of competing chromate and nitrate reduction[J]. Groundwater, 2000, 38(3): 403-409. DOI:10.1111/j.1745-6584.2000.tb00226.x |
| [35] | Lash L H, Parker J C. Hepatic and renal toxicities associated with perchloroethylene[J]. Pharmacological Reviews, 2001, 53(2): 177-208. |
| [36] | Baķe M Ā, Eglīte M, Martinsone Ž, et al. Organic solvents as chemical risk factors of the work environment in different branches of industry and possible impact of solvents on workers' health[J]. Proceedings of the Latvian Academy of Sciences. Section B. Natural, Exact, and Applied Sciences, 2010, 64(1-2): 25-32. DOI:10.2478/v10046-010-0011-z |
| [37] | 中国氯碱工业协会. 氯碱杂志[EB/OL]. http://www.ccaia.org.cn/list.asp?classid=L0113, 2018-09-20. |
| [38] | 浙江巨化股份有限公司. 浙江巨化股份有限公司2018年年度报告[EB/OL]. http://www.sse.com.cn/disclosure/listedinfo/announcement/c/2019-04-19/600160_2018_n.pdf, 2019-01-23. |
| [39] | 芜湖融汇化工有限公司. 芜湖融汇化工有限公司2018年度报告[EB/OL]. https://aiqicha.baidu.com/company_annual_80612110188453, 2018-12-25. |
| [40] | 深圳市铭诚化工有限公司. 铭诚化工有限公司2018年年度报告[EB/OL]. https://nianbao.tianyancha.com/2324293459/ 2018, 2018-11-12. |
| [41] | 北京市统计局. 北京统计年鉴2018[M]. 北京: 中国统计出版社, 2018. |
| [42] | 天津市统计局. 天津统计年鉴2018[M]. 北京: 中国统计出版社, 2018. |
| [43] | 吴晓华. 河北经济年鉴2018[M]. 北京: 中国统计出版社, 2018. |
| [44] | 江苏省统计局. 江苏统计年鉴2018[M]. 北京: 中国统计出版社, 2018. |
| [45] | 安徽省统计局. 安徽统计年鉴2018[M]. 北京: 中国统计出版社, 2018. |
| [46] | 上海市统计局. 上海统计年鉴2018[M]. 北京: 中国统计出版社, 2018. |
| [47] | 浙江省统计局. 浙江统计年鉴2018[M]. 北京: 中国统计出版社, 2018. |
| [48] | 广东省统计局. 广东统计年鉴2018[M]. 北京: 中国统计出版社, 2018. |
| [49] | 中华人民共和国住房和城乡建设部, 中华人民共和国国家发展和改革委员会. 城镇污水处理厂污泥处理处置技术指南(试行)[EB/OL]. http://www.water8848.com/file/upload/201306/22/21-24-34-67-4.pdf, 2011-03-31. |
| [50] | UNEP. Report of the persistent organic pollutants review committee on the work of its ninth meeting: risk management evaluation on hexachlorobutadiene[EB/OL]. http://chm.pops.int/Default.aspx?tabid=2301, 2013-07-11. |
| [51] | 均华. 三氯乙烯市场发展前景广阔[J]. 浙江化工, 2005, 36(7): 7-8. |
| [52] |
王文生. 三氯乙烯生产技术改进研究[D]. 杭州: 浙江工业大学, 2012. 10-30. Wang W S. Production technology improvement of trichloroethylene abstract[D]. Hangzhou: Zhejiang University of Technology, 2012. 10-30. |
| [53] |
商超平, 张艳梅, 沈晔. 国内外四氯乙烯生产消费现状及市场前景[J]. 中国氯碱, 2006(3): 4-7. Shang C P, Zhang Y M, Shen Y. Production and consumption status of tetrachloroethylene at home and abroad and its prospective market[J]. China Chlor-Alkali, 2006(3): 4-7. DOI:10.3969/j.issn.1009-1785.2006.03.002 |
| [54] | Li J J, Wu Y D, Zhang Y L, et al. Emission of odorous volatile organic compounds from a municipal manure treatment plant and their removal using a biotrickling filter[J]. Environmental Technology, 2015, 36(8): 1050-1056. DOI:10.1080/09593330.2014.974679 |
| [55] |
陈芳, 徐建芬, 曹芸燕, 等. 钱塘江流域污水处理厂出水中挥发性有机物健康风险评估[J]. 科技通报, 2019, 35(9): 184-189. Chen F, Xu J F, Cao Y Y, et al. Health risk assessment of volatile organic pollutants in sewage treatment plant[J]. Bulletin of Science and Technology, 2019, 35(9): 184-189. |
| [56] |
王新明, 盛国英, 闵育顺, 等. 大坦沙污水处理厂进出水有机污染初步分析[J]. 广州环境科学, 1994, 9(2): 13-16. Wang X M, Sheng G Y, Min Y S, et al. Primary analysis for organic properties of influent and effluent in Da Tan Sha waste water treatment plant[J]. Guangzhou Environmental Science, 1994, 9(2): 13-16. |
| [57] | McLellan S L, Huse S M, Mueller-Spitz S R, et al. Diversity and population structure of sewage-derived microorganisms in wastewater treatment plant influent[J]. Environmental Microbiology, 2010, 12(2): 378-392. DOI:10.1111/j.1462-2920.2009.02075.x |
| [58] | Nie E Q, Zheng G D, Gao D, et al. Emission characteristics of VOCs and potential ozone formation from a full-scale sewage sludge composting plant[J]. Science of the Total Environment, 2019, 659: 664-672. DOI:10.1016/j.scitotenv.2018.12.404 |
| [59] | Robles-Molina J, Gilbert-López B, García-Reyes J F, et al. Determination of organic priority pollutants in sewage treatment plant effluents by gas chromatography high-resolution mass spectrometry[J]. Talanta, 2010, 82(4): 1318-1324. DOI:10.1016/j.talanta.2010.06.053 |
| [60] | Gong C H, Shen G, Huang H O, et al. Removal and transformation of polycyclic aromatic hydrocarbons during electrocoagulation treatment of an industrial wastewater[J]. Chemosphere, 2017, 168: 58-64. DOI:10.1016/j.chemosphere.2016.10.044 |
| [61] |
莫测辉, 蔡全英, 王伯光, 等. 我国城市污泥中醚类和卤代烃类有机污染物的初步研究[J]. 环境科学学报, 2002, 22(5): 671-676. Mo C H, Cai Q Y, Wang B G, et al. A preliminary study of ethers and halogenated hydrocarbons in selected municipal sludges of China[J]. Acta Scientiae Circumstantiae, 2002, 22(5): 671-676. DOI:10.3321/j.issn:0253-2468.2002.05.026 |
| [62] |
刘钊. 中国污泥处理处置现状及分析[J]. 天津科技, 2016, 43(4): 1-2. Liu Z. Sludge disposal in China: current status and development suggestions[J]. Tianjin Science & Technology, 2016, 43(4): 1-2. DOI:10.3969/j.issn.1006-8945.2016.04.001 |
| [63] |
李霁, 刘征涛, 李捍东, 等. 长江口水体中半挥发性有机污染物的分布特征[J]. 环境科学研究, 2007, 20(1): 12-17. Li J, Liu Z T, Li H D, et al. Distribution characteristics of semivolatile organic compounds in water from Yangtze Estuary[J]. Research of Environmental Sciences, 2007, 20(1): 12-17. DOI:10.3321/j.issn:1001-6929.2007.01.003 |
| [64] | Liu L H, Zhou H D. Investigation and assessment of volatile organic compounds in water sources in China[J]. Environmental Monitoring and Assessment, 2011, 173(1-4): 825-836. DOI:10.1007/s10661-010-1426-3 |
| [65] |
张映映, 冯流, 刘征涛. 长江口区域水体半挥发性有机污染物健康风险评价[J]. 环境科学研究, 2007, 20(1): 18-23. Zhang Y Y, Feng L, Liu Z T. Health risk assessment on semivolatile organic compounds in water of Yangtze Estuary Area[J]. Research of Environmental Sciences, 2007, 20(1): 18-23. DOI:10.3321/j.issn:1001-6929.2007.01.004 |
| [66] |
奚晔, 郑嵘, 詹铭. 顶空气相色谱法测定饮用水中11种氯苯类化合物及六氯丁二烯[J]. 上海预防医学, 2017, 29(1): 44-47, 53. Xi Y, Zheng R, Zhan M. Measuring eleven kinds of chlorobenzenes and hexachlorobutadiene in drinking water by HS-GC[J]. Shanghai Journal of Preventive Medicine, 2017, 29(1): 44-47, 53. |
| [67] |
张映映. 长江河口区部分有机污染物的特征分析[D]. 北京: 北京化工大学, 2008. 11-30. Zhang Y Y. Characteristic analysis of some organic pollutants in Yangtze Estuary[D]. Beijing: Beijing University of Chemical Technology, 2008. 11-30. |
| [68] |
赖永忠, 季彦鋆. 气相动态顶空进样-气相色谱-质谱法同时分析饮用水源水中57种挥发性有机物[J]. 岩矿测试, 2012, 31(5): 877-883. Lai Y Z, Ji Y J. Simultaneous determination of 57 kinds of volatile organic compounds in drinking water using a dynamic headspace sampling method coupled to gas chromatography-mass spectrometry[J]. Rock and Mineral Analysis, 2012, 31(5): 877-883. DOI:10.3969/j.issn.0254-5357.2012.05.022 |
| [69] | 蔡先达. 气相色谱-ECD法测定水中有机氯农药和氯苯类化合物[J]. 供水技术, 2016, 10(2): 58-61. DOI:10.3969/j.issn.1673-9353.2016.02.014 |
| [70] |
李小娟, 吉文亮, 马永健, 等. 江苏地区饮用水水源地水中挥发性有机污染物的调查[J]. 环境与健康杂志, 2007, 24(11): 877-880. Li X J, Ji W L, Ma Y J, et al. Investigation of water sources contaminated by volatile organic compounds in Jiangsu Province[J]. Journal of Environment and Health, 2007, 24(11): 877-880. DOI:10.3969/j.issn.1001-5914.2007.11.011 |
| [71] | European Commission. Directive 2008/105/EC of the European parliament and of the council of 16 December 2008 on environmental quality standards in the field of water policy, amending and subsequently repealing council directives 82/176/EEC, 83/513/EEC, 84/156/EEC, 84/491/EEC, 86/280/EEC and amending directive 2000/60/EC of the European Parliament and of the council[EB/OL]. https://documents-dds-ny.un.org/doc/UNDOC/GEN/K13/525/38/PDF/K1352538.pdf?OpenElement, 2013-10-18. |
| [72] |
丁文波. 吹扫捕集-气相色谱-质谱法测定饮用水中52种挥发性有机物[J]. 中国卫生检验杂志, 2018, 28(18): 2185-2188, 2192. Ding W B. Determination of 52 volatile organic compounds in drinking water by purge and trap-gas chromatography-mass spectrometry[J]. Chinese Journal of Health Laboratory Technology, 2018, 28(18): 2185-2188, 2192. |
| [73] |
王荟, 章勇, 李娟. 水质中多种挥发性有机物的同时测定[J]. 干旱环境监测, 2009, 23(3): 141-144. Wang H, Zhang Y, Li J. Simultaneous determination on volatile organic compounds in water[J]. Arid Environmental Monitoring, 2009, 23(3): 141-144. DOI:10.3969/j.issn.1007-1504.2009.03.004 |
| [74] | 陈剑宁. 水中挥发性卤代烃的吹扫捕集气相色谱检测方法[J]. 城镇供水, 2012(4): 68-70. |
| [75] |
沈桢, 张建荣, 郑家传. 基于不同用地规划的人体健康风险评估[J]. 环境监测管理与技术, 2016, 28(3): 33-36. Shen Z, Zhang J R, Zheng J C. Health risk assessment based on different land use planning[J]. The Administration and Technique of Environmental Monitoring, 2016, 28(3): 33-36. DOI:10.3969/j.issn.1006-2009.2016.03.008 |
| [76] | Maire J, Coyer A, Fatin-Rouge N. Surfactant foam technology for in situ removal of heavy chlorinated compounds-DNAPLs[J]. Journal of Hazardous Materials, 2015, 299: 630-638. DOI:10.1016/j.jhazmat.2015.07.071 |
| [77] | Lysychenko G, Weber R, Kovach V, et al. Threats to water resources from hexachlorobenzene waste at Kalush City (Ukraine)—a review of the risks and the remediation options[J]. Environmental Science and Pollution Research, 2015, 22(19): 14391-14404. DOI:10.1007/s11356-015-5184-1 |
| [78] | GB 5749-2006, 生活饮用水卫生标准[S]. |
| [79] |
陈锡超, 罗茜, 宋翰文, 等. 北京官厅水库特征污染物筛查及其健康风险评价[J]. 生态毒理学报, 2013, 8(6): 981-992. Chen X C, Luo Q, Song H W, et al. Screening of priority contaminants and health risk assessment in Beijing Guanting Reservoir[J]. Asian Journal of Ecotoxicology, 2013, 8(6): 981-992. |
| [80] | Li H Y, Wang Y S, Liu F, et al. Volatile organic compounds in stormwater from a community of Beijing, China[J]. Environmental Pollution, 2018, 239: 554-561. DOI:10.1016/j.envpol.2018.04.065 |
| [81] | Weinberg H S. Modern approaches to the analysis of disinfection by-products in drinking water[J]. Philosophical Transactions of the Royal Society A: Mathematical, Physical and Engineering Sciences, 2009, 367(1904): 4097-4118. DOI:10.1098/rsta.2009.0130 |
| [82] |
段江平, 孙仕萍. 饮用水中八种氯苯类化合物及六氯丁二烯的顶空毛细管柱气相色谱测定法[J]. 中国卫生检验杂志, 2013, 23(7): 1680-1682. Duan J P, Sun S P. Determination of chlorobenzenes and hexachlorobutadiene in drinking water with headspace gas chromatography[J]. Chinese Journal of Health Laboratory Technology, 2013, 23(7): 1680-1682. |
| [83] |
薛勇, 陈红果, 杨晓松, 等. 吹扫捕集-气相色谱法测定饮用水中6种氯苯类化合物及六氯丁二烯[J]. 中国卫生检验杂志, 2017, 27(8): 1088-1090. Xue Y, Chen H G, Yang X S, et al. Determination of 6 chlorinated benzene compounds and hexachlorobutadiene in drinking water by purge and trap gas chromatography[J]. Chinese Journal of Health Laboratory Technology, 2017, 27(8): 1088-1090. |
| [84] |
费勇, 姚恩亲, 张海燕, 等. 吹扫捕集-气相色谱/质谱联用同时测定饮用水源地水中痕量挥发性有机物[J]. 岩矿测试, 2010, 29(2): 127-130. Fei Y, Yao E Q, Zhang H Y, et al. Simultaneous determination of trace volatile organic compounds in water samples from drinking water sources by purge-and-trap gas chromatography-mass spectrometry[J]. Rock and Mineral Analysis, 2010, 29(2): 127-130. |
| [85] | Hou X W, Zhang H Y, Li Y L, et al. Bioaccumulation of hexachlorobutadiene in pumpkin seedlings after waterborne exposure[J]. Environmental Science: Processes & Impacts, 2017, 19(10): 1327-1335. |
| [86] | Fuchsman P C, Barber T R. Comment on an ecological risk assessment for hexachlorobutadiene by Taylor et al[J]. Human and Ecological Risk Assessment: An International Journal, 2005, 11(5): 1077-1078. |
| [87] | Sun J T, Pan L L, Zhan Y, et al. Spatial distributions of hexachlorobutadiene in agricultural soils from the Yangtze River Delta region of China[J]. Environmental Science and Pollution Research, 2018, 25(4): 3378-3385. |
| [88] | Liu Y Y, Nie Z Q, Die Q Q, et al. Organochlorine pesticides in soil, air, and vegetation at and around a contaminated site in southwestern China: concentration, transmission, and risk evaluation[J]. Chemosphere, 2017, 178: 340-349. |
| [89] |
张莉, 张辰凌, 张永涛, 等. 加速溶剂萃取-在线净化-气相色谱-质谱法测定土壤中多氯烃类化合物[J]. 理化检验-化学分册, 2015, 51(1): 54-56. Zhang L, Zhang C L, Zhang Y T, et al. GC-MS determination of polychlorinated hydrocarbons in soil by accelerated solvent extraction-on line purification[J]. Physical Testing and Chemical Analysis Part B: Chemical Analysis, 2015, 51(1): 54-56. |
| [90] | Tang Z W, Huang Q F, Cheng J L, et al. Distribution and accumulation of hexachlorobutadiene in soils and terrestrial organisms from an agricultural area, East China[J]. Ecotoxicology and Environmental Safety, 2014, 108: 329-334. |
| [91] | Gao F W, Jia J Y, Wang X M. Occurrence and ordination of dichlorodiphenyltrichloroethane and hexachlorocyclohexane in agricultural soils from Guangzhou, China[J]. Archives of Environmental Contamination and Toxicology, 2008, 54(2): 155-166. |
| [92] |
蘧丹, 姜世中, 唐阵武, 等. 废弃生产场地有机氯农药的残留与迁移特征[J]. 岩矿测试, 2013, 32(4): 649-658. Qu D, Jiang S Z, Tang Z W, et al. Distribution and diffusion of organochlorine pesticides in soils from an abandoned manufacturing site[J]. Rock and Mineral Analysis, 2013, 32(4): 649-658. |
| [93] | Saskatchewan Ministry of Environment. Saskatchewan environmental quality standards[EB/OL]. https://wenku.baidu.com/view/90b380bcc77da26925c5b07d.html. |
| [94] | Tang Z W, Huang Q F, Nie Z Q, et al. Levels and distribution of organochlorine pesticides and hexachlorobutadiene in soils and terrestrial organisms from a former pesticide-producing area in Southwest China[J]. Stochastic Environmental Research and Risk Assessment, 2016, 30(4): 1249-1262. |
| [95] | 刘文聪, 沈艳婷, 张海燕. 典型垃圾焚烧厂周边土壤中六氯丁二烯的赋存特征[A]. 见: 第十次全国分析毒理学大会暨第六届分析毒理专业委员会会议论文集[C]. 宜昌: 中国毒理学会, 2018. |
| [96] | Matejczyk M, Płaza G A, Nałęcz-Jawecki G, et al. Estimation of the environmental risk posed by landfills using chemical, microbiological and ecotoxicological testing of leachates[J]. Chemosphere, 2011, 82(7): 1017-1023. |