 2020, Vol. 41

2. 上海市环境科学研究院, 国家环境保护城市大气复合污染成因与防治重点实验室, 上海 200233;
3. 上海祥得环保科技有限公司, 上海 200235
 , CHEN Jun1
 , ZHANG Jia-luo1 , GAN Gui-cheng1 , LIU Yu-cun1,2,3 , SU Ming-xu1 , LOU Sheng-rong2 , ZHOU Min2 , TAO Shi-kang2 , QIAO Li-ping2
2. State Environmental Protection Key Laboratory of Formation and Prevention of Urban Air Pollution Complex, Shanghai Academy of Environmental Sciences, Shanghai 200233, China;
3. Shanghai Thunder Environmental Technology Co., Ltd., Shanghai 200235, China
气溶胶光学性质在很大程度上取决于气溶胶的粒径分布、化学成分、混合状态和湿度[1~3].目前, 气溶胶光学性质研究上主要有:①基于颗粒物数浓度粒径谱观测采用MIE理论模型计算全散射(消光)系数[4]; ②基于气溶胶的化学组分特征, 采用IMPROVE(interagency monitoring of protected visual environment)方法重建消光系数[5].将采用光学仪器(光腔[6~8]、开放光程[9]和积分浊度计[10])进行实际测量的气溶胶光学性质参数与颗粒物粒径谱(MIE模型)和化学组分谱(IMPROVE方法)计算得到的理论值进行比对分析, 成为目前较为通用的气溶胶光学闭合实验研究方法[11, 12].
基于MIE理论模型的气溶胶数浓度粒径分布谱计算消光系数, 其中气溶胶粒径观测尤为重要.上世纪末, 国外学者就开始了对不同环境下气溶胶粒径数谱进行观测, 包括城市[13]、森林[14]、乡村[15]、极地[16]和沿海[17, 18]等典型区域, 在观测过程中新粒子这一概念被提出, 即核膜态气溶胶(3~20 nm)的数目浓度急剧增加并持续增长, 在粒径谱图中呈香蕉状特征[19].新粒子经由大气物理和化学过程进一步长大至艾根模态, 可影响空气质量、人群健康、直接或间接影响天气和气候[20].我国的气溶胶数浓度粒径谱观测多集中于华北(主要为北京)[21, 22]、西北[23]和珠江三角洲[24~26], 在长江三角洲地区, 气溶胶粒径观测集中于南京[19, 27]和上海[28]等地, 主要侧重研究新粒子生成机制、成核速率和成核方式等.刘新民等[29]利用MIE理论模型重建北京市大气气溶胶散射系数, 与实际测量值吻合较好; 谢银海[30]利用MIE激光雷达反演分析了2012年沙尘天和2013年的雾-霾天的消光系数, 与CALIPSO卫星反演结果吻合; 刘斌等[31]于2019年对北京地区气溶胶利用总量双峰体积谱和化学组分体积谱结合MIE理论方法进行重建消光系数, 得到的闭合相关系数为0.9686和0.9734.因此普遍认为MIE理论消光可以代表实测消光.
美国IMPROVE检测网络利用气溶胶化学组分质量浓度及其消光效率重构消光系数, 最早于1994年被提出[32], Pitchford等[33]于2007年对原有IMPROVE方法进行修订.目前国内现有研究表明, 上海(0.83)[34]、北京(0.79)[35]、广州(0.99; 0.97)[5]、南京(0.89)[36]、厦门(0.91)[3]、黄山(0.84)[37]和杭州(0.81)[38]等地区利用IMPROVE方法对气溶胶化学组分重建消光系数, 与实测值也有较好的相关闭合性, 硝酸盐、硫酸盐和有机物是消光的主要贡献来源, 且随位置和季节变化.而长江三角洲的观测主要集中在南京和上海等人口较为密集的城区, 关于新粒子生成期间郊区化学组分变化引起的消光参数变化报道尚不多见.常州位于长江三角洲中心地带, 气溶胶研究主要基于碳质气溶胶、颗粒物来源解析和PM2.5组分解析, 对于气溶胶光学性质的研究偏少.
本研究在常州郊区进行为期一个月的综合观测, 以光学消光性质闭合研究为基点, 采用颗粒物MIE散射模型和IMPROVE方法对观测期间新粒子生成过程中光学性质以及PM2.5化学组分特征进行分析, 探讨长三角背景地区新粒子生成期间气溶胶消光性质的粒径谱和组分谱两种闭合方法研究.
1 材料与方法 1.1 观测地点与时间本次观测站点位于江苏省常州市滆湖地区(31°48′N, 119°58′E).如图 1所示, 时间为2019年梅雨季前的5月27日~6月27日.常州市地处长三角中心地带, 属于亚热带季风气候.滆湖位于常州市西南方向, 周边60%是生态湿地、绿化园林, 20%是水域.周边无明显污染源排放及高层建筑群, 能够较好地代表长三角梅雨季前的区域大气状况.

|
五角星位置为采样点 图 1 观测点位位置示意 Fig. 1 Location of monitoring site |
采样地点位于疗养院南侧4楼房间.楼高约12 m, 采样管高约15 m, 所有采样管均连接2.5 μm切割头.
1.2 观测仪器与参数 1.2.1 颗粒物数浓度粒径谱分布颗粒物数浓度监测主要用两台扫描电迁移率粒径谱仪(厂商:美国TSI, 型号分别为SMPS3080和SMPS3082), 两台仪器分别使用NANO DMA(3085)和LONG DMA(3081);粒子计数器均为醇类CPC(型号分别为3776和3750).气溶胶样品先通过放射性中和器, 然后进入DMA.DMA通过改变电压来筛选不同粒径的颗粒物, 被选出的颗粒物进入CPC吸湿长大后被计数.
NANO DMA筛选的粒径范围为2.02~63.8 nm, 样气流量为1.5L·min-1, 鞘气流量为15L·min-1; LONG DMA筛选的粒径范围为14.1~736.5 nm, 样气流量为0.3L·min-1, 鞘气流量为3L·min-1, 两台仪器使用一根三通分离的进样管, 两台仪器有部分颗粒物粒径段重合(14.1~63.8 nm), 2019年6月3~16日期间由于断电原因造成部分数据缺失.图 2所示为LONG DMA经过Particle Loss Calculator校正后与NANO DMA各个粒径下的平均数浓度的正态分布曲线, 两者结合可以代表大气颗粒物的分布状况.

|
图 2 颗粒物数浓度粒径分布谱图 Fig. 2 Particle number concentration and particle size distribution spectrum |
气溶胶水溶性离子组分用在线离子色谱仪(MARGA ADI 2080)分析, 时间分辨率为1 h. MARGA采用水相分离的方法, 样气以1 m3·h-1的速度进入采样箱, 在采样箱内通过旋转式液膜气蚀器对可溶气体经过双氧水定量吸收, 随后被蒸汽气溶胶喷射器捕获, 脱气后的样品与溴化锂混合, 再由两套离子色谱分析系统同时对阴离子和阳离子进行检测[39].
有机碳/元素碳(OC/EC)使用美国Sunset Lab研制和生产的1 h分辨率的RT-4型有机碳/元素碳(OC/EC)分析仪分析定量.样气进入分析仪沉积在石英膜上并在氦气(He)的非氧化环境中逐级升温, 致使OC被加热挥发(该过程中也有部分OC被碳化); 此后样品又在氦气/氧气混合气(He/O2)环境中逐级升温, 该过程中EC被氧化分解为气态氧化物.这两个步骤中所产生的分解产物都随着通过分析室的载气(同时也是环境气及反应气, 亦即He或He/O2)经过二氧化锰(MnO2)氧化炉被转化为CO2后由离子火焰法(FID)或是由非红外色散法(NDIR)定量检验[40].
MARGA和OC/EC分析仪由于仪器故障, 2019年6月14日之后停测, 数据缺失.
1.2.3 光学性质参数光学性质参数用腔衰减相移式单次反照率监测仪(cavity attenuated phase shift-albedo monitor, CAPS-ALB)和七波段(370、470、520、660、880、950 nm)黑碳仪(aethelometer, AE-33)测得.
CAPS-ALB由美国Aerodyne公司生产, 可监测颗粒物的消光系数bext, 进样流量为0.85L·min-1.主要是通过检测由光源调频引起的散射积分信号来测量消光系数, 利用真空光电二极管检测光源方形波调频外差检波相移量测量总消光系数[41].
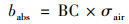
AE-33由美国Magee Scientific公司生产, 可根据光透过沉积黑碳的纸带时的衰减量得到黑碳浓度信息, 进样流量为5L·min-1.通过式(1)可进一步得到气溶胶吸收系数:
|
(1) |
式中, BC为黑碳浓度(μg·m-3), babs为气溶胶吸收系数(Mm-1), 根据AE-33手册(2018年10月版)提供的黑碳仪第三通道(520 nm)气溶胶吸收截面σair=13.14 m2·g-1, 此外2019年6月16~17日由于更换纸带造成部分数据缺失.
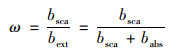
由于两台仪器的测量参数不同, 可以得到观测期间气溶胶的散射系数bsca(bsca=bext-babs).在气溶胶光学性质的表征中, 单次散射反照率(single scattering albedo, SSA)ω在辐射传输中起着非常重要的作用, 它是指气溶胶散射系数与消光系数的比值[式(2)]:
|
(2) |
式中, babs、bsca和bext分别为气溶胶吸收、散射和消光系数, 单位均为Mm-1.
2 结果与讨论 2.1 颗粒物数浓度粒径谱测量采用两台扫描电迁移率粒径谱仪(SMPS)测量颗粒物数浓度粒径谱.一台测量颗粒物粒径范围为2.02~63.8 nm, 另一台测量颗粒物粒径范围为14.1~736.5 nm.图 3(a)为整个观测期间2019年5月27日~6月27日的颗粒物数浓度粒径谱. 5月28日和29日可以看到明显新粒子生成过程, 颗粒物粒径随时间显著增长, 粒子粒径从4 nm开始持续增长到64 nm, 在这段时间内颗粒物数浓度急剧增长, 最大可达到54 400个·cm-3, 其余时间段颗粒物数浓度相比于5月28和29日较低, 最大为20 000个·cm-3.

|
(a)观测期间整体数目粒径谱; (b)新粒子生成期间数目粒径谱; (c)新粒子生成期间颗粒物三模态数目浓度变化时序图(灰色线框代表新粒子生成时段) 图 3 颗粒物数目粒径谱及3个模态数浓度 Fig. 3 Particle size spectrum and 3 modal concentration |
5月28日和29日的颗粒物数谱浓度图如3(b)所示, 可以看到从07:00开始新粒子开始生成, 18:00该现象停止, 07:00~18:00时之间颗粒物粒径和数目浓度急剧增长, 新粒子粒径达到64 nm停止增长, 19:00~06:00时之间颗粒物数浓度减小.将两日的颗粒物浓度按3个模态理论划分:核模态(Dp < 30 nm)、艾根模态(30 nm < Dp < 100 nm)和积聚模态(100 nm < Dp < 800 nm)如图 3(c)中所示, 在新粒子生成期间(灰色方框标注)核模态变化最明显, 出现多个显著峰值; 在新粒子生成观测期间艾根模态较核膜态变化不明显; 积聚模态粒径范围较大, 且新粒子生成过程中数目偏少, 无明显变化.新粒子生成期间颗粒物浓度的模态变化与其他观测结果较为一致[23].
2.2 PM2.5化学组分测量在整个观测期间, 去除相对湿度大于90%的小时数据样本[41], PM2.5的日均质量浓度为48.19 μg·m-3, 浓度范围为26.84~48.19 μg·m-3; 碳组分OC和EC的日均浓度分别为9.09 μg·m-3和3.47 μg·m-3, 分别占比18.86%和7.20%;水溶性离子NO3-、SO42-和NH4+日均浓度分别为8.82、5.72和4.54 μg·m-3, 分别占18.29%、11.88%和9.42%;其他水溶性离子(K+、Ca2+、Mg2+、Na+和Cl-)总量占比5.20%.图 4(a)和4(b)分别为PM2.5组分日均浓度及占比情况, 灰色线框部分为新粒子生成时段.

|
(a)观测期间PM2.5各组分浓度; (b)观测期间各组分平均浓度占比; (c)新粒子生成期间组分浓度变化时序图; (a)和(b)中灰色线框为新粒子生成时段 图 4 观测及新粒子生成期间PM2.5各组分浓度变化趋势 Fig. 4 Changes in the concentration of PM2.5 during the observation period and the period of new particle generation |
5月28日和29日的各组分浓度时序图如图 4(c)所示, 5月28日3种主要水溶性离子浓度无明显变化, 5月29日在新粒子生成前期及初期, 硫酸盐浓度增加明显, 这一结果与霍俊涛等[42]和胡敏等[43]的研究结果一致.
2.3 气溶胶光学性质测量 2.3.1 实测参数图 5(a)和5(b)为整个观测期间仪器实时在线测量得到的光学系数(消光、吸收和散射系数)和单次散射反照率(SSA)的变化趋势, 由于AE33数据缺失, 删除对应的光学性质参数, 造成图 5(a)和5(b)中部分数据缺失.消光、吸收和散射系数的平均值为195.38、39.87和155.51 Mm-1; SSA的平均值为0.77, 说明常州地区在观测期间气溶胶散射作用大于吸收作用.

|
图 5 光学性质参数和单次散射反照比变化趋势 Fig. 5 Optical properties and single-scattering albedo trends |
5月28日和29日气溶胶光学性质参数如图 5(c)所示, 单次散射反照率如图 5(d)所示. 5月28日消光、吸收和散射系数的平均值分别为62.37、27.47和34.90 Mm-1, SSA的平均值为0.57; 5月29日消光、吸收和散射系数的平均值分别为128.43、52.46和75.98 Mm-1, SSA的平均值为0.60, 与5月28日相比, 光学性质参数整体偏高.两日的光学性质参数从新粒子开始生成时间07:00开始降低, 一直持续到18:00都处于峰谷, 18:00之后光学性质参数又开始达到一个高峰, SSA是在07:00时开始升高, 07:00~18:00处于一个峰值状态, 18:00之后开始降低, 与光学性质参数的变化趋势相反, 5月29日碳质气溶胶的平均含量相对于5月28日降低.
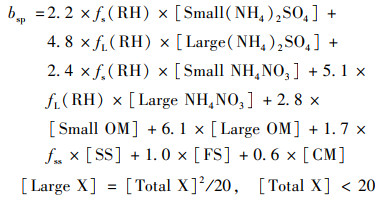
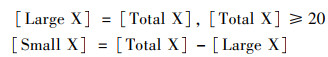
2.3.2 组分散射系数重建应用IMPROVE方程研究气溶胶化学组分对光全散射(消光)的贡献, 选定波长为532 nm.简化后的IMPROVE方程[5]一般可表述为:
|
|
(3) |
式中, []表示气溶胶各化学组分质量浓度(μg·m-3), 消光系数bsp的单位为Mm-1.[(NH4)2SO4]=1.37[SO42-]; [NH4NO3]=1.29[NO3-]; [OM]=1.4[OC]; [FS]=2.2[Al]+2.49[Si]+1.62[Ca]+2.42[Fe]+1.94[Ti]; [CM]=[PM10-PM2.5]; 由于缺乏土壤元素的测量, 假定Ca2+占细土壤质量浓度的5%, 即[FS]=20[Ca2+]; 吸湿性增长曲线参考Jung等[44]的研究.
图 6(a)为整个观测期间的实测消光系数与组分重建消光系数的线性拟合, 相关系数R2=0.83, 相较于南京(0.89)偏低, 高于杭州(0.81), 与上海(0.83)数值一致, 说明相关性吻合较好.图 6(b)为新粒子生成期间实测消光系数与重建消光系数的时序对比图, 实测平均消光系数为95.40 Mm-1, 重建平均消光系数为140.20 Mm-1, 重建消光系数较实测值高44.80 Mm-1.

|
图 6 实测与IMPROVE方程估算消光系数线性拟合和时序 Fig. 6 Measured and IMPROVE-calculated linear fitting and timing diagram of the extinction coefficient |
MIE散射理论计算气溶胶全散射(消光)系数根据迭代算法确定颗粒物复折射率, 即颗粒物相对于周围空气环境的复折射率, 用m=n-k×i表示, 折射率实部n主要与光散射有关, 折射率虚部k主要与光吸收有关[45].由于新粒子生成时颗粒物的混合状态会发生改变, 因此假设新粒子生成期间颗粒物的平均复折射率为m1=1.233-0.002×i, 其余时间段颗粒物平均复折射率为m2=1.24-0.002×i, 结合颗粒物数谱得到整个观测期间消光系数的最大值为395.44 Mm-1, 最小值为21.12 Mm-1, 平均值为126.52 Mm-1.
图 7分别为实际测量与MIE理论计算的消光系数线性回归分析和新粒子生成期间消光系数时序图.在整个观测期间, 实测与理论值相关系数R2=0.83, 与IMPROVE重建相关系数相等.在新粒子生成期间理论消光系数平均值93.54 Mm-1, 且新粒子生成期间MIE理论重建时序值与实测值有一致的变化趋势, 平均理论消光系数要比实测值低1.86 Mm-1.

|
图 7 实测与MIE理论计算消光系数线性拟合和时序 Fig. 7 Measured and MIE-calculated linear fitting and timing diagram of the extinction coefficient |
(1) 颗粒物数谱浓度表明:新粒子集中在日间生成, 最大粒径可达到64 nm, 主要影响艾根模态以及核膜态.
(2) 整个观测期间颗粒物化学组分有机碳占比最高, 其次是硝酸盐; 根据时序变化图推测在新粒子生成初期硫酸盐贡献较大, 其次是硝酸盐和铵盐.
(3) 对颗粒物单次散射反照比(SSA)进行分析发现新粒子生成影响颗粒物散射系数较明显.
(4) 新粒子生成期间IMPROVE重建消光系数较实测均值高44.80 Mm-1, 相关系数为0.83, 该方程在不同地区的适用性有待进一步研究.
(5) 新粒子生成期间用MIE理论结合颗粒物数目粒径谱计算消光系数较实测均值低1.86 Mm-1, 相关系数为0.83, 但是趋势一致, 推测由于联用仪器的进口流量差异, 造成不同粒径的颗粒物损失.
| [1] |
徐彬, 张泽锋, 李艳伟, 等. 南京北郊春季气溶胶吸湿性分析[J]. 环境科学, 2015, 36(6): 1911-1918. Xu B, Zhang Z F, Li Y W, et al. Hygroscopic properties of aerosol particles in north suburb of Nanjing in Spring[J]. Environmental Science, 2015, 36(6): 1911-1918. |
| [2] |
陈卉, 杨素英, 李艳伟, 等. 黄山夏季气溶胶吸湿性及与化学组分闭合[J]. 环境科学, 2016, 37(6): 2008-2016. Chen H, Yang S Y, Li Y W, et al. Hygroscopic properties and closure of aerosol chemical composition in Mt. Huang in Summer[J]. Environmental Science, 2016, 37(6): 2008-2016. |
| [3] | Deng J J, Zhang Y R, Hong Y W, et al. Optical properties of PM2.5 and the impacts of chemical compositions in the coastal city Xiamen in China[J]. Science of the Total Environment, 2016, 557-558: 665-675. |
| [4] | Du H. Mie-scattering calculation[J]. Applied Optics, 2004, 43(9): 1951-1956. |
| [5] | Xia Y J, Tao J, Zhang L M, et al. Impact of size distributions of major chemical components in fine particles on light extinction in urban Guangzhou[J]. Science of the Total Environment, 2017, 587-588: 240-247. |
| [6] | Massoli P, Kebabian P L, Onasch T B, et al. Aerosol light extinction measurements by cavity attenuated phase shift (CAPS) spectroscopy:laboratory validation and field deployment of a compact aerosol particle extinction monitor[J]. Aerosol Science and Technology, 2010, 44(6): 428-435. |
| [7] | Varma R, Ball S M, Brauers T, et al. Light extinction by secondary organic aerosol:an intercomparison of three broadband cavity spectrometers[J]. Atmospheric Measurement Techniques Discussions, 2013, 6(4): 6685-6727. |
| [8] | Prakash N, Ramachandran A, Varma R, et al. Near-infrared incoherent broadband cavity enhanced absorption spectroscopy (NIR-IBBCEAS) for detection and quantification of natural gas components[J]. Analyst, 2018, 143(14): 3284-3291. |
| [9] |
郝楠, 周斌, 陈立民. 利用差分吸收光谱法测量亚硝酸和反演气溶胶参数[J]. 物理学报, 2006, 55(3): 1529-1533. Hao N, Zhou B, Chen L M. Measurement of nitrous acid and retrieval of aerosol parameters with differential optical absorption spectroscopy[J]. Acta Physica Sinica, 2006, 55(3): 1529-1533. |
| [10] | Uchiyama A, Chen B, Yamazaki A, et al. Aerosol optical characteristics in Fukuoka and Beijing measured by integrating nephelometer and aethalometer:comparison of source and downstream regions[J]. Journal of the Meteorological Society of Japan. Ser. Ⅱ, 2018, 96(2): 215-240. |
| [11] | Swietlicki E, Zhou J C, Berg O H, et al. A closure study of sub-micrometer aerosol particle hygroscopic behaviour[J]. Atmospheric Research, 1999, 50(3-4): 205-240. |
| [12] | Garvey D M, Pinnick R G. Response characteristics of the particle measuring systems active scattering aerosol spectrometer probe (ASASP-X)[J]. Aerosol Science and Technology, 1983, 2(4): 477-488. |
| [13] | Czader B H, Choi Y, Li X, et al. Impact of updated traffic emissions on HONO mixing ratios simulated for urban site in Houston, Texas[J]. Atmospheric Chemistry and Physics, 2015, 15(3): 1253-1263. |
| [14] | Boy M, Kazil J, Lovejoy E R, et al. Relevance of ion-induced nucleation of sulfuric acid and water in the lower troposphere over the boreal forest at northern latitudes[J]. Atmospheric Research, 2008, 90(2-4): 151-158. |
| [15] | Dal Maso M, Kulmala M, Riipinen I, et al. Formation and growth of fresh atmospheric aerosols:eight years of aerosol size distribution data from SMEAR Ⅱ, Hyytiälä, Finland[J]. Boreal Environment Research, 2005, 10(5): 323-336. |
| [16] | Chameides W L, Luo C, Saylor R, et al. Correlation between model-calculated anthropogenic aerosols and satellite-derived cloud optical depths:indication of indirect effect?[J]. Journal of Geophysical Research, 2002, 107(D10): 4085. |
| [17] | Bzdek B R, Zordan C A, Luther Ⅲ G W, et al. Nanoparticle chemical composition during new particle formation[J]. Aerosol Science and Technology, 2011, 45(8): 1041-1048. |
| [18] | Damian V, Sandu A, Damian M, et al. The kinetic preprocessor KPP-a software environment for solving chemical kinetics[J]. Computers & Chemical Engineering, 2002, 26(11): 1567-1579. |
| [19] |
施华.长三角西部地区气溶胶新粒子形成观测研究[D].南京: 南京大学, 2018. 8-12. Shi H. Aerosol new particle formation at western Yangtze River Delta[D]. Nanjing: Nanjing University, 2018. 8-12. |
| [20] |
王志彬, 胡敏, 吴志军, 等. 大气新粒子生成机制的研究[J]. 化学学报, 2013, 71(4): 519-527. Wang Z B, Hu M, Wu Z J, et al. Research on the formation mechanisms of new particles in the atmosphere[J]. Acta Chimica Sinica, 2013, 71(4): 519-527. |
| [21] |
吴志军, 胡敏, 岳玎利, 等. 重污染和新粒子生成过程中城市大气颗粒物数谱分布演变过程[J]. 中国科学:地球科学, 2011, 54(8): 1192-1199. Wu Z J, Hu M, Yue D L, et al. Evolution of particle number size distribution in an urban atmosphere during episodes of heavy pollution and new particle formation[J]. Science China Earth Sciences, 2011, 54(11): 1772-1778. |
| [22] |
张周祥.秋冬季北京北部重污染事件PM1化学组分特征及气象因素的贡献[D].北京: 中国气象科学研究院, 2017. Zhang Z X. Characteristics of PM1 chemical composition and role of meteorological factors during heavy aerosol pollution episodes in northern Beijing area in autumn and winter[D]. Beijing: Chinese Academy of Meteorological Science, 2017. |
| [23] |
曹聪.华山PM2.5理化特征垂直分布及新粒子形成[D].北京: 中国科学院大学, 2018. Cao C. Vertical distribution of physical and chemical characteristics of PM2.5 at Mt. Hua and the new particle formation[D]. Beijing: University of Chinese Academy of Sciences, 2018. |
| [24] | 岳玎利, 钟流举, 沈劲, 等.珠三角地区颗粒物数谱分布与新粒子生成特征[A].见: 2016中国环境科学学会学术年会论文集(第三卷)[C].海口: 中国环境科学学会, 2016. 2719-2725. |
| [25] |
岳玎利, 钟流举, 沈劲, 等. 珠三角地区大气新粒子增长-缩小过程特征[J]. 环境污染与防治, 2016, 38(3): 1-7. Yue D L, Zhong L J, Shen J, et al. Properties of new particle growth-shrinkage events in the Pearl River Delta region[J]. Environmental Pollution & Control, 2016, 38(3): 1-7. |
| [26] | 李菲, 谭浩波, 邹宇, 等.广州旱季新粒子生成事件分析[A].见: 第31届中国气象学会年会S6大气成分与天气、气候变化[C].北京: 大气成分委员会, 中国气象科学研究院, 2014. |
| [27] |
齐西萌.长三角地区气溶胶粒径谱与新粒子生成: 观测与模拟研究[D].南京: 南京大学, 2017. Qi X M. Aerosol size distribution and new particle formation in Yangtze River Delta of East China: measurements and simulations[D]. Nanjing: Nanjing University, 2017. |
| [28] |
佘倩楠, 徐茜, 周陶冶, 等. 长三角地区2015年大气重污染特征及其影响因素[J]. 环境科学学报, 2018, 38(8): 3185-3196. She Q N, Xu Q, Zhou T Y, et al. Characteristics of heavy air pollution episode and its impacting factors in the Yangtze River Delta during 2015[J]. Acta Scientiae Circumstantiae, 2018, 38(8): 3185-3196. |
| [29] |
刘新民, 邵敏. 北京市夏季大气消光系数的来源分析[J]. 环境科学学报, 2004, 24(2): 185-189. Liu X M, Shao M. The analysis of sources of ambient light extinction coefficient in summer time of Beijing City[J]. Acta Scientiae Circumstantiae, 2004, 24(2): 185-189. |
| [30] |
谢银海.南京地区激光雷达气溶胶光学参数观测[D].南京: 南京信息工程大学, 2016. Xie Y H. Lidar observation of aerosol optical parameters in Nanjing[D]. Nanjing: Nanjing University of Information Science & Technology, 2016. |
| [31] |
刘斌, 臧增亮, 田平, 等. 基于Revised IMPROVE方法和MIE方法计算北京地区气溶胶消光系数的对比分析[J]. 装备环境工程, 2019, 16(6): 123-128. Liu B, Zang Z L, Tian P, et al. Contrastive analysis of extinction coefficient of aerosol in Beijing based on revised IMPROVE equation and MIE method[J]. Equipment Environmental Engineering, 2019, 16(6): 123-128. |
| [32] | Malm W C, Sisler J F, Huffman D, et al. Spatial and seasonal trends in particle concentration and optical extinction in the United States[J]. Journal of Geophysical Research, 1994, 99(D1): 1347-1370. |
| [33] | Pitchford M, Malm W, Schichtel B, et al. Revised algorithm for estimating light extinction from IMPROVE particle speciation data[J]. Journal of the Air & Waste Management Association, 2007, 57(11): 1326-1336. |
| [34] |
徐薇, 修光利, 陶俊, 等. 上海市大气散射消光特征及其与颗粒物化学组成关系研究[J]. 环境科学学报, 2015, 35(2): 379-385. Xu W, Xiu G L, Tao J, et al. Characterization of light scattering extinction and the relationship with particle components in Shanghai[J]. Acta Scientiae Circumstantiae, 2015, 35(2): 379-385. |
| [35] | Li X, Li S S, Xiong Q L, et al. Characteristics of PM2.5 chemical compositions and their effect on atmospheric visibility in urban Beijing, China during the heating season[J]. International Journal of Environmental Research and Public Health, 2018, 15(9): 1924. |
| [36] | Wu D, Zhang F, Ge X L, et al. Chemical and light extinction characteristics of atmospheric aerosols in suburban Nanjing, China[J]. Atmosphere, 2017, 8(8): 149. |
| [37] | Zhao T, Yang L X, Yan W D, et al. Chemical characteristics of PM1/PM2.5 and influence on visual range at the summit of Mount Tai, North China[J]. Science of the Total Environment, 2017, 575: 458-466. |
| [38] | Wang J, Zhang Y F, Feng Y C, et al. Characterization and source apportionment of aerosol light extinction with a coupled model of CMB-IMPROVE in Hangzhou, Yangtze River Delta of China[J]. Atmospheric Research, 2016, 178-179: 570-579. |
| [39] |
马莹.珠三角典型城市与沿海地区气溶胶水溶性组分对比分析[D].广州: 暨南大学, 2017. Ma Y. Comparative analysis of water-soluble components of aerosol in central cities and coastal areas of Pearl River Delta[D]. Guangzhou: Jinan University, 2017. |
| [40] |
元洁. RT-4型有机碳元素碳分析仪的使用与日常维护[J]. 分析仪器, 2015(5): 85-88. Yuan J. Use and maintenance of RT-4 OCEC carbon analyzer[J]. Analytical Instrumentation, 2015(5): 85-88. |
| [41] |
王强, 钟琪, 郭杰, 等. 基于腔减相移光谱技术测量大气气溶胶消光系数的应用研究[J]. 气候与环境研究, 2017, 22(1): 108-114. Wang Q, Zhong Q, Guo J, et al. An application study on measurement of atmospheric aerosol extinction coefficient based on cavity attenuated phase shift spectroscopy technique[J]. Climatic and Environmental Research, 2017, 22(1): 108-114. |
| [42] |
霍俊涛, 王新宁, 段玉森, 等. 2015~2017年上海郊区大气新粒子生成特征[J]. 环境科学, 2019, 40(11): 4791-4800. Huo J T, Wang X N, Duan Y S, et al. First long-term study of atmospheric new particle formation in the suburb of Shanghai from 2015 to 2017[J]. Environmental Science, 2019, 40(11): 4791-4800. |
| [43] |
胡敏, 尚冬杰, 郭松, 等. 大气复合污染条件下新粒子生成和增长机制及其环境影响[J]. 化学学报, 2016, 74(5): 385-391. Hu M, Shang D J, Guo S, et al. Mechanism of new particle formation and growth as well as environmental effects under complex air pollution in China[J]. Acta Chimica Sinica, 2016, 74(5): 385-391. |
| [44] | Jung J, Lee H, Kim Y J, et al. Aerosol chemistry and the effect of aerosol water content on visibility impairment and radiative forcing in Guangzhou during the 2006 Pearl River Delta campaign[J]. Journal of Environmental Management, 2009, 90(11): 3231-3244. |
| [45] |
张智察, 倪长健, 汤津赢, 等. "干"气溶胶等效复折射率与其质量浓度指标的相关性研究[J]. 光学学报, 2019, 39(5): 0501002. Zhang Z C, Ni C J, Tang J Y, et al. Correlation between equivalent complex refraction index of "dry" aerosol and its mass concentration index[J]. Acta Optica Sinica, 2019, 39(5): 0501002. |