 2017, Vol. 38


2. 中国科学院陆地表层格局与模拟重点实验室, 北京 100101;
3. 中国科学院大学资源与环境学院, 北京 100049
2. Key Laboratory of Land Surface Pattern and Simulation, Chinese Academy of Sciences, Beijing 100101, China;
3. College of Resources and Environment, University of Chinese Academy of Sciences, Beijing 100049, China
大气颗粒物(PM2.5和PM10, 空气动力学直径分别小于等于2.5 μm和10 μm的颗粒物)具有粒径小、比表面积大等特性, 可较长时间悬停在大气中并能进行远距离输送, 因而更容易吸附一些金属离子和有机物等有害物质, 从而影响大气环境质量和危害人体健康[1].近年来, 大气颗粒物及其对公众健康的危害引起了国内外研究者的广泛关注, 流行病学研究表明, PM10和PM2.5对人体健康的影响显著[2~6].国内外学者在颗粒物中重金属的污染水平、环境行为及人体健康风险等方面有了一定的积累, 据报道[7~12], 发展中国家大气颗粒物中重金属质量浓度较高, 而发达国家普遍处于较低水平, 且70%以上的重金属分布在PM10中, 随着颗粒物粒径的减小, 重金属含量升高.大气颗粒物中镉(Cd)、铬(Cr)、钴(Co)、锰(Mn)、铅(Pb)、镍(Ni)等入列美国环保署的危险空气污染物清单, 国际癌症研究署也将As、Cd、Cr、Ni及他们的部分化合物列为致癌物.目前, 大气颗粒物中重金属的健康风险评价的研究并不全面, 多数研究仅停留在单一摄入方式的健康风险[13~15], 并不能代表暴露人群面临的全部健康风险.城市化速度逐渐加快, 密集型的工业生产和人类活动已导致严重的城市大气重金属污染.北京市截至2015年年末, 常住人口达到2 170.50万人, 近年来空气质量状况不佳, 颗粒物质量浓度曾几度爆表.本文旨在通过探究北京大气颗粒物(PM2.5和PM10)及降尘中10种重金属元素的分布, 评价它们经多种摄入方式带来的健康风险, 以期为北京今后大气中重金属的防治政策制定提供基础的数据支撑.
1 材料与方法 1.1 样品采集与分析本研究利用大流量空气采样器(Echo Tecora Inc., Italy, 200 L·min-1, 24 h连续采样)和降尘罐(每月1次)采集了中国科学院天地科学园区内大气中PM2.5、PM10样品各40个和降尘样品12个, 采样时间2014年1、4、7、10月, 每个月份连续采集10 d.采样点设在办公楼楼顶, 距离地面约30 m.采样前后将石英纤维滤膜(Muktell Inc. Sweden, φ102 mm)置于恒温恒湿(25℃±2℃, 52%±2%)的干燥器中平衡24 h, 大气颗粒物质量浓度采用重量法[16]测算.颗粒物及降尘样品采用高氯酸-氢氟酸-硝酸-电热板体系[17]进行前处理, 定量样品体积至30 mL并转移到聚四氟乙烯样品瓶中, 用电感耦合等离子质谱法(ICP-MS, Elan 9000, PerkinElmer Inc. USA)测定其中Cu、Mn、Pb、Ti、V、Cd、Cr、Co、Mo、Ni等10种金属元素含量.
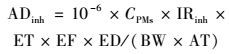
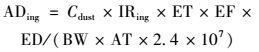
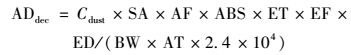
1.2 健康风险评价模型 1.2.1 摄入量估算模型根据美国环保署建立的评价方法(EPA/540/1-89/002; EPA 540-R-02-002), 计算了人体经由呼吸(inhalation)、口入降尘(dust ingestion)和皮肤接触(dermal contact)这3种途径摄入Cd、Cr、Ni、Co、Cu、Mn、Mo、Pb、V的日摄入剂量, 计算公式为式(1)~(3):
|
(1) |
|
(2) |
|
(3) |
式中, ADinh、ADing、ADdec分别为呼吸、口入降尘、皮肤接触这3种摄入方式的日摄入剂量, 单位为mg·(kg·d)-1, CPMs、Cdust分别为重金属元素在颗粒物(PM2.5和PM10)中的质量浓度和在降尘中的含量, 单位分别为ng·m-3和μg·g-1, 公式中10-6、2.4×10⁷及2.4×10⁴为单位统一系数, 其他参数及意义列于表 1.
|
|
表 1 重金属摄入剂量估算模型应用参数 Table 1 Parameters applied to estimate the intake doses in the heavy metals model |
1.2.2 健康风险评价模型
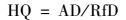
健康风险分为致癌健康风险和非致癌健康风险, 非致癌健康风险以危害系数(hazard quotient, HQ)衡量, 危害系数定义为某元素日均摄入剂量(AD)与日参考摄入剂量(reference doses, RfD)的比值, 即:
|
(4) |
致癌风险(cancer risk, CR)为某元素日均摄入剂量(AD)与该元素致癌斜率因子(slope factor, SF)的乘积, 即:
|
(5) |
危害指数(hazard index, HI)为所有参评元素单一摄入方式的危害系数(HQ)之和, HIs为3种摄入方式的危害指数之和, 即:
|
(6) |
|
(7) |
对于非致癌健康风险, 当HI或HIs值超过1时[13], 表明可能会产生非致癌健康风险, 数值越大, 风险越高.对于致癌健康风险, CR的可接受水平[13]为10-6~10-4, 当HIs大于10-4时, 表示有极高的致癌健康风险, 9种参与健康风险评价的金属元素的RfD和SF值[7~9]列于表 2.
|
|
表 2 重金属元素的参考剂量和致癌斜率因子1) Table 2 Reference doses and slope factors of heavy metals |
2 结果与讨论 2.1 颗粒物质量浓度与季节变化
北京大气中PM2.5和PM10的年均质量浓度分别为153.40 μg·m-3±84.71 μg·m-3和232.93 μg·m-3±154.54 μg·m-3, 其值分别为国家《环境空气质量标准GB 3095-2012》中环境空气二类环境功能区标准限值(PM2.5和PM10的年均标准值分别为35 μg·m-3和70 μg·m-3)的5倍和3倍, 不难看出,研究区域颗粒物年均质量浓度较高,而有研究表明高浓度的颗粒物及其中含有的污染物会产生较高的人体健康风险[20~22],本结果与Tan等[23]的研究结果基本一致. PM2.5和PM10的季均质量浓度对比如图 1所示, PM2.5的季均质量浓度夏季最小, 秋季最高; PM10的季均质量浓度同样也是夏季最小, 而冬季最高. PM2.5的日均质量浓度与PM10的日均质量浓度比值, 即PM2.5/PM10的值介于0.22~1.14之间, 平均值为0.74, PM2.5/PM10值秋季(0.91) 平均最高, 其次为夏季(0.74)、冬季(0.72), 春季(0.53) 平均最低, 说明颗粒物污染源中秋季排放小于2.5 μm的颗粒物较多, 春季排放2.5~10 μm的颗粒物较多, 主要因为秋冬季节城市集中供暖逐渐开始, 燃煤量加大, 经观察采样点附近的枫林绿洲和南沙滩居民区为小区自燃煤集中供暖, 污染源比较集中, 且由于气候的原因易形成逆温天气不利于污染物的扩散; 春季PM2.5/PM10的值较低可能是由于北京春季沙尘天气夹带大量的大颗粒[24]; 同时, 采样地周边奥林匹克森林公园有大量花卉植物, 春季相继开放导致花粉等生物大粒子较多, PM10的质量浓度增加[25].

|
图 1 颗粒物季节质量浓度分布 Fig. 1 Seasonal concentration distribution of particulate matter |
HYSPLIT模型中后向轨迹分析方法在许多颗粒物外来源解析的研究中得到了应用[26~28], 并且其分析结果与其他分析相吻合.本研究使用HYSPLIT模型中后向轨迹方法分析了采样地上空外来颗粒物的来向, 图 2为2014年的1、4、7和10月期间研究区域上空30、250和500 m高空大气颗粒物148 h的后向轨迹分析(Back trajectories analysis)结果.如图 2所示, 在冬季(1月为代表)采样点外来气团主要为俄罗斯南部的1 000~3 000 m高空的长途气团, 经过蒙古国、我国内蒙古地区, 从西北方向抵达北京; 春季(4月为代表)主要为蒙古国1 000 m以下高空中气团经过我国内蒙古地区到达北京,

|
图 2 北京颗粒物的后向轨迹分析 Fig. 2 Back trajectory analysis of particulate matter in Beijing |
这与北京春季多风沙的天气相吻合; 夏季(7月为代表)主要为江苏、河南、山东及河北地区500 m高空下的短途气团; 秋季(10月为代表)外来气团由东南方向逐渐转向西北方向, 主要为俄罗斯西南部、哈萨克斯坦4 000 m以上高空的气团途径蒙古国、我国内蒙古地区、后转向东北由环渤海方向抵达北京, 秋季北京外来气团经过了较多的地方, 可能带来了更为复杂的污染物, 这也是北京秋冬季节颗粒物及金属元素质量浓度较高的原因之一.
综上可知, 研究区域外源颗粒物的来向可归为4类, 第一类为西北方向, 最远可达蒙古、俄罗斯等地经我国内蒙、河北到达终点; 第二类为北部方向, 最远达欧亚大陆交界处, 经我国东北地区到达终点; 第三类为西南方向, 主要来自我国河南、河北及山东的交汇处; 第四类为东南方向的沿海地区, 随着夏季风经过河北、天津等到达终点, 本研究中4类外来源与孔珊珊等[29]模拟2015年9月~2016年8月的结果类似, 同时与徐祥德等[30]模拟2003年北京地区的结果相似, 表明北京外来颗粒物源主要与气候相关, 年际气候变化稳定的情况下, 北京大气外来颗粒物源较为稳定.
2.3 颗粒物中重金属元素的质量浓度分布颗粒物中目标元素的年均质量浓度(±标准偏差)和粒径分布比值(PM2.5/PM10)见表 3. 10种目标金属元素在PM2.5和PM10中具有相似的分布规律, 各元素的年均质量浓度从高到低依次为Ti>Mn>Pb>Cu>Cr>Ni>V>Cd>Mo>Co.其中Ti、Mn、Pb、Cu、Cr这5种元素占PM2.5和PM10中10种目标元素总质量浓度的91.93%和92.49%.相比《环境空气质量标准GB 3095-2012》中标准限值, Pb的质量浓度低于标准限值(500 ng·m-3), 可能与我国自2000年7月起全面禁止使用含铅汽油且研究区域无显著铅污染源有关; PM2.5中Cd的质量浓度低于标准限值(5.00 ng·m-3), 但PM10中Cd的质量浓度超过标准限值.
|
|
表 3 颗粒物及降尘中10种金属元素年均含量1) Table 3 Annual mean concentrations of ten heavy metals in particulate matter and dust |
从各元素的PM2.5/PM10值的大小可得, 55%以上的重金属元素分布于PM2.5中, 仅有Cd、Cu、Mo、V和Mn这5种元素在PM2.5~10中的占比相对较高(>30%), Ti、Cr、Pb和Ni这4种元素70%以上分布在PM2.5中, 与Tan等[23]的研究结论一致.本研究结果与其他研究相比偏低或相近, Tan等[23]测定了北京冬季大气颗粒物及重金属元素的质量浓度, PM2.5和PM10的质量浓度(142.3 μg·m-3和193.4 μg·m-3)略低于本研究, 但Tan等的研究中Pb的质量浓度(281.40 ng·m-3)最高, 其次是Ti(195.10 ng·m-3)和Mn(164.00 ng·m-3), 其余7种元素的质量浓度高低顺序与本研究一致, 元素质量浓度高低顺序的差异与季节和采样点周边污染源有关.
2.4 颗粒物中金属元素的季节分布PM2.5和PM10中10种金属元素的季节分布如图 3所示.从中可以看出, 多数元素质量浓度(Mn、Ti、V除外)高值出现在秋冬两季, 低值出现在春夏两季, 与颗粒物的季节分布状态一致. Mn、Ti两种元素质量浓度高值出现在春秋季, V质量浓度高值出现在冬春两季.元素的季节分布与排放源和扩散条件相关, Mn、Ti两种元素主要来自交通排放[31, 32], V主要来自油类燃烧[33]; 另外秋冬季节城市逐渐进入采暖期, 燃煤量增加, 导致颗粒物的排放量增加, 且秋冬季节常出现逆温天气, 影响颗粒物的扩散, 进而影响了颗粒物中金属元素的分布; 夏季频繁的降雨和湿热天气, 使得大气边界层升高, 对颗粒物的去除作用明显, 资料显示, 一次中等强度的降雨可使颗粒物质量浓度平均下降56.3%[34].

|
图 3 北京大气PM2.5和PM10中10种金属元素的季节分布 Fig. 3 Seasonal distribution of heavy metals in PM2.5 and PM10 in Beijing atmosphere |
降尘中10种目标金属元素的含量见表 3, 它们的含量由高到低依次为Ti>Mn>Pb>Cu>Ni>Cr>V>Co>Mo>Cd, 含量最高的元素仍为Ti, 其含量为2 561.48 μg·g-1, 占所有目标元素的质量分数为72.57%, 而含量最低的目标元素为Cd, 其含量为0.03 μg·g-1, 仅占所有目标元素的0.16%, 降尘中各元素的含量高低与颗粒物中有差异, 说明降尘的来源不止颗粒物的干沉降[35].对比其与Wei等[20]测定的北京降尘中的对应金属元素含量, 除Cr元素外, 其他元素的含量均处于同一水平.
地累积指数(geo-accumulation index, Igeo)方法由于考虑了地球化学循环过程和人类活动的影响被广泛应用于评价沉积物、土壤及道路降尘中重金属的污染水平[36~39].本文根据前人研究方法[39, 40]计算了降尘中10种金属元素的地累积指数(Igeo).降尘中10种金属元素的Igeo如图 4所示, Cd、Co、Cr、Cu、Mn、Mo、Ni、Pb、Ti、V等元素的Igeo平均值分别为4.03、-0.08、-0.80、1.33、-1.18、-0.20、0.43、2.49、-1.34、-1.32.其中Co、Cr、Mn、Mo、Ti、V等Igeo平均值小于0, 说明这6种重金属元素人为来源干扰较小, 处于“未污染状态”; 而Cd、Cu、Ni、Pb等Igeo平均值大于0, 且差异较大, 说明这4种元素的污染程度各不相同.其中Cd的Igeo均值高达4.03, 处于“重污染状态”, Wei等[20]的研究表明, 高浓度的Cd是高密度的人类活动引起的, 降尘采样环境周围有交通干道、密集的科研办公楼及住宅小区等人类活动强度较大的设施和建筑, 可能是Cd污染重的原因. Pb的Igeo均值为2.49, 处于“中度污染到重度污染之间的状态”, 鉴于其血液毒性, 应该引起足够的重视. Cu的Igeo均值为1.33, 处于“中度污染状态”, 根据前人的研究[20, 39, 41], 北京地区降尘中, Cu的含量有增加的趋势, 应引起注意, 本研究也会继续监测其浓度. Ni的Igeo均值为0.43, 处于“轻微污染的状态”.

|
图 4 降尘中重金属的地累积指数分布 Fig. 4 Distribution of geo-accumulation index of heavy metals in dust |
根据公式(1)~(3), 计算了PM10及降尘中Cd、Co、Cr、Cu、Mn、Mo、Ni、Pb、V等9种重金属元素通过呼吸(inhalation)、口入降尘(dust ingestion)、皮肤接触(dermal contact)这3种方式每日摄入剂量, 并根据公式(4)~(7) 计算了在当前日摄入剂量下引起的健康风险, 包括非致癌健康风险和致癌健康风险两部分, 日摄入剂量和健康风险的计算结果见表 4和表 5.
|
|
表 4 PM10及降尘中重金属的日摄入剂量/mg·(kg·d)-1 Table 4 Daily intake doses of heavy metals in PM10 and dust/mg·(kg·d)-1 |
|
|
表 5 PM10及降尘中重金属的非致癌和致癌健康风险1) Table 5 Non-carcinogenic and carcinogenic health risks of heavy metals in PM10 and dust |
对于非致癌日摄入剂量, 口入降尘是最主要的摄入途径, 占总摄入剂量的73.35%, 其次是皮肤接触和呼吸, 分别占总摄入剂量的16.45%和10.20%, 结果与其他研究相似[21, 22, 42].就口入降尘摄入方式而言, 日摄入剂量最大的是Mn, 其摄入剂量为3.19×10⁻⁵ mg·(kg·d)-1, 日摄入剂量最小的是Cd, 其摄入量为1.25×10⁻⁷ mg·(kg·d)-1, Mn的口入降尘摄入剂量比Cd的口入降尘摄入剂量高2个数量级, 可见不同的重金属元素其摄入量有较大的差异.就3种摄入途径的日摄入总量而言, Mn也是摄入总量最多的元素, 可达4.24×10⁻⁵ mg·(kg·d)-1.对于致癌摄入剂量, 最大的日均致癌摄入剂量也是口入降尘摄入方式中的Mn, 其平均值为2.28×10⁻⁵ mg·(kg·d)-1, 日均致癌摄入剂量最小的是皮肤接触摄入方式中的Cd, 其平均值为2.00×10⁻⁸ mg·(kg·d)-1, 由于不同的元素其引起健康风险的程度有差异, 故仅通过摄入剂量不能全面的反映重金属元素对摄入人群的健康影响.
就健康风险而言, 3种摄入方式非致癌健康风险中, 呼吸摄入方式引起的健康风险平均值是其他两种摄入方式的19.4和7.3倍, 呼吸摄入方式引起的非致癌风险从高到低依次为Mn>Pb>Cu>Cr>Ni>V>Cd>Mo>Co; 口入降尘和皮肤接触摄入方式引起的非致癌健康风险有相同的次序, 从高到低依次为Mn>Pb>Cu>Ni>Cd>V>Co>Mo>Cd, 根据不同元素经3种摄入方式摄入引起的非致癌健康风险值的不同可以得出, 呼吸是重金属元素引起人体健康风险的重要途径, 风险值由重金属元素在大气颗粒物和降尘中的质量浓度及及日均参考摄入剂量决定.从风险值的大小角度而言, 无论是单一元素的非致癌健康风险(最大单一元素非致癌健康风险为口入降尘摄入方式中的Mn元素, 其非致癌健康风险值为3.19×10⁻⁵≪1) 还是这3种摄入方式总非致癌风险(HIs值为3.46×10⁻¹<1) 都在安全范围内, 但呼吸摄入方式中Mn元素, 其非致癌健康风险的平均值为2.38×10⁻¹, 比其他元素高1~4个数量级, 且其值比较接近于1, 说明若长期暴露在这样的环境中, 其对人体健康有一定的危害(表 5).另外, 研究表明Pb能够导致肾脏病变、神经病变乃至脑病变[43]; 而Cr元素能够导致发育中的肾脏和神经病变[44], 尽管本研究中, Pb(1.99×10⁻⁵)、Cr(6.55×10⁻⁶)的非致癌健康风险并不突出, 但人们却不能够忽视其产生的健康影响.
对于致癌健康风险, 由于致癌斜率因子的限制, 本研究只考虑了Cd、Cr、Co、Ni这4种元素经由呼吸摄入方式引起的致癌健康风险, 4种元素的致癌健康风险平均值从高到低依次为Cr>Cd>Co>Ni, 其值分别为2.82×10⁻⁵、9.01×10⁻⁷、7.12×10⁻⁷、3.08×10⁻⁷, 其中, Cd、Co、Ni的致癌风险值均小于最低的可接受水平10-6, 致癌风险最高的Cr的风险值处在可接受水平范围(10-6~10-4)内, 说明研究区域中, 这4种元素对成年人的致癌健康风险不高, 处在较为安全的范围内.
3 结论(1) 研究区域大气PM2.5和PM10的年均质量浓度分别为153.40 μg·m-3±84.71 μg·m-3和232.93 μg·m-3±154.54 μg·m-3, 是《环境空气质量标准GB 3095-2012》中年均浓度限值的5倍和3倍, 且以粒径小于2.5 μm的颗粒物(PM2.5)为主.外源颗粒物来向与气候相关, 随季节的变化而改变.
(2) 研究区域大气颗粒物和降尘中优势元素均为Ti、Mn和Pb, 而Co、Mo、Cd最少.
(3) 研究区域大气颗粒物中多数目标重金属元素质量浓度高值出现在秋冬两季, 低值出现在春夏两季, 与颗粒物的季节分布状态一致.
(4) 研究区域降尘中多数元素处于未污染状态, Ni、Cu、Pb、Cd这4种元素污染水平依次递增, 应该引起注意.
(5) 健康风险评价中, 目标金属元素的致癌和非致癌健康风险均在安全范围内, 短期内对成人的健康无明显影响, 但并不能忽略长期暴露于这种环境中引发的健康风险.
| [1] |
杨婧, 郭晓爽, 滕曼, 等. 我国大气细颗粒物中金属污染特征及来源解析研究进展[J]. 环境化学, 2014, 33(9): 1514-1521. Yang J, Guo X S, Teng M, et al. A review of atmospheric fine particulate matter associated trace metal pollutants in China[J]. Environmental Chemistry, 2014, 33(9): 1514-1521. DOI:10.7524/j.issn.0254-6108.2014.09.019 |
| [2] | Holgate S T, Sandstrom T, Frew A J, et al. Health effects of acute exposure to air pollution. Part Ⅰ:Healthy and asthmatic subjects exposed to diesel exhaust[J]. Rearch Report Health Effects Institute, 2003, 112: 1-30. |
| [3] | Kappos A D, Bruckmann P, Eikmann T, et al. Health effects of particles in ambient air[J]. International Journal of Hygiene and Environmental Health, 2004, 207(4): 399-407. DOI:10.1078/1438-4639-00306 |
| [4] | Pope Ⅲ C A, Dockery D W. Health effects of fine particulate air pollution:lines that connect[J]. Journal of the Air & Waste Management Association, 2006, 56(6): 709-742. |
| [5] | Vanos J K, Hebbern C, Cakmak S. Risk assessment for cardiovascular and respiratory mortality due to air pollution and synoptic meteorology in 10 Canadian cities[J]. Environmental Pollution, 2014, 185: 322-332. DOI:10.1016/j.envpol.2013.11.007 |
| [6] | Zhang L L, Jin X W, Johnson A C, et al. Hazard posed by metals and as in PM2.5 in air of five megacities in the Beijing-Tianjin-Hebei region of China during APEC[J]. Environmental Science and Pollution Research, 2016, 23(17): 17603-17612. DOI:10.1007/s11356-016-6863-2 |
| [7] | Yu L D, Wang G F, Zhang R J, et al. Characterization and source apportionment of PM2.5 in an urban environment in Beijing[J]. Aerosol and Air Quality Research, 2013, 13(2): 574-583. |
| [8] | Tao J, Gao J, Zhang L, et al. PM2.5 pollution in a megacity of southwest China:source apportionment and implication[J]. Atmospheric Chemistry and Physics, 2014, 14(16): 8679-8699. DOI:10.5194/acp-14-8679-2014 |
| [9] | Geng N B, Wang J, Xu Y F, et al. PM2.5 in an industrial district of Zhengzhou, China:chemical composition and source apportionment[J]. Particuology, 2013, 11(1): 99-109. DOI:10.1016/j.partic.2012.08.004 |
| [10] | Ergenekon P, Ulutaş K. Heavy metal content of total suspended air particles in the heavily industrialized town of Gebze, Turkey[J]. Bulletin of Environmental Contamination and Toxicology, 2014, 92(1): 90-95. DOI:10.1007/s00128-013-1148-7 |
| [11] | Choung S, Oh J, Han W S, et al. Comparison of physicochemical properties between fine (PM2.5) and coarse airborne particles at cold season in Korea[J]. Science of the Total Environment, 2016, 541: 1132-1138. DOI:10.1016/j.scitotenv.2015.10.021 |
| [12] | Jiménez A S, Heal M R, Beverland I J. Correlations of particle number concentrations and metals with nitrogen oxides and other traffic-related air pollutants in Glasgow and London[J]. Atmospheric Environment, 2012, 54: 667-678. DOI:10.1016/j.atmosenv.2012.01.047 |
| [13] | Addo M A, Darko E O, Gordon C, et al. Human health risk assessment of airborne trace elements for human receptors in the vicinity of the diamond cement factory, Volta Region, Ghana[J]. International Journal of Sustainable Development and Planning, 2016, 11(4): 522-536. DOI:10.2495/SDP |
| [14] | Li F, Zhang J D, Huang J H, et al. Heavy metals in road dust from Xiandao district, Changsha city, China:characteristics, health risk assessment, and integrated source identification[J]. Environmental Science and Pollution Research, 2016, 23(13): 13100-13113. DOI:10.1007/s11356-016-6458-y |
| [15] | Nduka J K, Amuka J P O, Onwuka J C, et al. Human health risk assessment of lead, manganese and copper from scrapped car paint dust from automobile workshops in Nigeria[J]. Environmental Science and Pollution Research, 2016, 23(20): 20341-20349. DOI:10.1007/s11356-016-7219-7 |
| [16] |
HJ 618-2011, 环境空气PM10和PM2. 5的测定重量法[S]. HJ 618-2011, Determination of atmospheric articles PM10 and PM2.5 in ambient air by gravimetric method[S]. |
| [17] |
HJ 657-2013, 空气和废气颗粒物中铅等金属元素的测定电感耦合等离子体质谱法[S]. HJ 657-2013, Ambient air and stationary source emission-determination of metals in ambient particulate matter-inductively coupled plasma/mass spectrometry (ICP-MS)[S]. |
| [18] |
赵秀阁, 段小丽. 中国人群暴露参数手册(成人卷)[M]. 北京: 中国环境科学出版社, 2014: 3-26. Zhao X G, Duan X L. Exposure factors handbook of Chinese population (Adults)[M]. Beijing: China Environmental Press, 2014: 3-26. |
| [19] | US EPA. Exposure factors handbook:2011 edition[M]. Washington, DC:National Center for Environmental Assessment Office of Research and Development, 2011. 4-21. |
| [20] | Wei X, Gao B, Wang P, et al. Pollution characteristics and health risk assessment of heavy metals in street dusts from different functional areas in Beijing, China[J]. Ecotoxicology and Environmental Safety, 2015, 112: 186-192. DOI:10.1016/j.ecoenv.2014.11.005 |
| [21] | Ferreira-Baptista L, De Miguel E. Geochemistry and risk assessment of street dust in Luanda, Angola:a tropical urban environment[J]. Atmospheric Environment, 2005, 39(25): 4501-4512. DOI:10.1016/j.atmosenv.2005.03.026 |
| [22] | Chen H, Lu X W, Li L Y. Spatial distribution and risk assessment of metals in dust based on samples from nursery and primary schools of Xi'an, China[J]. Atmospheric Environment, 2014, 88: 172-182. DOI:10.1016/j.atmosenv.2014.01.054 |
| [23] | Tan J H, Duan J C, Zhen N J, et al. Chemical characteristics and source of size-fractionated atmospheric particle in haze episode in Beijing[J]. Atmospheric Research, 2016, 167: 24-33. DOI:10.1016/j.atmosres.2015.06.015 |
| [24] |
樊守彬, 田刚, 秦建平, 等. 道路降尘与扬尘PM10排放的关系研究[J]. 环境科学与技术, 2012, 35(1): 159-163. Fan S B, Tian G, Qin J P, et al. Relationship of road dust fall and fugitive PM10 emission[J]. Environmental Science & Technology, 2012, 35(1): 159-163. |
| [25] |
刘杰, 杨鹏, 吕文生, 等. 北京城6区大气颗粒物质量浓度变化规律研究[J]. 安全与环境学报, 2015, 15(6): 333-339. Liu J, Yang P, Lv W S, et al. On the mass concentration variations of the particulate matters in the six downtown districts of Beijing[J]. Journal of Safety and Environment, 2015, 15(6): 333-339. |
| [26] | Fang G C, Zhuang Y J, Kuo Y C, et al. Ambient air metallic elements (Mn, Fe, Zn, Cr, Cu, and Pb) pollutants sources study at a rural resident area near taichung thermal power plant and industrial park:6-month observations[J]. Environmental Earth Sciences, 2016, 75: 587. DOI:10.1007/s12665-016-5347-5 |
| [27] | Pan Y P, Tian S L, Li X R, et al. Trace elements in particulate matter from metropolitan regions of Northern China:sources, concentrations and size distributions[J]. Science of the Total Environment, 2015, 537: 9-22. DOI:10.1016/j.scitotenv.2015.07.060 |
| [28] | Fang G C, Kuo Y C, Zhuang Y J. Source analysis of trace metal pollution received at harbor, airport and farmland locations in central Taiwan[J]. Aerosol and Air Quality Research, 2015, 15(5): 1774-1786. |
| [29] |
孔珊珊, 刘厚凤, 陈义珍. 基于后向轨迹模式对北京市PM2.5来源的探讨[J]. 中国环境管理, 2017, 9(1): 86-90. Kong S S, Liu H F, Chen Y Z. Discussion on the source distribution and transmission characteristics of PM2.5 in Beijing based on backward trajectory model[J]. Chinese Journal of Environmental Management, 2017, 9(1): 86-90. |
| [30] |
徐祥德, 周秀骥, 施晓晖. 城市群落大气污染源影响的空间结构及尺度特征[J]. 中国科学D辑地球科学, 2005, 48(SI): 1-24. Xu X D, Zhou X J, Shi X H. Spatial structure and scale feature of the atmospheric pollution source impact of city agglomeration[J]. Science in China Series D Earth Sciences, 2005, 48(SⅡ): 1-24. |
| [31] | Fabretti J F, Sauret N, Gal J F, et al. Elemental characterization and source identification of PM2.5 using positive matrix factorization:the malraux road tunnel, nice, France[J]. Atmospheric Research, 2009, 94(2): 320-329. DOI:10.1016/j.atmosres.2009.06.010 |
| [32] | Gietl J K, Lawrence R, Thorpe A J, et al. Identification of brake wear particles and derivation of a quantitative tracer for brake dust at a major road[J]. Atmospheric Environment, 2010, 44(2): 141-146. DOI:10.1016/j.atmosenv.2009.10.016 |
| [33] | Pey J, Querol X, Alastuey A. Discriminating the regional and urban contributions in the North-Western Mediterranean:PM levels and composition[J]. Atmospheric Environment, 2010, 44(13): 1587-1596. DOI:10.1016/j.atmosenv.2010.02.005 |
| [34] |
郭家瑜, 张英杰, 郑海涛, 等. 北京2015年大气细颗粒物的空间分布特征及变化规律[J]. 环境科学学报, 2016. Guo J Y, Zhang S J, Zheng H T, et al. The characteristics of Spatial distribution and variations of atmospheric fine particles in Beijing in 2015[J]. Acta Scientiae Circumstantiae, 2016. DOI:10.13671/j.hjkxxb.2016.0434 |
| [35] | Zhu L J, Liu J K, Cong L, et al. Spatiotemporal characteristics of particulate matter and dry deposition flux in the Cuihu Wetland of Beijing[J]. PLoS One, 2016, 11(7): e0158616. DOI:10.1371/journal.pone.0158616 |
| [36] | Lu X W, Wang L J, Lei K, et al. Contamination assessment of copper, lead, zinc, manganese and nickel in street dust of Baoji, NW China[J]. Journal of Hazardous Materials, 2009, 161(2-3): 1058-1062. DOI:10.1016/j.jhazmat.2008.04.052 |
| [37] | Hasan A B, Kabir S, Reza A H M S, et al. Enrichment factor and geo-accumulation index of trace metals in sediments of the ship breaking area of Sitakund Upazilla (Bhatiary-Kumira), Chittagong, Bangladesh[J]. Journal of Geochemical Exploration, 2013, 125: 130-137. DOI:10.1016/j.gexplo.2012.12.002 |
| [38] | Zahra A, Hashmi M Z, Malik R N, et al. Enrichment and geo-accumulation of heavy metals and risk assessment of sediments of the Kurang Nallah-feeding tributary of the Rawal Lake Reservoir, Pakistan[J]. Science of the Total Environment, 2014, 470-471: 925-933. DOI:10.1016/j.scitotenv.2013.10.017 |
| [39] | Zheng X X, Zhao W J, Yan X, et al. Pollution characteristics and health risk assessment of airborne heavy metals collected from Beijing bus stations[J]. International Journal of Environmental Research and Public Health, 2015, 12(8): 9658-9671. DOI:10.3390/ijerph120809658 |
| [40] | 中国环境监测总站. 中国土壤元素背景值[M]. 北京: 中国环境科学出版社, 1990: 330-482. |
| [41] | Tanner P A, Ma H L, Yu P K N. Fingerprinting metals in urban street dust of Beijing, Shanghai, and Hong Kong[J]. Environmental Science & Technology, 2008, 42(19): 7111-7117. |
| [42] | Zheng N, Liu J S, Wang Q C, et al. Heavy metals exposure of children from stairway and sidewalk dust in the smelting district, Northeast of China[J]. Atmospheric Environment, 2010, 44(27): 3239-3245. DOI:10.1016/j.atmosenv.2010.06.002 |
| [43] | Caravanos J, Weiss A L, Blaise M J, et al. A survey of spatially distributed exterior dust lead loadings in New York City[J]. Environmental Research, 2006, 100(2): 165-172. DOI:10.1016/j.envres.2005.05.001 |
| [44] | Jones E A, Wright J M, Rice G, et al. Metal exposures in an inner-city neonatal population[J]. Environment International, 2010, 36(7): 649-654. DOI:10.1016/j.envint.2010.04.007 |