 2014, Vol.


浮游藻类是普遍存在于自然水体中的一类有色素能自养生活的低等植物,是物质代谢和能量循环的初级生产者(是湖泊水体中鱼类和其他经济动物的重要饵料),对维持湖泊水生态系统的平衡起着重要作用[1, 2]. 浮游藻还与湖泊水的营养状况密切相关,当水中富营养化达到一定程度,就会产生藻华[3]. 因此,需要建立一种快速、 低成本的浮游藻群落组成识别技术,以实现浮游藻群落组成的常规和应急监测.
目前,常用的浮游藻群落组成分析方法有显微镜法、 色素分析法和荧光法等. 近年来,随着高效液相色谱法分析技术和CHEMTAX矩阵因子化程序的发展,通过测定水体中光合色素的含量定量浮游藻群落组成和丰度得到广泛应用[4]. CHEMTAX矩阵因子化程序采用“最速下降算法”,让给定的初始特征色素比值在一定的范围内迭代,最后给出满足设定条件的最优解,从而确定浮游藻群落组成和丰度[5,6]. HPLC具有大批量样品连续分析的优势[7]. 另外,与传统分类方法相比[8,9],CHEMTAX克服了不能分辨一种色素被两种以上浮游藻作为特征色素的困难,对色素特征无明确的要求,同时又限定了色素比值的变化范围而不至于得到负的或不合理的结果. HPLC-CHEMTAX联用技术能够比较准确地给出优势浮游藻种类的色素比值和丰度值,是比较可靠的浮游藻化学分类技术[7, 10].
然而,HPLC色素分析存在明显缺点:化学试剂消耗量大、 分析时间相对较长、 需要专业人员操作. 三维荧光光谱(EEM)也称为激发发射矩阵[11],由于其具有灵敏度高、 选择性好、 特征信息全面、 样品无损等特点[12, 13],在化学和生物化学领域里得到广泛应用. 平行因子(PARAFAC)是三线性分解算法[14],能够将EEM分解为3个分矩阵:一个得分矩阵代表了组分浓度和两个载荷矩阵代表了发射光谱和激发光谱信息[15,16,17,18,19,20],实现荧光性混合组分的同时测定.
藻类色素组成具有种类特征性,其EEM能够反映不同藻类的色素组成[21, 22]. 本研究将PARAFAC模型应用于浮游藻EEM,获得浮游藻EEM的荧光成分,构建浮游藻“荧光成分比值矩阵”,利用CHEMTAX程序建立了浮游藻群落组成荧光分析技术,类似技术尚未见报道.
本研究选择培养了23种湖泊浮游藻(表 1),分属硅藻门、 蓝藻门、 绿藻门、 裸藻门的18个属. 所有藻种由中国海洋大学海洋污染生态化学实验室提供. 培养藻种选择合适的培养基(蓝藻门:BG11,绿藻门:SE,硅藻门:D1,裸藻门:AF-6),采用GXZ-3100型光照培养箱培养藻种,设置培养箱光照分别为80、 120、 160 μmol ·(m2 ·s)-1,温度为20℃,光暗比为12 h ∶12 h. 所有藻种在上述实验条件下经过7 d的预培养后扩大培养,扩大培养时要确定接种藻密度约为104 cell ·mL-1,每个藻种平行培养两份,其中一份的荧光数据作为训练集,另一份作为测试集. 培养周期为15 d,每3 d取一次样进行荧光测定.
| 表 1 实验所选用的23种浮游藻 Table 1 23 Phytoplankton species selected for the experiments |
选取进入指数生长期(培养的第9 d)且长势稳定的藻种,在混合前用BBE 藻类分析仪(德国bbe-moldaenke)测定藻种的叶绿素浓度,按照叶绿素浓度比1 ∶3 和3 ∶1把不同门类的浮游藻藻液两两混合,得到98个浮游藻混合样品,并对其进行荧光测定.
仪器:Fluorolog3-11荧光分光光度计及配套软件,1 cm石英比色皿.
仪器条件设定:激发波长400~650 nm,发射波长600~750 nm,步长5 nm,狭缝宽度5 nm,扫描速度80 nm ·s-1,信号积分时间0.05 s.
将扫描所得到的EEM数据在 Origin 7. 5 中转换成 ASCII Text File (*.txt) 数据格式,得到51行31列的数据矩阵,分别对应于激发波长(400~650 nm) 和发射波长(600~750 nm),在矩阵内的元素代表着相应激发和发射波长下的荧光强度. 将数据矩阵在MATLAB 中保存为.mat 结构体.
然后,对浮游藻EEM进行去散射和平滑处理. 采用Delaunay 三角形内插值法来去除散射[23, 24],该方法只对确定的散射区域进行拟合,未发生散射的区域,信号保持不变. 去散射的数据用如下公式进行标准化:
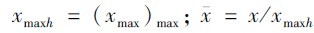
 是已标准化后的数据,x是原始样品数据,xmaxh是原始数据的最大值点.
 采用Daubechies7(db7)小波对标准化的荧光光谱数据进行分解,产生尺度分量和小波分量,将第一层尺度分量重构得到去噪后的浮游藻EEM数据.
PARAFAC[25]是基于三线性分解理论采用交替最小二乘算法实现的一种数学模型. 广泛应用于EEM数据的分析.
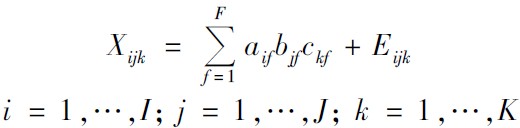
对于一个I×J×K的三维数据集X,其中I为样品数目,J和K分别为发射波长和激发波长数目, PARAFAC分解模型可表示为:
基于矩阵因子分析的CHEMTAX软件可以根据浮游藻色素分析结果确定浮游藻群落的组成和各类群的丰度. 本文以荧光分析代替HPLC色素分析,实现CHEMTAX浮游藻分类测定功能. CHEMTAX 功能的实现需要构建以下两个矩阵:①初始荧光成分比值矩阵,是具有浮游藻种类特征性的荧光成分组成,是由已知类别浮游藻的EEM解析得到,是CHEMTAX对浮游藻进行分类识别的依据; ②待测荧光成分数据矩阵,由待测样品浮游藻EEM荧光成分组成,与初始荧光成分比值矩阵相对应. CHEMTAX根据初始荧光成分比值对待测荧光成分数据进行分析并给出结果. 分析运算需要进行多次直到收敛,每次运算后的荧光成分比值作为下一次运算的起始值[26],在运算时需限定初始荧光成分比值的变化范围,默认的最大可能变化范围是40%,即原值是r,则其可以在2r/5~5r/2之间变动[10].
小波滤波器能有效地减小噪声影响,在改善信噪比的同时,提高信号稳定性和分辨率[27]. 在本研究中,利用db7小波对EEM进行一层分解,噪声主要存在于高频系数中,用第一层尺度分量(低频系数)进行二维小波重构,从而达到降低噪声突出有用信号的目的. 图 1(a)是四尾栅藻的原始EEM,经db7小波平滑后的EEM如图 1(b)所示.
 | 图 1 db7小波平滑前后的EEM (四尾栅藻) Fig. 1 3D fluorescence spectra of Sq before and after wavelet decomposition reconstruction |
PARAFAC对组分数很敏感,建模过程中选择适当的组分数对模型的效果影响较大. 只有选择正确的组分数目而且信噪比合适, 解析的结果才能反映真实的谱图. 本研究首先利用残差平方和 (SSR) 初步确定成分数F=12(图 2). 从图 2中可见,从成分数F=10到F=11时,残差有所增加,但从成分数F=11到F=12时,残差大幅度减小,且残差较 小; 而从成分数F=12变为F=13时,残差无明显 变化; 然后,通过荧光成分图和残差图对12成分PARAFAC模型进行验证(图 3和图 4),从图 3和图 4中可看出,12个荧光成分的光谱谱形符合物质光谱的一般特点,且12个荧光成分重构的EEM与PARAFAC分解前的EEM能够很好地吻合. 从图 5中可以看出,各荧光成分的激发光谱有一个或者两个最大值,发射光谱除了2、 6、 11、 12之外都只有一个最大值. 同时,从残差图可以看出,浮游藻EEM的荧光信号已经被完全提出.
 | 图 2 浮游藻EEM不同荧光成分数PARAFAC模型的残差平方和 Fig. 2 Analysis of the fit PARAFAC model to the measured EEM with increasing number of fluorescent components |
 | 图 3 浮游藻EEM以及12个荧光成分的重构EEM和残差分布 Fig. 3 Example of measured, modeled, residual EEM for twelve different components 荧光强度以Raman单位表示 |
 | 图 4 PARAFAC解析出的12个荧光成分的EEM图谱 Fig. 4 Contour plots of the spectral characteristics of the twelve fluorescent components obtained from the PARAFAC model |
 | 图 5 PARAFAC模型解析出的12个荧光成分的激发和发射光谱 Fig. 5 Excitation and emission loadings derived from the twelve component PARAFAC model 激发(虚线)和发射(实线)光谱 |
浮游藻EEM荧光成分组成的种类特征性是本技术的基础. 本研究通过Bayesian判别分析方法对浮游藻EEM荧光成分组成进行特征性分析. Bayesian判别分析是根据对样品进行一定认识的先验概率的信息来确定后验分布的方法[28, 29]. Bayesian判别分析的结果如图 6所示,4个门类的浮游藻在门水平上全部被正确分类. 表明同一门类浮游藻的EEM荧光成分组成相似,不同门类浮游藻的EEM荧光成分组成有明显差异.
 | 图 6 浮游藻EEM 12个荧光成分的Bayesian判别分析结果 Fig. 6 BDA of the 12 fluorescent components from the PARAFAC model Baci、 Cyan、 Chlo和Eugl分别代表硅藻门、 蓝藻门、 绿藻门和裸藻门 |
初始荧光成分比值矩阵集中反映浮游藻EEM荧光成分组成的种类特征性,是进行浮游藻分类识别的依据. 本研究从EEM-PARAFAC模型得到浮游藻EEM的12个荧光成分,同时,为了适应CHEMTAX的要求,把各浮游藻的12个荧光成分分别求和作为其第13个荧光成分,并进行最大值归一化. 将各浮游藻EEM荧光成分组成按照浮游藻门类分别作图(图 7),从图 7可以看出,同一门类浮游藻EEM荧光成分组成具有高度的相似性,而不同门类浮游藻EEM荧光成分组成差异明显. 这表明,利用浮游藻EEM荧光成分组成来分类识别测定浮游藻群落组成是可能的. 将各门类浮游藻EEM荧光成分组成分别取平均值,得到特定于4个门类浮游藻的荧光成分组成,作为CHEMTAX程序的初始荧光成分比值矩阵(表 2).
 | 图 7 各门类浮游藻的荧光成分组成图 Fig. 7 Fluorescent component compositions of the studied algae species |
| 表 2 初始荧光成分比值矩阵 Table 2 Initial fluorescent component ratios matrix/Initial ratio matrix for CHEMTAX analysis |
初始荧光成分比值矩阵是CHEMTAX程序进行浮游藻分类识别的依据,不仅要具有浮游藻种类特征性,而且要具有线性独立性[10],即任一门类浮游藻EEM的荧光成分组成都无法用其他门类浮游藻EEM的荧光成分组成线性拟合得到. 图 8为4个门类浮游藻EEM荧光成分组成的线性独立性分析,从中可以看出,各门类浮游藻的EEM荧光成分组成均具有良好的线性独立性.
 | 图 8 浮游藻EEM荧光成分组成的线性独立性分析 Fig. 8 Independence analysis for fluorescent component compositions of algae |
将浮游藻初始荧光成分比值矩阵和待测荧光成分数据矩阵输入CHEMTAX程序中,进行运算,得到识别结果.
如表 3所示,对于实验室培养的分属于4个门18个属的23种浮游藻的531个单种藻样品,门类水平上的平均识别正确率是99.1%,其中,绿藻的识别正确率为97.5%,其余藻的识别正确率为100%.
| 表 3 单种藻样品在门类水平上的识别测定结果 Table 3 Discrimination results of single-algae samples at division level |
对于实验室混合样品(表 4),优势藻的正确识别率为98.5%,其中,硅藻的识别正确率为94.4%,蓝藻为97.1%,绿藻为94.6%,裸藻为100%; 测定的相对含量范围为60.9%~80.8%,平均相对含量为69.7%. 次优势藻的正确识别率为90.5%,测定的相对含量范围为16.3%~34.2%,平均相对含量为26.4%.
| 表 4 实验室混合藻样品在门类水平上的识别测定结果 Table 4 Discrimination results of laboratory mixtures at division level |
本研究基于现有HPLC-CHEMTAX技术,以浮游藻EEM测定代替HPLC色素分析,建立了EEM-PARAFAC-CHEMTAX浮游藻群落组成荧光分析技术. 该技术能够在门类水平上(硅藻门、 蓝藻门、 绿藻门、 裸藻门)对浮游藻群落组成进行定性、 定量识别测定,将为实现现场、 快速监测湖泊浮游藻群落组成提供技术支持.
| [1] | 况琪军, 马沛明, 胡征宇, 等. 湖泊富营养化的藻类生物学评价与治理研究进展[J]. 安全与环境学报, 2005, 5 (2): 87-91. |
| [2] | 张翠, 苏荣国, 宋志杰, 等. 小波分析在湖泊常见浮游藻荧光识别测定中的应用[J]. 环境科学, 2012, 33 (10): 3314-3322. |
| [3] | Paerl H W, Huisman J. Climate change: a catalyst for global expansion of harmful cyanobacterial blooms[J]. Environmental Microbiology Reports, 2009, 1 (1): 27-37. |
| [4] | Rodriguez E, Varela M, Zapata M. Phytoplankton assemblages in the Gerlacje and Bransfield Straits (Antarctic Peninsula) determined by light microscopy and CHEMTAX analysis of HPLC pigment data[J]. Deep-Sea Research Ⅱ: Topical Studies in Oceanography, 2002, 49 (4-5): 723-747. |
| [5] | Schlüter L, Møhlenberg F, Havskum H, et al. The use of phytoplankton pigments for identifying and quantifying phytoplankton groups in coastal areas: testing the influence of light and nutrients on pigment/chlorophyll a ratios[J]. Marine Ecology Progress Series, 2000, 192: 49-63. |
| [6] | Gameiro C, Cartaxana P, Brotas V. Environmental drivers of phytoplankton distribution and composition in Tagus Estuary, Portugal[J]. Estuarine, Coastal and Shelf Science, 2007, 75 (1-2): 21-34. |
| [7] | Wright S W, Thomas D P, Marchant H J, et al. Analysis of phytoplankton of the Australian sector of the Southern Ocean: comparisons of microscopy and size frequency data with interpretations of pigment HPLC data using the 'CHEMTAX' matrix factorisation program[J]. Marine Ecology Progress Series, 1996, 144 (1-3): 285-298. |
| [8] | Havskum H, Schlüter L, Scharek R, et al. Routine quantification of phytoplankton groups-microscopy or pigment analyses[J]. Marine Ecology Progress Series, 2004, 273: 31-42. |
| [9] | Schlüter L, Lauridsen T L, Krogh G, et al. Identification and quantification of phytoplankton groups in lakes using new pigment ratios-a comparison between pigment analysis by HPLC and microscopy[J]. Freshwater Biology, 2006, 51 (8): 1474-1485. |
| [10] | Mackey M D, Mackey D J, Higgins H W, et al. CHEMTAX-a program for estimating class abundances from chemical markers: application to HPLC measurements of phytoplankton[J]. Marine Ecology Progress Series, 1996, 144 (1-3): 265-283. |
| [11] | Oldham P B, Zillioux E J, Walker J M. Spectral "fingerprinting" of phytoplankton populations by two-dimensional fluorescence and Fourier-transform-based pattern recognition[J]. Journal of Marine Research, 1985, 43 (4): 893-906. |
| [12] | Sheng G P, Yu H Q. Characterization of extracellular polymeric substances of aerobic and anaerobic sludge using three-dimensional excitation and emission matrix fluorescence spectroscopy[J]. Water Research, 2006, 40 (6): 1233-1239. |
| [13] | Wang Z W, Wu Z C, Tang S J. Characterization of dissolved organic matter in a submerged membrane bioreactor by using three-dimensional excitation and emission matrix fluorescence spectroscopy[J]. Water Research, 2009, 43 (6): 1533-1540. |
| [14] | Harshman R A. Foundations of the PARAFAC procedure: Models and conditions for an "explanatory" multimodal factor analysis[J]. UCLA Working Papers in Phonetics, 1970, 16 (1): 1-84. |
| [15] | Bro R. PARAFAC. Tutorial and applications[J]. Chemomemcs and Intelligent Laboratory Systems, 1997, 38 (2): 149-171. |
| [16] | Bro R. Exploratory study of sugar production using fluorescence spectroscopy and multi-way analysis[J]. Chemometrics and Intelligent Laboratory Systems, 1999, 46 (2): 133-147. |
| [17] | Andersen C M, Bro R. Practical aspects of PARAFAC modeling of fluorescence excitation-emission data[J]. Journal of Chemometrics, 2003, 17 (4): 200-215. |
| [18] | Stedmon C A, Markager S, Bro R. Tracing dissolved organic matter in aquatic environments using a new approach to fluorescence spectroscopy[J]. Marine Chemistry, 2003, 82 (3-4): 239-254. |
| [19] | Stedmon C A, Markager S. Resolving the variability of dissolved organic matter fluorescence in a temperate estuary and its catchment using PARAFAC analysis[J]. Limnology and Oceanography, 2005, 50 (2): 686-697. |
| [20] | 刘海龙, 吴希军, 田广军. 三维荧光光谱技术及平行因子分析法在绿茶分析及种类鉴别中的应用[J]. 中国激光, 2008, 35 (5): 685-689. |
| [21] | Lee T Y, Tsuzuki M, Takeuchi T, et al. Quantitative determination of cyanobacteria in mixed phytoplankton assemblages by an in vivo fluorimetric method[J]. Analytica Chimica Acta, 1995, 302 (1): 81-87. |
| [22] | Zhang F, Su R G, Wang X L, et al. A fluorometric method for the discrimination of harmful algal bloom species developed by wavelet analysis[J]. Journal of Experimental Marine Biology and Ecology, 2009, 368 (1): 37-43. |
| [23] | Barber C B, Dobkin D P, Huhdanpaa H. The quickhull algorithm for convex hulls[J]. Mathematical Software, 1996, 22 (4): 469-483. |
| [24] | Zepp R G, Sheldon W M, Moran M A. Dissolved organic fluorophores in southeastern US coastal waters: correction method for eliminating Rayleigh and Raman scattering peaks in excitation-emission matrices[J]. Marine Chemistry, 2004, 89 (1-4): 15-36. |
| [25] | Stedmon C A, Bro R. Characterizing dissolved organic matter fluorescence with parallel factor analysis: a tutorial[J]. Limnology and Oceanography: Methods, 2008, 6: 572-579. |
| [26] | Latasa M. Improving estimations of phytoplankton class abundances using CHEMTAX[J]. Marine Ecology Progress Series, 2007, 329: 13-21. |
| [27] | Khullar S, Michael A, Correa N, et al. Wavelet-based fMRI analysis: 3-D denoising, signal separation, and validation metrics[J]. Neurolmage, 2011, 54 (4): 2867-2884. |
| [28] | Li Y M, Anderson-Sprecher R. Facies identification from well logs: A comparison of discriminant analysis and naïve Bayes classifier[J]. Journal of Petroleum Science and Engineering, 2006, 53 (3-4): 149-157. |
| [29] | Hu Y X, Li X B. Bayes discriminant analysis method to identify risky of complicated goaf in mines and its application[J]. Transaction of Nonferrous Metals Society of China, 2012, 22 (2): 425-431. |