 2026, Vol. 47


2. 云南省山地农村生态环境演变与污染治理重点实验室,昆明 650224;
3. 国家林业和草原局云南沾益岩溶生态系统定位观测研究站,昆明 650224
2. Key Laboratory of Ecological Environment Evolution and Pollution Control in Mountainous Rural Areas of Yunnan Province, Kunming 650224, China;
3. Zhanyi Karst Ecosystem Observation and Research Station, National Forestry and Grassland Administration, Kunming 650224, China
生态脆弱区对于维护区域生态安全、应对全球气候变化和综合提升固碳能力具有重要意义[1~4]. 为此,全球范围内的生态脆弱区落地并实施了一系列大规模生态修复工程[5,6],以期不断增强生态系统生产力、改善区域固碳能力并提高其环境承载力. 尽管如此,当前生态脆弱区仍普遍出现不同程度的退化现象,如土壤侵蚀加剧、植被覆盖度下降、生物多样性丧失以及区域水资源短缺等[7~9],导致区域碳汇功能变化的速度、方向和驱动机制异常复杂. 因此,掌握生态脆弱区固碳能力,深入解析生态脆弱区固碳能力对气候变化和人类活动的响应机制,对于指导区域生态健康可持续发展和应对气候变化具有关键性作用.
目前,常用于评估区域固碳能力的指标包括总初级生产力(gross primary productivity,GPP)、净生态系统生产力(net ecosystem productivity,NEP)和植被净初级生产力(net primary productivity,NPP)[10,11],其中NPP表示植物在单位时间内通过光合作用实际固定的碳量,能直接反映植物的净碳吸收和积累,更有助于评估生态恢复和固碳潜力[12]. 随着遥感技术不断进步,大量研究尝试在区域尺度下使用NPP作为“指示剂”,以快速评估某一区域固碳能力[13]. 常用的NPP数据获取手段包括生物地球化学模型(如CASA模型和C-FIX模型等)[14,15]和遥感数据集(如MODIS-NPP数据、GLASS-NPP数据)[16]. 其中,模型计算需要大量的参数输入,且计算过程复杂,导致使用的灵活性和效率受到限制[17]. 而数据集由于其灵活快速的特点,已成为全球NPP分析的重要工具,例如基于遥感与过程耦合的MODIS NPP产品,因具备较高的覆盖性和数据连续性,在全球范围内被广泛应用[18~20],尤其是在生态脆弱区. 国内学者在青藏高原、西北干旱区、黄土高原、西南喀斯特区等典型区域使用MODIS NPP刻画了区域固碳能力变化特征,但由于不同生态脆弱区的环境禀赋差异、资源供给和生态恢复目标的独特性,各区域的NPP变化方向、速度、区域细节以及驱动因素存在显著差异[21~23]. 例如,近20 a黄土高原和青藏高原NPP变化均呈增长趋势,但其增长速度和影响因素有所不同:青藏高原NPP对气温变化较为敏感,而黄土高NPP则受降雨影响更多[24,25]. 此外,国外学者发现亚马逊雨林中气温升高有助于NPP的增加,但在东非地区气温升高反而会导致NPP的减少[26,27]. 因此,有必要针对某一特定生态脆弱区,刻画NPP时空演变规律并明晰其驱动因素,为精准评估生态脆弱区固碳能力和评估该区域生态恢复工程可持续性提供科学依据.
西南高山峡谷区位于云贵高原、青藏高原和川西高原的交汇处,气候条件复杂且水土流失严重,使得该地区成为我国典型生态脆弱区之一. 推进西南高山峡谷区生态修复可持续发展,提升该区域固碳能力和固碳效益,对于我国提高生态安全阈值和实现“双碳”目标具有重要意义. 近些年来,随着大规模生态修复工程的持续落地和全球气候变化加速,再加上农业和城镇化的进程加快,西南高山峡谷区土地利用格局和植被覆盖状况变化迅速且复杂,可能使该区域NPP发生较大变化. 然而区域现有研究大多聚焦于植被覆盖动态和土壤侵蚀防治[28~30],对NPP时空演变格局及其驱动因素分异特征的研究尚不完善. 因此,本文以西南高山峡谷区这一典型生态脆弱区为研究对象,定量刻画西南高山峡谷区NPP时空演变规律,并结合气候数据(气温、降水、风速、太阳辐射)评估该区域NPP变化对气候变化和人类活动的响应,通过明晰西南高山峡谷区植被固碳能力的转变和驱动机制,以期为生态脆弱区碳汇调节和生态治理差异化管控提供参考.
1 材料与方法 1.1 研究区概况西南高山峡谷区是我国西南地区的关键生态屏障,区域横跨一级和二级地形阶梯,覆盖云南省、四川省和西藏自治区共计88个县(市). 该区域地理环境复杂,海拔在60~7 404 m之间,沟壑纵横,地势起伏大. 复杂的地貌类型和气候条件促使区域形成了冰川、冻土、森林和草原等为一体的多元的生态系统. 因其复杂的地形和多样化的生态系统可能会增大NPP研究中的不确定性,本研究根据全国水土保持区划的三级区划将其划分为区内差异性较小,区间差异较大的4个二级分区(图 1). 藏东南高寒高山峡谷生态维护区(Ⅰ区)主要特点是海拔从西北到东南逐渐降低,地形起伏较大,以阔叶林为主. 藏东-川西高山峡谷生态维护水源涵养区(Ⅱ区)则位于较高海拔区域,全年气温较低,主要由高山草甸和针叶林构成. 滇北-川西高山峡谷蓄水保土区(Ⅲ区)拥有较为充沛的降水量和广泛的针叶林覆盖. 而滇西北高山峡谷生态维护区(Ⅳ区)位于海拔较低的区域,植被主要为灌木和针阔混交林,降水量相对较少. 综上所述,西南高山峡谷区是一个由独特的地理特征和复杂的生态系统所构成的典型的生态脆弱区.

|
图 1 研究区概况 Fig. 1 Overview of the study area |
2001~2020年植被净初级生产力(NPP)数据来源于MOD17A3HGF(V6.1)数据集,该数据集时间分辨率为1 a,空间分辨率为500 m. 本研究基于Google Earth Engine(GEE)平台,调用、裁剪并下载该数据. DEM数据来自地理空间数据云(http://www.gscloud.cn)ASTER GDEM数据集,空间分辨率为30 m. 太阳辐射数据来自GEE平台的全球陆地表面气候和水平衡月值数据集TerraClimate,空间分辨率约为4.6 km,时间分辨率为1个月. 降水、气温和风速数据来源于中国气象数据网(http://data.cma.cn)的气象站点数据,选取2001~2020年西南高山峡谷区及其周边共计56个气象站点(图 1)的资料,随后使用MATLAB软件(2016a)将各气象站点的逐日数据汇总为逐月数据. 由于研究区特殊的山地环境,本研究以DEM数据为协变量,使用ANUSPLIN软件将研究区所有气象站点数据与DEM数据融合配对,随后插值为空间栅格数据,其时间分辨率为1个月,空间分辨率为1 km. 该软件所使用的空间插值原理为薄板平滑样条法,ANUSPLIN插值法要优于反权重法等插值方法,且该方法目前已被广泛应用于多个领域气象要素的空间插值[31,32]. 最后,基于Python 2.7将得到的气象栅格数据处理为年度数据,并将NPP数据和气象栅格数据统一至WGS 1984 Albers坐标系下的1 km的空间分辨率[33].
1.3 研究方法 1.3.1 Theil-Sen趋势分析及Mann-Kendall显著性检验基于Theil-Sen趋势检验法研究逐像元NPP变化趋势. Theil-Sen趋势检验是一种稳健的非参数统计方法,离群数据或测量误差的规避能力良好,不易受异常值影响,对时序分析的抗噪性较强,适用于长时间序列的分析[34]. 公式如下:
| (1) |
式中,xi和xj为NPP时间序列中第i或j年的数据;Median表示取中值;β表示趋势度,当β > 0时表示NPP随时间呈增加趋势,当β < 0时表示NPP随时间呈减少趋势.
NPP变化趋势是否显著通过Mann-Kendall显著性检验[35]. 公式如下:
| (2) |
其中:
| (3) |
| $ Z= \begin{cases}\frac{S-1}{\sqrt{\operatorname{Var}(S)}}, & S>0, \\ 0, & S=0, \\ \frac{S+1}{\sqrt{\operatorname{Var}(S)}}, & S<0 .\end{cases} $ | (4) |
| (5) |
式中,S为检验统计量;sgn为符号函数;n为数据集合长度;Z为标准化后的检验统计量;xi和xj为样本时间序列数据;Var(S)为方差. 当
为去除气候因素的复合效应,准确判断单一气候因素对NPP的影响[36],本研究采用逐像元偏相关分析,计算西南高山峡谷区NPP与降水、太阳辐射、气温和风速的相关性. 公式如下:
| $ r_{i j, z_1, z_2, \cdots, z_n}=\frac{r_{i j, z_1, z_2, \cdots, z_{n-1}}-r_{i z_n, z_1, z_2, \cdots, z_{n-1}} \times r_{j z_n, z_1, z_2, \cdots, z_{n-1}}}{\sqrt{\left(1-r_{i z_n, z_1, z_2}^2, \cdots, z_{n-1}\right)\left(1-r_{j z_n, z_1, z_2, \cdots, z_{n-1}}^2\right)}} $ | (6) |
式中,
多元回归残差分析可以系统性地剥离气候变化对植被动态的影响,从而准确提取人类活动驱动的NPP变化信号[37]. 该方法无需引入复杂的环境背景参数,显著降低了数据获取与模型构建的难度. 其核心优势在于残差项直接表征了人类活动对NPP的空间异质性影响模式. 大量实证研究表明,该方法在生态学领域展现出显著的理论严谨性与实践应用价值,特别是在大尺度、长时序的植被动态监测中具有独特的优势[38,39].
本研究以NPP时间序列数据作为因变量,降水、太阳辐射、气温和风速作为自变量,建立多元线性回模型,计算生成NPP预测值(NPPpredicted)用来表示气候变化对NPP的影响. 通过计算预测值与遥感影像观测值(NPPobs)之间的差值得到残差(NPPRE),用来表示人类活动的影响[40].
| (7) |
| (8) |
式中,NPPpredicted、NPPobs和NPPRE分别表示NPP基于线性回归模型的预测值、基于遥感影像的观测值和残差;T、P、W和R分别为降水、太阳辐射、气温和风速;a、b、c和d为偏相关系数;e为残差. 根据NPPpredicted、NPPobs和NPPRE变化的斜率θ结合预定义的判别规则(表 1)划分驱动类型:在每个像元尺度上,若NPPpredicted的斜率绝对值超过NPPRE斜率的10%以上,则判定为单因子驱动[41];若差值小于10%,则判定为双因子共同驱动. 同时根据观测值变化方向进行驱动效应判别,当观测值大于0时判定为驱动增加,小于0时判定为驱动减少.
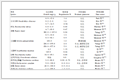
|
表 1 植被NPP变化驱动类型判别1) Table 1 Determination of the driving types of vegetation NPP changes |
2 结果与分析 2.1 NPP时空变化规律分析
2001~2020年西南高山峡谷区NPP(以C计,下同)多年均值约为484.9 g·(m2·a)-1,各分区多年NPP均值排序为:Ⅳ区[853.1 g·(m2·a)-1] > Ⅲ区[821.0 g·(m2·a)-1] > Ⅰ区[569.0 g·(m2·a)-1] > Ⅱ区[304.2 g·(m2·a)-1]. 其中,Ⅱ区NPP显著低于其他分区,可能是由于该区域海拔和纬度较高,植被以高山草甸植被为主,植被生长季较短,植被覆盖度较低,导致NPP本底值较低[42]. 此外,区域内水土流失问题严重,进一步抑制了植被的生长和生产力[43]. 相比之下,Ⅳ区的NPP较高,这主要得益于该地区植被类型丰富且和植被覆盖度较高,因此该区域拥有较高的植被生产力[44]. 本研究期间,西南高山峡谷区NPP整体呈不显著减少趋势[-0.1 g·(m2·a)-1,P=0.92,图 2(d)]. Ⅰ区呈现显著减少趋势[-3.1 g·(m2·a)-1,P < 0.05,图 2(f)]. Ⅱ区呈不显著增加[0.7 g·(m2·a)-1,P=0.287,图 2(b)],Ⅲ区呈显著增加趋势[3.4 g·(m2·a)-1,P < 0.05,图 2(c)]. Ⅳ区呈现不显著减少[-0.4 g·(m2·a)-1,P=0.72,图 2(e)].

|
图 2 西南高山峡谷区NPP的变化率和4个分区NPP年际变化趋势 Fig. 2 Variation rate of NPP and the interannual variation trend of NPP in four subregions in the Southwest Alpine Canyon Region of China |
空间上,西南高山峡谷区NPP变化速率呈“南高北低、东高西低”的格局[图 3(a)],这可能是由于区域横跨一级和二级地形阶梯,下垫面条件差异较大,区域气候条件和植被类型的不同导致了变化速度的不均衡. 西南高山峡谷区约有81.6%的区域NPP变化不显著[图 3(b)]. NPP变化呈显著增加和极显著增加的区域分别约占西南高山峡谷区的6.4%和5.2%,其中Ⅲ区比例最大,分别为13.6%和29.6%,主要分布在丽江市、攀枝花市和凉山彝族自治州. NPP显著减少和极显著减少的区域占比分别约占研究区域的4.5%和2.4%,其中Ⅰ区减少所占比例最大,集中分布在山南市和林芝市的喜马拉雅山南麓地区.

|
图 3 西南高山峡谷区NPP变化显著性和4个分区不同变化显著性占比 Fig. 3 Change significance of NPP in the Southwest Alpine Canyon Region of China and the proportion of different change significance in four subregions |
本研究期间,西南高山峡谷区降水量呈不显著增加趋势[0.84 mm·a-1,P=0.73,图 4(a)],增加和减少趋势分别约占研究区域的43.2%和56.8%,增加趋势主要分布在Ⅱ区的东北部和Ⅲ区. 太阳辐射呈不显著减少趋势[-0.01 W·(m2·a)-1,P=0.92,图 4(b)],减少趋势主要分布在Ⅰ区和Ⅱ区交界处. 气温呈不显著增加趋势[0.01 ℃·a-1,P=0.24,图 4(c)],增加趋势在全区广泛分布,减少趋势仅在Ⅰ区西南部和Ⅱ区东北部. 风速呈显著增加趋势[0.01 m·(s·a)-1,P < 0.05,图 4(d)],大部分区域的风速均呈增加趋势(84.6%),而减少趋势占比仅为15.4%,主要集中于Ⅰ区的东西两端和Ⅳ区南部.

|
图 4 西南高山峡谷区降水、太阳辐射、气温和风速变化趋势 Fig. 4 Variation trend of annual rainfall, average relative humidity, average temperature, and average wind speed in the Southwest Alpine Canyon Region of China |
NPP变化与降水量变化主要呈负相关关系[图 5(a),约占研究区总面积的62.9%],其中显著负相关和极显著负相关关系分别约占研究区总面积的7.0%和2.5%,主要分布在那曲市、甘孜藏族自治州中部以及四区横断山脉附近. NPP变化与太阳辐射变化主要以正相关关系为主[图 5(b),约占研究区总面积的占65.1%],其中显著正相关和极显著正相关关系分别约占研究区总面积的8.6%和4.0%,主要集中在阿坝藏族羌族自治州、林芝市中部以及凉山彝族自治州北部. NPP变化与气温变化主要呈正相关关系[图 5(c),约占研究区总面积的78.2%],其中显著正相关和极显著正相关关系分别约占研究区总面积的18.0%和6.1%,主要分布在Ⅰ区中部和Ⅱ区东西两侧的高海拔地区. NPP变化与风速变化主要以负相关关系为主[图 5(d),约占研究区总面积的56.6%],其中显著负相关和极显著负相关分别约占研究区总面积6.6%和2.4%,主要分布在昌都市和甘孜藏族自治州. 总体而言,西南高山峡谷区NPP变化对气候变化的响应存在明显的空间异质性,NPP变化气候因子的相关性大小呈现为气温 > 太阳辐射 > 降雨 > 风速的规律.

|
图 5 西南高山峡谷区NPP与降水、太阳辐射、气温和风速的偏相关性 Fig. 5 Partial correlation between NPP and annual rainfall, mean relative humidity, mean temperature, and mean wind speed in the Southwest Alpine Canyon Region of China |
本研究期间,气候变化对西南高山峡谷区NPP变化起主导作用(图 6,面积占比约为50.1%). 其中,气候变化驱动区域NPP呈增加趋势的面积约占总面积的32.7%,主要集中分布于Ⅰ区的喜马拉雅山脉段;而其驱动区域NPP呈减少趋势的面积约占总面积的17.4%,主要集中于主要分布于Ⅰ区的喜马拉雅山南麓和Ⅱ区的昌都市. 此外,人类活动对西南高山峡谷区NPP变化的影响面积占比约为44.0%. 其中,人类活动变化驱动区域NPP呈增加趋势的面积约占总面积的24.7%,主要集中分布于Ⅱ区的阿坝藏族羌族自治州和那曲市,以及Ⅲ区的丽江市和攀枝花市,由于区域人口相对较少城镇化进程较慢,并且随着天然林保护工程、草原生态保护工程和退耕还林还草工程等项目的实施,通过多种手段如恢复森林、草原和湿地、限制过度开发以及实施生态补偿机制,促进了区域的生态恢复,显著提高了NPP,尤其丽江地区植被改善面积占比达到了44.7%[45];而其驱动区域NPP呈减少趋势的面积约占总面积的19.3%,主要集中出现在Ⅰ区的林芝市和Ⅳ区的云南地区,这是因为区域内土地利用的大规模转变,有研究表明2005~2020年期间云南省建设用地的动态变化度高达7.9%[46],这样大规模的土地动态变化所造成的森林砍伐与植被破坏,直接减少了当地的森林覆盖度,导致了区域NPP的显著下降. 气候变化与人类活动对NPP变化的双重驱动作用在研究区较为有限,受其影响的NPP增长和减少区域面积占比仅为5.8%和0.1%. 进一步而言,区域NPP的增加主要归因于气候因素,而NPP的减少则主要由人类活动所致.

|
图 6 西南高山峡谷区NPP变化驱动类型和4个分区驱动类型占比 Fig. 6 Driving factors of NPP change and the proportion of four regional driving factors in the Southwest Alpine Canyon Region of China |
2001~2020年西南高山峡谷区年均NPP均呈下降趋势,其中Ⅰ区的NPP下降速度和趋势最为显著,且呈现明显空间聚集性,主要集中在喜马拉雅南麓(图 2),该区域与太阳辐射的增加区域具有较高的重叠度[47]. 一般而言,太阳辐射的增加会促进植物生长,从而导致NPP增加,但该区域趋势却相反,其原因可能是由于该区域快速的城镇化和林芝地区养殖业迅速发展,导致大规模的土地利用变化,致使植被覆盖降低. 人类活动所带来的负面影响超出了太阳辐射增加对作物生产力的促进作用[48,49],从而使得该区域NPP快速下降. 相比之下,Ⅱ区和Ⅲ区年均NPP呈现上升趋势,尤以Ⅲ区最为显著,这可能得益于川西地区所实施的天然林保护工程和退耕还林还草工程,以及2015年之后出台的矿山修复生态政策[32],进一步提高了区域植被覆盖,从而提升了植被生产力. 值得注意的是,在2010年Ⅲ区和Ⅳ区NPP发生了大幅度下降,其主要原因是2010年我国西南地区发生特大旱灾[30],影响了植被正常代谢活动,抑制了植被光合作用和养分吸收,最终导致Ⅲ区和Ⅳ区植被NPP大幅度下降.
3.2 气候变化对NPP时空演变的驱动分析气温是西南高山峡谷区NPP变化最为关键的驱动因素,且其与NPP之间的显著和极显著正相关主要分布在气温0~6 ℃的低温地区[图 5(c)和图 7(c)]. 这可能是因为低温地区的海拔较高,其分布的高山草甸生态系统对气温变化敏感,小幅增温可能在一定程度上解除了高山草甸植被生长的低温限制,提高了土壤中有机物的活性和植被的光合作用速率[19,50~52],导致植被显著变绿,从而使区域NPP呈增加趋势.

|
图 7 2001~2020年西南高山峡谷区降水、太阳辐射、气温和风速均值空间分布 Fig. 7 Spatial distribution of mean precipitation, solar radiation, temperature, and wind speed in the mountainous and canyon areas of the Southwest Alpine Canyon Region of China from 2001 to 2020 |
以往研究表明,降雨与NPP通常呈正相关关系,即降雨增加会促进NPP的增加. 然而,本研究结果表明,西南高山峡谷区降水与NPP呈负相关[图 5(a)],即随着降雨的增加NPP反而减少,尤其是在甘孜藏族自治州附近,这一现象可能源于该地区多年平均降水量相对充沛[多年平均降水量在600~1 200 mm之间,图 7(a)],且植被类型主要为高山草甸,在降雨充沛的条件下,高山草甸植被可能因水分过剩和土壤饱和提前进入休眠期[53]. 同时,区域内高差较大,极易发生水力侵蚀,随着降雨的增加沟蚀和面蚀逐渐加剧,导致大量土壤迁移,区域内土壤肥力降低,破坏了植被生长环境,进一步抑制了区域植被生产力[54]. 太阳辐射是影响西南高山峡谷区NPP变化的一个重要因素,且二者主要呈正相关关系,这与赖金林等[30]的研究结果一致. 太阳辐射与NPP之间的显著和极显著正相关关系集中在平均太阳辐射较低、太阳辐射呈增加趋势的区域[图 5(b)和图 7(b)],即集中于区域太阳辐射禀赋较差的地区(如青藏高原),主要因为太阳辐射的增加可能提高了植被有效光合速率,促进了地上生物量的有效积累,从而使得区域NPP呈增加趋势[55].
3.3 人类活动对NPP时空演变的影响分析以往研究表明,人类活动对西南地区NPP变化的影响愈发重要[4,56]. 本研究中,人类活动主导的NPP增加趋势主要分布在自然禀赋较差的地区. 随着区域生活方式的转变以及坡耕地整治、火灾综合防控等政策不断推进,曾经的“刀耕火种”逐渐消失[12],人类活动对植被的直接破坏减少,显著促进了当地林草植被的天然更新与重建,进而使NPP呈增加趋势. 此外,人类活动主导的NPP减少趋势集中在西南高山峡谷区内人口密度较大、经济活动频繁的城市地区,以上地区由于城市扩张和工业发展的需要,区域土地利用快速迭代(如林地和草地转变为建设用地)[57],对区域植被造成较大扰动,植被数量显著减少和区域景观格局破碎化加重,可能直接造成了区域NPP减少. 此外,Ma等[58]研究表明,密集的人类活动和大气CO2浓度增加所导致的微气候变化,也会对区域植被的养分吸收和光合效率产生影响,进而导致植被NPP的减少. 因此,未来西南高山峡谷区应统筹协调人类与植被之间的关系,采取差异化的管理策略,一方面应继续巩固生态修复工程成果,重点提升森林质量和生态系统稳定性,另一方面应建立完善的生态补偿机制,严格控制开发强度,实施基于适应性原则的管理措施,缓解多重环境胁迫的叠加影响.
3.4 不确定性分析本研究仍存在一些局限与不足. 首先,本研究使用了ANUSPLIN软件以实现气象站点数据空间插值,尽管在插值过程已尽量涵盖了插值区域(西南高山峡谷区)以外的气象站点,但由于缺少境外站点数据,区域边缘系统误差仍有可能增加了气象栅格数据的不确定性. 其次,本研究使用了多元回归残差分析以定量剥离人为活动对NPP的影响,尽管残差分析作为多元线性模型可能会在一定程度上放大人类活动的影响,但在人类活动难以量化的背景下,其仍然提供了一个有价值的框架,且已被广泛应用于阐明人类活动对某因变量(如水分利用效率、NDVI和NPP等)的影响[59~61],为理解人类活动与环境之间的复杂关系提供了有力支持. 最后,有研究表明,CO2浓度增加和氮沉降等因素可以通过改变植被光合速率、土壤养分供应和微生物群落结构等方面,影响生态系统碳循环过程,进而影响NPP变化,并且可能起到决定性作用[62,63],但考虑到数据可获得性、数据时间序列长短以及栅格数据分辨率一致性等问题,本研究未考虑上述因素对西南高山峡谷区NPP变化的影响,后续应当结合碳通量观测数据与生态模型,进一步解耦西南高山峡谷区NPP变化对多重因素的响应,以期更加全面地理解气候变化和人类活动对西南高山峡谷区生态系统碳循环的影响.
4 结论(1)2001~2020年西南高山峡谷区NPP呈不显著减少趋势,变化率表现出明显的空间异质性,整体上呈“南高北低、东高西低”的分布格局. NPP呈显著增加和极显著增加的区域集中分布在Ⅲ区的凉山彝族自治州和丽江市;显著减少和极显著减少的区域则集中分布在Ⅰ区的喜马拉雅山南麓.
(2)西南高山峡谷区对不同气候因素的响应有所不同,总体上与气温和太阳辐射呈正相关,与降水和风速呈负相关,NPP与气温的相关性高于其他气候因素,说明相较于其他气候因素,区域植被NPP对气温的变化更加敏感.
(3)西南高山峡谷区NPP变化主要受气候变化主导,受其影响的NPP增加和减少趋势分别占研究区面积的32.7%和17.4%,主要分布在Ⅰ区和Ⅱ区,其中Ⅱ区是气候变化促进NPP增加最显著的区域. 人类活动对区域NPP变化的影响亦不可小觑,主导NPP增加和减少趋势的部分分别占研究区面积的24.7%和19.3%,主要分布在Ⅲ区和Ⅳ区,其中Ⅳ区是人类活动导致NPP减少最突出的区域.
| [1] | 中华人民共和国生态环境部. 关于印发《全国生态脆弱区保护规划纲要》的通知[EB/OL]. https://www.mee.gov.cn/gkml/hbb/bwj/200910/t20091022_174613.htm, 2008-09-27. |
| [2] | Wang S, Wang Z C, Zhuang Q L, et al. Assessing the carbon sequestration potential and identifying influential factors of cultivated soils in Northeast China[J]. Geoderma Regional, 2023, 33. DOI:10.1016/j.geodrs.2023.e00655 |
| [3] |
高亚培, 刘玮, 李成英, 等. 青藏高寒区"三生空间"演变及碳排放多情景模拟: 以青海省为例[J]. 环境科学, 2025, 46(8): 4923-4933. Gao Y P, Liu W, Li C Y, et al. Evolution of production-living-ecological spaces and multi-scenario simulation of carbon emissions in the Qinghai-Tibet Plateau vulnerable region: a case study of Qinghai Province, China[J]. Environmental Science, 2025, 46(8): 4923-4933. |
| [4] |
张艺菲, 张俊玲. 气候变化和人类活动对云贵高原植被净初级生产力的影响[J]. 环境科学, 2025, 46(8): 5217-5228. Zhang Y F, Zhang J L. Impact of climate change and human activities on net primary productivity of vegetation in the Yunnan-Guizhou Plateau[J]. Environmental Science, 2025, 46(8): 5217-5228. DOI:10.13227/j.hjkx.202407164 |
| [5] |
张心茹, 曹茜, 季舒平, 等. 气候变化和人类活动对黄河三角洲植被动态变化的影响[J]. 环境科学学报, 2022, 42(1): 56-69. Zhang X R, Cao Q, Ji S P, et al. Quantifying the contributions of climate change and human activities to vegetation dynamic changes in the Yellow River Delta[J]. Acta Scientiae Circumstantiae, 2022, 42(1): 56-69. |
| [6] |
刘崇刚, 孙伟, 张落成. 长江三角洲碳排放与植被覆盖耦合协调时空格局及影响因素分析[J]. 地理科学, 2023, 43(1): 142-151. Liu C G, Sun W, Zhang L C. Spatio-temporal pattern of coupling coordination degree between carbon emissions and vegetation cover and its influencing factors of the Yangtze River Delta[J]. Scientia Geographica Sinica, 2023, 43(1): 142-151. |
| [7] | Huang G, Xu Z H, Qu X, et al. Critical climate issues toward carbon neutrality targets[J]. Fundamental Research, 2022, 2(3): 396-400. DOI:10.1016/j.fmre.2022.02.011 |
| [8] | Zhang Z M, Niu B, Zhang X Z, et al. Climate and grazing effects on productivity allocation in alpine grasslands of the Qinghai-Tibet Plateau[J]. Agricultural and Forest Meteorology, 2025, 372. DOI:10.1016/j.agrformet.2025.110720 |
| [9] | Wu T H, Ma W S, Wu X D, et al. Weakening of carbon sink on the Qinghai–Tibet Plateau[J]. Geoderma, 2022, 412. DOI:10.1016/j.geoderma.2022.115707 |
| [10] | Zhang Y H, Hu Z W, Wang J Z, et al. Temporal upscaling of MODIS instantaneous FAPAR improves forest gross primary productivity (GPP) simulation[J]. International Journal of Applied Earth Observation and Geoinformation, 2023, 121. DOI:10.1016/j.jag.2023.103360 |
| [11] | Lyu J Q, Fu X H, Lu C, et al. Quantitative assessment of spatiotemporal dynamics in vegetation NPP, NEP and carbon sink capacity in the Weihe River Basin from 2001 to 2020[J]. Journal of Cleaner Production, 2023, 428. DOI:10.1016/j.jclepro.2023.139384 |
| [12] | Xu Y, Lu Y G, Zou B, et al. Unraveling the enigma of NPP variation in Chinese vegetation ecosystems: the interplay of climate change and land use change[J]. Science of the Total Environment, 2024, 912. DOI:10.1016/j.scitotenv.2023.169023 |
| [13] |
邵嘉豪, 李晶, 闫星光, 等. 基于地理探测器的山西省2000~2020年NPP时空变化特征及驱动力分析[J]. 环境科学, 2023, 44(1): 312-322. Shao J H, Li J, Yan X G, et al. Analysis of spatiotemporal variation characteristics and driving forces of NPP in Shanxi Province from 2000 to 2020 based on Geodetector[J]. Environmental Science, 2023, 44(1): 312-322. DOI:10.13227/j.hjkx.202203010 |
| [14] | Huang Y T, Wang F, Zhang L J, et al. Changes and net ecosystem productivity of terrestrial ecosystems and their influencing factors in China from 2000 to 2019[J]. Frontiers in Plant Science, 2023, 14. DOI:10.3389/fpls.2023.1120064 |
| [15] |
刘贤赵, 罗政英, 肖海. 长株潭绿心区植被月NPP的时空变化及对气候地形因子的响应[J]. 环境科学, 2024, 45(12): 6888-6898. Liu X Z, Luo Z Y, Xiao H. Spatio-temporal variation in monthly vegetation NPP and its responses to climate and terrain factors in Chang-Zhu-Tan Green Heart Area[J]. Environmental Science, 2024, 45(12): 6888-6898. DOI:10.13227/j.hjkx.202203010 |
| [16] | Li W W, Zhou J L, Xu Z Y, et al. Climate impact greater on vegetation NPP but human enhance benefits after the Grain for Green Program in Loess Plateau[J]. Ecological Indicators, 2023, 157. DOI:10.1016/j.ecolind.2023.111201 |
| [17] |
武爱彬, 陈辅国, 尤海舟, 等. 京津冀地区植被净初级生产力时空变化特征及影响因素分析[J]. 环境科学, 2025, 46(11): 6957-6968. Wu A B, Chen F G, You H Z, et al. Characterization of spatial and temporal changes in net primary productivity of vegetation in Beijing-Tianjin-Hebei Region and analysis of influencing factors[J]. Environmental Science, 2025, 46(11): 6957-6968. DOI:10.13227/j.hjkx.202411179 |
| [18] |
罗瑞, 于欢, 张旺, 等. 四川省植被净初级生产力时空格局演变及驱动力分析[J]. 环境科学, 2026, 47(4): 2329-2342. Luo R, Yu H, Zhang W, et al. Temporal and spatial pattern changes of vegetation net primary productivity in Sichuan Province and the analysis of its driving factors[J]. Environmental Science, 2026, 47(4): 2329-2342. DOI:10.13227/j.hjkx.202503165 |
| [19] | Yu Z W, Miao L J, Liu Q, et al. Uncovering the impact of multiple determinants on vegetation NPP in Inner Mongolia[J]. Global Ecology and Conservation, 2024, 56. DOI:10.1016/j.gecco.2024.e03341 |
| [20] |
李彬, 曹广超, 王苑, 等. 2001~2022年黄河流域青海段植被NPP时空变化及其对气候的响应[J]. 环境科学, 2026, 47(1): 348-359. Li B, Cao G C, Wang Y, et al. Spatial and temporal changes of vegetation NPP and its response to climate in the Qinghai Section of the Yellow River Basin from 2001 to 2022[J]. Environmental Science, 2026, 47(1): 348-359. DOI:10.13227/j.hjkx.202412233 |
| [21] | Wang Y R, Cai L P, Liu G L, et al. Spatiotemporal variation in net primary productivity and factor detection in arid and semiarid regions of China[J]. Ecological Frontiers, 2025, 45(5): 1419-1428. DOI:10.1016/j.ecofro.2025.06.001 |
| [22] |
靖娟利, 孙佳荟, 赵婷, 等. 西南地区植被NPP对多尺度气象干旱的响应[J]. 水土保持学报, 2024, 38(3): 335-344. Jing J L, Sun J H, Zhao T, et al. Response of vegetation NPP to multiscale meteorological drought in southwest China[J]. Journal of Soil and Water Conservation, 2024, 38(3): 335-344. |
| [23] | Ma B X, Jing J L, Liu B, et al. Assessing the contribution of human activities and climate change to the dynamics of NPP in ecologically fragile regions[J]. Global Ecology and Conservation, 2023, 42. DOI:10.1016/j.gecco.2023.e02393 |
| [24] |
刘杰, 汲玉河, 周广胜, 等. 2000—2020年青藏高原植被净初级生产力时空变化及其气候驱动作用[J]. 应用生态学报, 2022, 33(6): 1533-1538. Liu J, Ji Y H, Zhou G S, et al. Temporal and spatial variations of net primary productivity (NPP) and its climate driving effect in the Qinghai-Tibet Plateau, China from 2000 to 2020[J]. Chinese Journal of Applied Ecology, 2022, 33(6): 1533-1538. |
| [25] |
蔡东东, 党小虎, 赵尚林, 等. 1990—2020年黄土高原农牧交错带草地NPP时空变化及其驱动机制[J]. 水土保持研究, 2025, 32(6): 236-244, 257. Cai D D, Dang X H, Zhao S L, et al. Spatiotemporal variation and driving mechanisms of grassland NPP in farming-pastoral ecotone of the Loess Plateau from 1990 to 2020[J]. Research of Soil and Water Conservation, 2025, 32(6): 236-244, 257. |
| [26] | Li L Y, Zeng Z Z, Zhang G, et al. Exploring the individualized effect of climatic drivers on MODIS net primary productivity through an explainable machine learning framework[J]. Remote Sensing, 2022, 14(17). DOI:10.3390/rs14174401 |
| [27] | Xu M H, Zhang Z K, Wang Y, et al. Quantifying the contributions of climatic and human factors to vegetation net primary productivity dynamics in East Africa[J]. Frontiers in Forests and Global Change, 2024, 6. DOI:10.3389/ffgc.2023.1332631 |
| [28] | Tian Q L, Zhang X P, He J, et al. Potential risk of soil erosion on the Tibetan Plateau during 1990–2020: Impact of climate change and human activities[J]. Ecological Indicators, 2023, 154. DOI:10.1016/j.ecolind.2023.110669 |
| [29] |
丁琳, 黄婷婷, 秦伟, 等. 西南高山峡谷区土壤侵蚀空间分异特征[J]. 泥沙研究, 2023, 48(6): 51-58, 66. Ding L, Huang T T, Qin W, et al. Spatial variation of soil erosion in southwest alpine canyon area[J]. Journal of Sediment Research, 2023, 48(6): 51-58, 66. |
| [30] |
赖金林, 齐实, 廖瑞恩, 等. 2000—2019年西南高山峡谷区植被变化对气候变化和人类活动的响应[J]. 农业工程学报, 2023, 39(14): 155-163. Lai J L, Qi S, Liao R E, et al. Vegetation change responses to climate change and human activities in southwest alpine canyon areas of China from 2000 to 2019[J]. Transactions of the Chinese Society of Agricultural Engineering, 2023, 39(14): 155-163. |
| [31] |
王海彬, 刘家宏, 刘希胜, 等. 基于ANUSPLIN插值法的青海湖流域数字流域模型研究[J]. 水资源保护, 2024, 40(4): 82-91. Wang H B, Liu J H, Liu X S, et al. Study on digital watershed model of the Qinghai Lake Basin based on ANUSPLIN interpolation method[J]. Water Resources Protection, 2024, 40(4): 82-91. |
| [32] | Cao S P, Zhang L F, He Y, et al. Effects and contributions of meteorological drought on agricultural drought under different climatic zones and vegetation types in Northwest China[J]. Science of the Total Environment, 2022, 821. DOI:10.1016/j.scitotenv.2022.153270 |
| [33] |
张文奇, 赵媛媛, 赖宗锐, 等. 基于ANUSPLIN模型的柴达木盆地2000—2019年降水时空格局[J]. 高原气象, 2024, 43(3): 737-748. Zhang W Q, Zhao Y Y, Lai Z R, et al. Spatiotemporal Patterns of Precipitation in Qaidam Basin from 2000 to 2019 Base on the ANUSPLIN Model[J]. Plateau Meteorology, 2024, 43(3): 737-748. |
| [34] |
马晓倩, 钟瑞森, 吴彬, 等. 塔里木河干流植被NDVI时空动态变化及影响因素探测[J]. 环境科学, 2025, 46(9): 5813-5824. Ma X Q, Zhong R S, Wu B, et al. Spatiotemporal dynamics of NDVI in the Tarim River Mainstream and its influencing factors[J]. Environmental Science, 2025, 46(9): 5813-5824. DOI:10.13227/j.hjkx.202409115 |
| [35] |
魏晓帅, 高永龙, 范雅倩, 等. 北京植被净初级生产力对物候变化的响应[J]. 农业工程学报, 2022, 38(18): 167-175. Wei X S, Gao Y L, Fan Y Q, et al. Responses of the net primary productivity of vegetation to phenological changes in Beijing of China[J]. Transactions of the Chinese Society of Agricultural Engineering, 2022, 38(18): 167-175. |
| [36] |
王永锋, 靖娟利, 刘海红, 等. 顾及时滞和累积效应的西南喀斯特地区植被变化归因分析[J]. 环境科学, 2025, 46(7): 4382-4391. Wang Y F, Jing J L, Liu H H, et al. Attribution analysis of vegetation variation in the karst region of southwest China considering time lag and accumulation effects[J]. Environmental Science, 2025, 46(7): 4382-4391. DOI:10.13227/j.hjkx.202406168 |
| [37] |
刘芃凯, 饶良懿, 李思源. 海河流域植被时空演化及其对气候变化和人类活动的响应[J]. 环境科学, 2026, 47(3): 1744-1753. Liu P K, Rao L Y, Li S Y. Spatio-temporal evolution of vegetation and its response to climate change and human activities in Haihe River Basin[J]. Environmental Science, 2026, 47(3): 1744-1753. DOI:10.13227/j.hjkx.202406289 |
| [38] | Hou Q Q, Ji Z X, Yang H, et al. Impacts of climate change and human activities on different degraded grassland based on NDVI[J]. Scientific Reports, 2022, 12(1). DOI:10.1038/s41598-022-19943-6 |
| [39] | Ren Z G, Tian Z H, Wei H T, et al. Spatiotemporal evolution and driving mechanisms of vegetation in the Yellow River Basin, China during 2000–2020[J]. Ecological Indicators, 2022, 138. DOI:10.1016/j.ecolind.2022.108832 |
| [40] |
余玉洋, 宋丰艺, 张世杰. 2000—2020年河南省NDVI时空变化及其驱动因素定量分析[J]. 生态环境学报, 2022, 31(10): 1939-1950. Yu Y Y, Song F Y, Zhang S J. Quantitative analysis of temporal and spatial changes of NDVI and its driving factors in Henan province from 2000 to 2020[J]. Ecology and Environmental Sciences, 2022, 31(10): 1939-1950. |
| [41] | Li Y R, Chen P, Niu Y, et al. Dynamics and attributions of ecosystem water yields in China from 2001 to 2020[J]. Ecological Indicators, 2022, 143. DOI:10.1016/j.ecolind.2022.109373 |
| [42] | Zhou X R, Chen X K, Yang K, et al. Vegetation restoration in an alpine meadow: insights from soil microbial communities and resource limitation across soil depth[J]. Journal of Environmental Management, 2024, 360. DOI:10.1016/j.jenvman.2024.121129 |
| [43] | Kanianska R, Kizeková M, Jančová L, et al. Effect of soil erosion on soil and plant properties with a consequence on related ecosystem services[J]. Sustainability, 2024, 16(16). DOI:10.3390/su16167037 |
| [44] |
徐勇, 郑志威, 孟禹弛, 等. 西南地区不同类型植被NPP时空演变及影响因素探究[J]. 环境科学, 2024, 45(1): 262-274. Xu Y, Zheng Z W, Meng Y C, et al. Spatio-temporal variation in net primary productivity of different vegetation types and its influencing factors exploration in Southwest China[J]. Environmental Science, 2024, 45(1): 262-274. DOI:10.13227/j.hjkx.202302121 |
| [45] |
李见会, 何淑勤, 易海燕, 等. 1990—2020年攀枝花市植被覆盖度时空变化及其驱动因素[J]. 水土保持学报, 2025, 39(1): 368-376. Li J H, He S Q, Yi H Y, et al. Study on the spatial and temporal changes of the vegetation cover and the driving factors in Panzhihua City from 1990 to 2020[J]. Journal of Soil and Water Conservation, 2025, 39(1): 368-376. |
| [46] |
李志英, 朱晓珊, 杨丽, 等. 云南省土地利用碳排放时空演变特征及影响因素[J]. 水土保持通报, 2023, 43(5): 297-303, 311. Li Z Y, Zhu X S, Yang L, et al. Spatial-temporal evolution characteristics and influencing factors of carbon emissions in Yunnan Province based on land use changes[J]. Bulletin of Soil and Water Conservation, 2023, 43(5): 297-303, 311. |
| [47] |
吕金霞, 赵文武. 青藏高原植被总初级生产力变化及其影响因素[J]. 生态学报, 2025, 45(14): 6934-6947. Lü J X, Zhao W W. Variations of vegetation gross primary productivity and its driving factors in Tibetan Plateau[J]. Acta Ecologica Sinica, 2025, 45(14): 6934-6947. |
| [48] |
凡晚晴, 吴华, 樊风雷. 近20年来西藏地区NPP时空变化及影响因素[J]. 水土保持通报, 2022, 42(6): 378-386. Fan W Q, Wu H, Fan F L. Spatial-temporal variation of net primary productivity and its influencing factors in Tibet over past 20 years[J]. Bulletin of Soil and Water Conservation, 2022, 42(6): 378-386. |
| [49] | Liu Z J, Jiao L M, Lian X H. Impacts of increasing compound hot-dry events on vegetation under the warming-wetting trend in Northwest China[J]. Geography and Sustainability, 2025, 6(2). DOI:10.1016/j.geosus.2024.08.003 |
| [50] |
汪晓珍, 呼海涛, 吴建召, 等. 2000—2020年陕西省陆地生态系统NPP时空变化与潜力[J]. 水土保持学报, 2024, 38(3): 325-334. Wang X Z, Hu H T, Wu J Z, et al. Spatial and temporal variation and potential of NPP in terrestrial ecosystems in Shaanxi province from 2000 to 2020[J]. Journal of Soil and Water Conservation, 2024, 38(3): 325-334. |
| [51] | Xi Z L, Chen G Z, Xing Y Q, et al. Spatial and temporal variation of vegetation NPP and analysis of influencing factors in Heilongjiang Province, China[J]. Ecological Indicators, 2023, 154. DOI:10.1016/j.ecolind.2023.110798 |
| [52] | Zhang L H, Shen M G, Jiang N, et al. Spatial variations in the response of spring onset of photosynthesis of evergreen vegetation to climate factors across the Tibetan Plateau: the roles of interactions between temperature, precipitation, and solar radiation[J]. Agricultural and Forest Meteorology, 2023, 335. DOI:10.1016/j.agrformet.2023.109440 |
| [53] | Feng H P, Kang P, Deng Z C. et al The impact of climate change and human activities to vegetation carbon sequestration variation in Sichuan and Chongqing[J]. Environmental Research, 2023, 238. DOI:10.1016/j.envres.2023.117138 |
| [54] |
杨文博, 刘娜, 蔡强国, 等. 水力侵蚀对土壤碳循环及土壤微生物多样性影响的研究进展[J]. 水土保持学报, 2024, 38(1): 14-21. Yang W B, Liu N, Cai Q G, et al. Research progress on the effects of hydraulic erosion on soil carbon cycle and soil microbial diversity[J]. Journal of Soil and Water Conservation, 2024, 38(1): 14-21. |
| [55] | Semeraro S, Kipf P, Le Bayon R C, et al. Solar radiation explains litter degradation along alpine elevation gradients better than other climatic or edaphic parameters[J]. Frontiers in Microbiology, 2023, 14. DOI:10.3389/fmicb.2023.1152187 |
| [56] |
徐勇, 王丽佳, 杨华. 青藏高原土地资源人类活动适宜性评价方法及实证应用[J]. 地理学报, 2022, 77(7): 1615-1633. Xu Y, Wang L J, Yang H. Evaluation method and empirical application of human activity suitability of land resources in Qinghai-Tibet Plateau[J]. Acta Geographica Sinica, 2022, 77(7): 1615-1633. |
| [57] | He Y L, Lin C, Wu C Y, et al. The urban hierarchy and agglomeration effects influence the response of NPP to climate change and human activities[J]. Global Ecology and Conservation, 2024, 51. DOI:10.1016/j.gecco.2024.e02904 |
| [58] | Ma Z R, Wu J J, Yang H C, et al. Assessment of vegetation net primary productivity variation and influencing factors in the Beijing-Tianjin-Hebei region[J]. Journal of Environmental Management, 2024, 365. DOI:10.1016/j.jenvman.2024.121490 |
| [59] | Xue H Z, Chen Y P, Dong G T, et al. Quantitative analysis of spatiotemporal changes and driving forces of vegetation net primary productivity (NPP) in the Qimeng region of Inner Mongolia[J]. Ecological Indicators, 2023, 154. DOI:10.1016/j.ecolind.2023.110610 |
| [60] | Xu Y, Dai Q Y, Lu Y G, et al. Identification of ecologically sensitive zones affected by climate change and anthropogenic activities in Southwest China through a NDVI-based spatial-temporal model[J]. Ecological Indicators, 2024, 158. DOI:10.1016/j.ecolind.2023.111482 |
| [61] |
陈祖亮, 肖林颖, 王丽娜, 等. 西南高山峡谷区水分利用效率时空变化及其对气候变化和人类活动的响应[J]. 生态学报, 2025, 45(14): 6756-6769. Chen Z L, Xiao L Y, Wang L N, et al. Spatio-temporal variation of water use efficiency and its response to climate change and human activities in the Southwest Alpine Canyon Area of China[J]. Acta Ecologica Sinica, 2025, 45(14): 6756-6769. |
| [62] | Xue P, Zhang M Y, Wang K L, et al. How hydrothermal factors and CO2 concentration affect vegetation carbon sink over time and elevation gradient[J]. Journal of Cleaner Production, 2024, 449. DOI:10.1016/j.jclepro.2024.141800 |
| [63] | Zhang X, Su J X, Ji Y H, et al. Nitrogen deposition affects the productivity of planted and natural forests by modulating forest climate and community functional traits[J]. Forest Ecology and Management, 2024, 563. DOI:10.1016/j.foreco.2024.121970 |