 2024, Vol. 45

2. 中国科学院地球环境研究所,西安 710061;
3. 陕西关中平原区域生态环境变化与综合治理国家野外科学观测研究站,西安 710061
 , ZHANG Yong2 , ZHANG Qian1
 , TIAN Jie2,3 , LI Li2 , LIU Hui-kun2 , RAN Wei-kang3 , WANG Qi-yuan2,3
2. Institute of Earth Environment, Chinese Academy of Sciences, Xi'an 710061, China;
3. National Observation and Research Station of Regional Ecological Environmental Change and Comprehensive Management in the Guanzhong Plain, Xi'an 710061, China
大气细颗粒物(PM2.5)对空气质量、气候变化以及人体健康产生不利影响, 因而受到广泛关注[1~3]. 在城市中, PM2.5主要通过化石燃料等人为源以及扬尘等自然源排放产生[4]. 从秋季到冬季, 我国北方城市中人为排放源将发生较大变化[5], 其原因在于11月温度降低, 供暖开始, PM2.5浓度升高, 从而加剧空气污染[6~8]. 有研究表明, 在采暖季的空气污染事件中, 二次源以及生物质燃烧、燃煤等一次排放源是PM2.5的主要贡献者[9~11]. 因此, 不同城市的来源解析工作将有利于当地政府减排措施的制订.
近年来, 以高分辨率为优势的PM2.5化学组分在线监测技术迅速发展, 为PM2.5污染特征及来源的精细化分析提供了重要的研究手段[12~14], 并在污染事件成因分析中起着重要作用[15]. 在华北平原已有大量的使用在线监测仪器进行观测的研究, 例如Pang等[16]对北京、天津和廊坊采暖季期间的区域传输和化学组分的形成机制进行探究. Yang等[8]发现区域传输、二次转化和沙尘暴是北京秋冬季发生极端雾-霾事件的主要原因, 其中硝酸盐的液相化学反应尤为重要. Han等[17]研究了天津冬季雾-霾的形成原因及PM2.5化学组分的变化. Liu等[12]结合多个模型分析了北京冬季典型污染事件演化过程中化学组分和来源的变化, 并量化了区域传输的贡献. Lv等[18]通过添加有机示踪剂将混合源细分, 更利于分析京津冀地区雾-霾发生的原因.
汾渭平原具有以煤炭为主的高能耗、高排放的能源结构, 且人口密度大、气象扩散条件不佳等特点[19, 20], 导致该地区大气污染事件频发, 特别是秋、冬取暖季[21]. 为解决这一问题, 部分学者已在汾渭平原的某些城市开展PM2.5的来源解析工作, 结果表明二次源和燃煤源是该区域PM2.5的主要来源[21~24], 污染事件发生时二者贡献会迅速增加[23, 24]. 西安位于我国汾渭平原西南部, 是空气污染最严重的地区之一[25, 26]. 由于城市化和工业化, 能源消耗量和机动车保有辆快速增长, 西安面临着严重的高浓度PM2.5污染问题[27]. 尽管近年来空气质量有所改善, 但秋冬季不利的气象条件, 易于PM2.5累积, 仍容易引起污染事件[28, 29]. 目前关于西安市PM2.5的相关研究主要集中在冬季污染事件[28, 30, 31], 对于采暖季过渡期污染事件成因及来源的研究较为短缺. 为此本研究于2019年采暖季过渡期在西安开展PM2.5在线监测, 获得高时间分辨率化学组分特征, 解析PM2.5来源, 旨在探索污染事件形成过程中组分及来源的高时间分辨率演变规律.
1 材料与方法 1.1 站点描述采样点位于陕西关中平原区域生态环境变化与综合治理国家野外科学观测研究站高新子观测场(34.13°N, 108.52°E), 周围主要是商业和住宅区, 南侧有两个医药相关产业, 东侧为唐延路及沣惠南路, 车流量较大. 在线监测设备包括气溶胶化学组分监测仪(Q-ACSM, 美国Aerodyne公司)、七波段黑碳仪(AE33, 美国Maggie公司)、大气多金属元素在线监测仪(Xact 625, 美国Cooper环境服务公司), 进样口距地面约10 m, 取2019年10月25日至11月17日的数据进行分析.
1.2 在线监测设备PM2.5中有机物(OA)、硫酸根(SO42-)、硝酸根(NO3-)、铵根(NH4+)和氯离子(Cl-)组分浓度利用Q-ACSM监测获取, 仪器分辨率约为15 min. 关于Q-ACSM测量原理在其他相关研究里已经详细阐述[32]. 黑碳(BC)组分浓度数据通过AE33实时监测获取. 简单来说, AE33通过采样泵连续抽取含有气溶胶的样气, 经采样管路后, 气溶胶沉积在带有特氟龙涂层的玻璃纤维滤带上, 根据BC在不同波段下对光的吸收特性和透射光的衰减程度, 获得不同波段下BC浓度数据. 关于AE33的详细监测原理等内容参见文献[33, 34]. 无机元素组分浓度数据通过Xact 625获取. Xact 625基于X射线平台对环境气体中25种甚至更多金属元素进行实时在线监测. 简单来说环境空气经过粒径切割器采样, 样品沉积于滤带上, 样品前进至分析位置, 使用X射线荧光法(XRF)分析样品中的金属元素含量, 并由数据处理软件计算得出相应时段的浓度值[35, 36]. 采样和分析同步连续进行, 提供连续的金属浓度数据. 环境六参数和气象数据分别从国家空气质量监测网(http://data.cma.cn/)和气象监测网(http://www.weather.com.cn/)获取.
使用分析纯的NH4NO3和(NH4)2SO4作为标准物质对Q-ACSM进行校准, 其中NH4NO3用于校准响应因子, NH4NO3和(NH4)2SO4分别用于获取NO3-和SO42-的相对离子化效率;通过皂膜流量计对流量进行多次测定, 并与进样口的压力进行线性回归, 根据所得方程的斜率和截距对Q-ACSM的流量参数进行更新. AE33日常校准的重点为流量校准和光学测试, 其中流量校准需要使用流量计和流量校准膜, 光学测试的结果偏差要小于10%. 空白滤带测试、金属探棒测试和标准膜片校准是对Xact 625分析环节的质量控制, 其中空白滤带测试是检查仪器的初始精密度偏差, 除K元素空白值偏高外其余元素均较低;内置探棒属于内标源测试, 每日自动进行一次, 数值偏差范围应低于5%;标准膜片校准则每3个月进行一次, 用于保证仪器的准确可靠运行.
1.3 数据分析 1.3.1 质量重构为进一步确定监测获取的PM2.5组分数据质量, 基于组分数据对PM2.5质量浓度进行重构, 重构PM2.5质量浓度为OA、SO42-、NO3-、NH4+、Cl-、BC、粉尘和微量元素组分浓度加和, 其中粉尘浓度计算公式为:[粉尘] = 2.2 × [Al] + 2.49 × [Si] + 1.63 × [Ca] + 2.42 × [Fe] + 1.94 × [Ti], 由于没有对Al及Ti元素进行测量, 因此利用Ca元素浓度对其进行换算, 换算公式[37]为:[Al] = 2.32 × [Ca];[Ti] = 0.13 × [Ca]. 微量元素浓度计算公式为:[微量元素] = [K]+[Cr]+[Mn]+[Co]+[Ni]+[Cu]+[Zn]+[As]+[Se]+[Ba]+[Pb]. 重构PM2.5质量浓度与附近国控站PM2.5在线监测质量浓度拟合结果显示, 斜率和相关性分别为0.98和0.88, 表明此次观测数据具有一定的代表性.
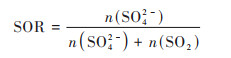
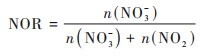
1.3.2 SOR和NOR计算二次无机离子组分(SO42-、NO3-和NH4+, SIA)通常对PM2.5质量浓度有较大贡献. PM2.5中的SIA组分主要来自于前体物二次转化[38, 39], 通常使用硫氧化率(SOR)和氮氧化率(NOR)来表征SO2及NO2的二次转化效率[40~42]. 计算公式如下:
|
(1) |
|
(2) |
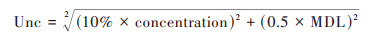
正定矩阵因子分解(positive matrix factorization, PMF)模型是一种有效对颗粒物进行来源解析的数学受体模型, 已成为我国该方面研究中最流行的手段之一[4], 模型原理和使用方法详细论述参见文献[43~45]. 模型输入组分浓度的不确定度计算方法如下, 如果该组分浓度小于等于仪器检测限(MDL), 则使用公式(3)进行计算.

|
(3) |
如果该组分浓度大于MDL, 则使用公式(4)进行计算.
|
(4) |
PMF模型输入组分数据包括PM2.5、OA、SO42-、NO3-、NH4+、Cl-、BC、Si、K、Ca、Cr、Mn、Fe、Co、Ni、Cu、Zn、As、Se、Ba、Pb在内的21种化学组分, 将PM2.5设为总变量. 为了确定最佳来源数量及解析结果, 在5~7因子之间进行了多次运行, 综合考虑Q值、残差、源谱及源贡献占比, 最终确定6个因子的解析方案为最优解.
2 结果及讨论 2.1 PM2.5化学组分特征及形成基于空气质量指数(AQI), 本研究共识别3次污染事件(图 1), 其选择标准为包含AQI > 100且至少持续12 h的时间段. 非污染期的定义为污染事件外剩余时间段. 表 1总结了不同时期PM2.5化学组分浓度特征. 结果表明, 整个采样期ρ(PM2.5)在6.9~167.8 μg·m-3, 平均值为(78.3 ± 38.5)μg·m-3, 其中OA是PM2.5的主要贡献者(贡献率为38.7%), 其次是SIA(贡献率为31.6%)和粉尘(贡献率为21.2%). 在SIA中, NO3-的贡献最高[(14.9 ± 13.7)μg·m-3], 其次是NH4+[(5.8 ± 4.8)μg·m-3]和SO42-[(4.0 ± 3.1)μg·m-3]. BC(贡献率为5.7%)、Cl-(贡献率为1.3%)及微量元素(贡献率为1.5%)对PM2.5贡献率相对较低.

|
图 1 观测期间PM2.5、化学组分及气象要素的时间序列变化 Fig. 1 Time series of PM2.5, chemical components and meteorological elements during the observation period |
|
|
表 1 不同时期PM2.5化学组分质量浓度/μg·m-3 Table 1 Mass concentration of chemical components of PM2.5 in different periods/μg·m-3 |
如表 1所示, 非污染期ρ(PM2.5)为(66.5 ± 34.9)μg·m-3, 高于《环境空气质量标准》(GB 3095-2012)的一级标准(35 μg·m-3), 表明西安市采暖季过渡期空气污染较为严重. 与非污染期相比, 污染事件中各化学组分的贡献率有不同程度地增加或减少, 其中增幅最大的为SIA(108.0%~243.7%, 事件Ⅰ除外), 其余组分的变化幅度为-36.8%~100.0%. 各污染事件的PM2.5化学组分也存在一定差异. 事件Ⅰ中PM2.5的主要贡献者为OA(贡献率为40.1%)和粉尘(贡献率为37.9%), 而事件Ⅱ和事件Ⅲ中PM2.5的主要贡献者为OA(贡献率分别为31.9%、38.6%)和SIA(贡献率分别为50.6%、34.8%). 造成这种差异的原因可能是事件Ⅰ中较高的风速使粉尘浓度增加、事件Ⅱ中高Ox浓度和高相对湿度(RH)为二次组分形成提供有利条件以及事件Ⅲ初期温度较低, 居民取暖需求增大, 生物质燃烧量增加, 排放大量的OA. 在不同污染事件中, SIA的浓度均呈现出:NO3- > NH4+ > SO42-, 这可能是由于机动车保有量持续上升NOx排放量增加, 清洁能源逐步替代煤炭使得SO2排放量减少[46], 从而造成NO3- > SO42-.
使用Ox(O3+NO2)和RH分别探索OA和SIA在白天(07:00~18:00)及夜间(19:00至次日06:00)的形成机制. 图 2(a)~2(d)描述了观测期间白天OA和SIA浓度随Ox浓度的变化. 当ρ(Ox) < 70 μg·m-3时, OA与Ox呈显著线性正相关(R2 = 0.99, P < 0.01), 其斜率为0.51;当ρ(Ox) > 70 μg·m-3时, 尽管OA与Ox依然呈线性正相关(R2 = 0.71, P < 0.01), 但其斜率降至0.13, 这可能是受前体物减少影响. 对于SIA而言, SO42-、NO3-和NH4+与Ox整体呈线性正相关(R2介于0.53~0.72), 表明光化学氧化反应是上述组分形成的重要途径. 然而它们的斜率差异大, 呈现NO3-(0.16) > NH4+(0.06) > SO42-(0.03)的特征, 表明NO3-的光化学氧化形成速率高于NH4+和SO42-. 图 2(e)~2(h)描述了观测期间夜间OA和SIA浓度随RH的变化. 当RH < 90%时, OA浓度随RH增加无明显的变化趋势;而当RH > 90%时, OA浓度显著降低, 这可能是因为高湿度环境中, 气溶胶酸度发生变化, 进而抑制二次有机气溶胶的形成[47, 48]. 当RH < 90%时, SO42-、NO3-和NH4+浓度随RH的升高而上升, 说明液相化学反应是夜间SIA的重要生成途径;而当RH > 90%时, 它们浓度显著下降的原因可能是深夜前体物浓度较低, 并且RH较高时的吸湿增长也将引发颗粒物沉降[49].

|
(a)~(d)白天OA及SIA随Ox的变化趋势, (e)~(h)夜间OA及SIA随RH的变化趋势 图 2 OA及SIA随Ox及RH变化趋势 Fig. 2 Variation trend of OA and SIA with Ox and RH |
使用PMF解析观测期间PM2.5的来源, 基于各化学组分特征确定了6个来源, 分别为二次源、生物质燃烧源、扬尘源、机动车源、工业源及燃煤源. 图 3显示了PM2.5的源谱特征及其来源贡献.

|
(a)PM2.5源谱, (b)不同来源对PM2.5的平均贡献率 图 3 观测期间PM2.5源谱及不同来源平均贡献率 Fig. 3 PM2.5 source profiles and average contribution rates from different sources during the observation period |
因子1中NO3-、NH4+和SO42-的贡献率较高. 有研究表明NO3-和SO42-主要由其前体物(NOx、SO2)通过光化学氧化或液相化学反应生成[38]. 因此, 将该因子定义为二次源, 其对PM2.5平均贡献率为29.1%. 因子2中Cl-、BC和OA贡献率较高, 这些组分通常来自生物质燃烧[50]. 将该因子定义为生物质燃烧源, 其对PM2.5的贡献率仅次于二次源, 为21.1%. 因子3中贡献率较高的组分包括Si和Ca以及Ni和K等贡献率较低的组分. 其中, Si和Ca是典型的地壳元素[51, 52], 而Ni和K等其他组分也可通过富集因子的计算(0.27~1.45)判定其主要来自地壳. 因此, 该因子定义为扬尘源, 其对PM2.5平均贡献率为15.3%. 因子4中Zn、Mn、Cu和Fe贡献率较高, 其中Zn是车辆润滑油的主要添加剂[38], 并且也可作为轮胎橡胶的硫化活性剂, 在车辆行驶中会摩擦产生Zn[53];Cu用于制作刹车片, 车辆刹车摩擦会释放Cu;Fe和Mn则来自车辆零件腐蚀及制动磨损[54]. 因此, 将该因子定义为机动车源, 其对PM2.5平均贡献率为12.9%. 因子5中Co贡献率最高, 此外Ca、Fe、Mn和Cr等金属元素也有一定的贡献率. Co主要来自于与工业相关的煤炭燃烧[55], Cr是冶金工业的重要示踪物[56]. 将该因子定义为工业源, 其对PM2.5平均贡献率为11.4%. As和Se作为典型的煤炭燃烧指示物[12, 15], 在因子6中贡献率较高, 将该因子定义为燃煤源, 其对PM2.5贡献率为10.2%.
不同时期的PM2.5来源贡献如图 4所示(事件Ⅰ和事件Ⅱ部分时间段的PM2.5来源由于缺少元素数据无法解析). 非污染期PM2.5主要来自生物质燃烧源和二次源, 分别贡献了29.1%(19.2 μg·m-3)和20.5%(13.6 μg·m-3);扬尘源、机动车源和工业源贡献率相对较低, 分别为18.4%(12.1 μg·m-3)、15.1%(10.0 μg·m-3)和12.7%(8.4 μg·m-3);燃煤源贡献率则最低, 仅占4.2%(2.8 μg·m-3). 与非污染期相比(事件Ⅰ除外), 二次源成为污染期PM2.5的主要来源, 这与其他城市污染期PM2.5来源结果一致[57, 58];由于居民取暖需求增大, 生物质和煤炭消耗量增加, 导致生物质燃烧源与燃煤源贡献增加;此外, 污染期间工业源、机动车源和扬尘源对PM2.5的贡献均相对较低. 不同事件间PM2.5的来源贡献也存在着一定的差异, 扬尘源作为主要贡献者在事件Ⅰ中的贡献率(浓度)为38.3%(31.5 μg·m-3), 事件Ⅱ和事件Ⅲ的主要贡献者二次源的贡献率(浓度)分别为48.1%(45.2 μg·m-3)和36.1%(39.7 μg·m-3), 此外一次源在3次事件中的贡献率(浓度)分别为96.3%(79.2 μg·m-3)、51.9%(48.8 μg·m-3)和63.9%(70.1 μg·m-3), 这表明污染期间PM2.5更多的来自于一次源直接排放, 应加大对其的管控.

|
(a)不同来源排放的质量浓度, (b)不同来源排放的贡献率 图 4 不同时期不同来源对PM2.5的贡献率 Fig. 4 Contribution rates to PM2.5 from different sources at different periods |
为了对污染事件进行完整分析, 将污染的积累和消散阶段包括在内, 重新划分后的污染事件时间段为事件Ⅰ:10月28日08:00至10月30日14:00;事件Ⅱ:11月3日17:00至11月10日08:00;事件Ⅲ:11月15日17:00至11月17日20:00. 由于仪器原因事件Ⅰ和事件Ⅱ前半段缺少部分元素数据, 考虑到组分数据和来源解析结果的完整性, 故只对事件Ⅱ后半段(11月7日08:00至11月10日08:00)及事件Ⅲ进行分析. 图 5展示了事件Ⅱ和事件Ⅲ中化学组分、来源贡献、气态污染物及气象条件的时间序列变化.

|
图 5 不同事件的气象条件、气态污染物、化学组分及来源贡献时间序列变化 Fig. 5 Change in meteorological conditions, gaseous pollutants, chemical components and source contribution time series of different events |
根据AQI将事件Ⅱ分为3个阶段:11月7日08:00~15:00为污染发展阶段(AQI < 100), 11月7日16:00至11月9日15:00为污染维持阶段(AQI > 100), 11月9日16:00至11月10日08:00为污染消散阶段(AQI到达峰值后持续降低). 污染发展阶段PM2.5以8.2 μg·(m3·h)-1的速率上升, 各组分浓度大幅增加(BC和微量元素除外). 由于Ox浓度升高, 大气氧化性增强[41], SOR和NOR随之升高, 与污染发展阶段相比, 污染维持阶段的ρ(SO42-)、ρ(NO3-)和ρ(NH4+)分别从5.9、17.5和6.7 μg·m-3增加至8.2、29.2和11.5 μg·m-3, 同时ρ(OA)也从18.9 μg·m-3增加至28.8 μg·m-3. 受不利气象条件影响, ρ(PM2.5)逐渐增加并于11月9日11:00达到此次事件的峰值(133.2 μg·m-3). 在高位持续3 h后, 降雨及较高的风速使此次事件进入污染消散阶段, AQI在11月9日23:00下降至100以下, ρ(PM2.5)维持在20.0~40.0 μg·m-3, 与该事件最初相比, 粉尘贡献率增加, SIA组分贡献率降低. 通过对比不同阶段各污染源浓度的变化可以发现, 二次源在污染发展和维持阶段是主要贡献者, 其贡献率在50.0%左右;污染维持阶段生物质燃烧源、燃煤源和工业源的浓度明显高于污染发展阶段;在污染消散阶段随着PM2.5浓度的逐渐降低, 除扬尘源浓度逐渐增加外, 其余源浓度均呈现下降趋势. 这与不同阶段的Ox浓度、风速和降雨等气象条件有关.
使用与事件Ⅱ相同的标准对事件Ⅲ进行阶段划分:11月15日17:00~20:00为污染发展阶段(AQI < 100), 11月15日21:00至11月17日06:00为污染维持阶段(AQI > 100), 11月17日07:00~20:00为污染消散阶段(AQI到达峰值后持续降低). 受集中供暖影响, 事件Ⅲ污染程度相对于事件Ⅱ更为严重. 污染发展阶段PM2.5以18.2 μg·(m3·h)-1的速率上升, 其中OA和粉尘是PM2.5的主要化学组分, 其浓度大幅增加, 分别为最初的3.5倍和2.5倍. 污染维持阶段PM2.5化学组成变化较大, 将其分为阶段Ⅰ(11月15日21:00至11月16日08:00)和阶段Ⅱ(11月16日09:00至11月17日06:00)进行讨论. 由于夜间温度持续下降, 居民取暖需求增加使得生物质消耗量增加, 排放大量OA使其成为阶段Ⅰ中PM2.5的主要化学组分(贡献率为52.1%), 加之夜间边界层高度降低导致污染物不易扩散[59, 60], 使得ρ(PM2.5)在11月15日23:00达到此次事件峰值(167.8 μg·m-3). 受夜间液相化学、日间光化学氧化反应及静稳天气条件影响, SIA组分浓度持续增加, 阶段Ⅱ中PM2.5的主要化学组分由OA转变为SIA组分(贡献率为49.1%), 但SIA组分浓度与事件Ⅱ污染维持阶段相比较低, 其原因在于事件Ⅱ有着更高的Ox浓度和RH, 为气态前体物的二次转化提供有利条件. 11月17日07:00开始进入此次事件的污染消散阶段, 由于风速的持续升高使得污染物逐渐扩散[61], 与事件Ⅱ类似, 粉尘组分浓度持续增加并成为该阶段PM2.5的主要化学组分(贡献率为57.8%), 其余化学组分浓度均持续下降, ρ(PM2.5)降至40.0 μg·m-3左右. 通过图 5可以看出此次事件不同阶段的各污染源浓度变化较大, 与事件Ⅱ不同的是在污染发展阶段, 机动车源是PM2.5的主要贡献者, 这可能是晚高峰所致;生物质燃烧源和二次源则分别是污染维持阶段Ⅰ和阶段Ⅱ中PM2.5的主要贡献者, 这与事件Ⅱ也存在着一定差异, 主要是受取暖强度的影响;污染消散阶段与事件Ⅱ相同, PM2.5的主要贡献者为扬尘源.
3 结论(1)观测期间ρ(PM2.5)平均值为(78.3 ± 38.5)μg·m-3, 高于环境空气质量一级标准, 表明该时期空气污染较为严重. 观测期间PM2.5的主要化学组分为OA(贡献率为38.7%)、SIA(贡献率为31.6%)和粉尘(贡献率为21.2%), BC(贡献率为5.7%)、Cl-(贡献率为1.3%)及微量元素(贡献率为1.5%)对PM2.5贡献率相对较低. OA和SIA与Ox的相关性表明光化学氧化反应是其形成的重要途径;同时在RH低于90%时, SIA与RH密切相关, 反映了液相化学反应的重要性.
(2)基于高时间分辨率组分数据, 使用PMF模型确定了PM2.5的6个来源, 分别为二次源(贡献率为29.1%)、生物质燃烧源(贡献率为21.1%)、扬尘源(贡献率为15.3%)、机动车源(贡献率为12.9%)、工业源(贡献率为11.4%)和燃煤源(贡献率为10.2%). 非污染期PM2.5主要来自生物质燃烧源和扬尘源, 二次源成为污染期间PM2.5的主要来源(事件Ⅰ为扬尘源).
(3)两次事件中污染维持阶段PM2.5的主要化学组分为OA和SIA组分, 消散阶段为粉尘组分. 受取暖需求影响, 事件Ⅲ中污染维持阶段Ⅰ的PM2.5主要来源为生物质燃烧源, 污染维持阶段Ⅱ与事件Ⅱ相同, 为二次源, 污染消散阶段扬尘源则成为PM2.5的主要来源.
| [1] | Lelieveld J, Evans J S, Fnais M, et al. The contribution of outdoor air pollution sources to premature mortality on a global scale[J]. Nature, 2015, 525(7569): 367-371. DOI:10.1038/nature15371 |
| [2] | Hu J L, Ying Q, Wang Y G, et al. Characterizing multi-pollutant air pollution in China: comparison of three air quality indices[J]. Environment International, 2015, 84: 17-25. DOI:10.1016/j.envint.2015.06.014 |
| [3] | Lin H L, Liu T, Xiao J P, et al. Mortality burden of ambient fine particulate air pollution in six Chinese cities: results from the Pearl River Delta study[J]. Environment International, 2016, 96: 91-97. DOI:10.1016/j.envint.2016.09.007 |
| [4] | Zhu Y H, Huang L, Li J Y, et al. Sources of particulate matter in China: insights from source apportionment studies published in 1987-2017[J]. Environment International, 2018, 115: 343-357. DOI:10.1016/j.envint.2018.03.037 |
| [5] | Saha M, Maharana D, Kurumisawa R, et al. Seasonal trends of atmospheric PAHs in five Asian megacities and source detection using suitable biomarkers[J]. Aerosol and Air Quality Research, 2017, 17(9): 2247-2262. DOI:10.4209/aaqr.2017.05.0163 |
| [6] | Li F X, Gu J W, Xin J Y, et al. Characteristics of chemical profile, sources and PAH toxicity of PM2.5 in beijing in autumn-winter transit season with regard to domestic heating, pollution control measures and meteorology[J]. Chemosphere, 2021, 276. DOI:10.1016/j.chemosphere.2021.130143 |
| [7] | Wang H, Wang S L, Zhang J Q, et al. Characteristics of PM2.5 pollution with comparative analysis of O3 in Autumn–Winter seasons of Xingtai, China[J]. Atmosphere, 2021, 12(5). DOI:10.3390/atmos12050569 |
| [8] | Yang S, Duan F K, Ma Y L, et al. Mixed and intensive haze pollution during the transition period between autumn and Winter in Beijing, China[J]. Science of the Total Environment, 2020, 711. DOI:10.1016/j.scitotenv.2019.134745 |
| [9] |
李明燕, 杨文, 魏敏, 等. 典型沿海城市采暖期细颗粒物组分特征及来源解析[J]. 环境科学, 2020, 41(4): 1550-1560. Li M Y, Yang W, Wei M, et al. Characteristics and sources apportionment of fine particulate matter in a typical coastal city during the heating period[J]. Environmental Science, 2020, 41(4): 1550-1560. |
| [10] |
朱淑贞, 佟洁, 鲍丰, 等. 廊坊市秋冬季大气细颗粒物污染特征及来源解析[J]. 环境科学, 2023, 44(1): 20-29. Zhu S Z, Tong J, Bao F, et al. Characteristics and source apportionment of atmospheric fine particles in Langfang in autumn and winter[J]. Environmental Science, 2023, 44(1): 20-29. |
| [11] |
路娜, 李治国, 周静博, 等. 2015年石家庄市采暖期一次重污染过程细颗粒物在线来源解析[J]. 环境科学, 2017, 38(3): 884-893. Lu N, Li Z G, Zhou J B, et al. Online source analysis of particulate matter (PM2.5) in a heavy pollution process of Shijiazhuang city during heating period in 2015[J]. Environmental Science, 2017, 38(3): 884-893. |
| [12] | Liu Y F, Li C L, Zhang C, et al. Chemical characteristics, source apportionment, and regional contribution of PM2.5 in Zhangjiakou, Northern China: a multiple sampling sites observation and modeling perspective[J]. Environmental Advances, 2021, 3. DOI:10.1016/j.envadv.2021.100034 |
| [13] | Gao J, Peng X, Chen G, et al. Insights into the chemical characterization and sources of PM2.5 in Beijing at a 1-h time resolution[J]. Science of the Total Environment, 2016, 542: 162-171. DOI:10.1016/j.scitotenv.2015.10.082 |
| [14] | Sun Y L, Wang Z F, Du W, et al. Long-term real-time measurements of aerosol particle composition in Beijing, China: seasonal variations, meteorological effects, and source analysis[J]. Atmospheric Chemistry and Physics, 2015, 15(17): 10149-10165. DOI:10.5194/acp-15-10149-2015 |
| [15] | Shen J Y, Zhao Q B, Cheng Z, et al. Evolution of source contributions during heavy fine particulate matter (PM2.5) pollution episodes in Eastern China through online measurements[J]. Atmospheric Environment, 2020, 232. DOI:10.1016/j.atmosenv.2020.117569 |
| [16] | Pang N N, Gao J, Che F, et al. Cause of PM2.5 pollution during the 2016-2017 heating season in Beijing, Tianjin, and Langfang, China[J]. Journal of Environmental Sciences, 2020, 95: 201-209. DOI:10.1016/j.jes.2020.03.024 |
| [17] | Han S Q, Wu J H, Zhang Y F, et al. Characteristics and formation mechanism of a winter haze-fog episode in Tianjin, China[J]. Atmospheric Environment, 2014, 98: 323-330. DOI:10.1016/j.atmosenv.2014.08.078 |
| [18] | Lv L L, Chen Y J, Han Y, et al. High-time-resolution PM2.5 source apportionment based on multi-model with organic tracers in Beijing during haze episodes[J]. Science of the Total Environment, 2021, 772. DOI:10.1016/j.scitotenv.2020.144766 |
| [19] | Cheng J, Tong D, Liu Y, et al. Air quality and health benefits of China's current and upcoming clean air policies[J]. Faraday Discussions, 2021, 226: 584-606. DOI:10.1039/D0FD00090F |
| [20] |
李雁宇, 李杰, 曾胜兰, 等. 2017年汾渭平原东部大气颗粒物污染特征分析[J]. 环境科学研究, 2020, 33(1): 63-72. Li Y Y, Li J, Zeng S L, et al. Analysis of atmospheric particulates in the eastern Fenwei Plain in 2017[J]. Research of Environmental Sciences, 2020, 33(1): 63-72. |
| [21] | Dao X, Ji D S, Zhang X, et al. Characteristics, sources and health risk assessment of PM2.5 in China's coal and coking heartland: insights gained from the regional observations during the heating season[J]. Atmospheric Pollution Research, 2021, 12(12). DOI:10.1016/j.apr.2021.101237 |
| [22] | Liu Y, Xu X J, Yang X Y, et al. Significant contribution of secondary particulate matter to recurrent air pollution: evidence from in situ observation in the most polluted city of Fen-Wei Plain of China[J]. Journal of Environmental Sciences, 2022, 114: 422-433. DOI:10.1016/j.jes.2021.09.030 |
| [23] | Li Y F, Liu B S, Xue Z G, et al. Chemical characteristics and source apportionment of PM2.5 using PMF modelling coupled with 1-hr resolution online air pollutant dataset for Linfen, China[J]. Environmental Pollution, 2020, 263. DOI:10.1016/j.envpol.2020.114532 |
| [24] |
李慧, 王涵, 严沁, 等. 汾渭平原秋冬季PM2.5化学组分特征及其来源[J]. 环境科学研究, 2023, 36(3): 449-459. Li H, Wang H, Yan Q, et al. Chemical composition characteristics and source apportionment of PM2.5 in the Fenwei Plain in autumn and winter[J]. Research of Environmental Sciences, 2023, 36(3): 449-459. |
| [25] | Liu X D, Hui Y, Yin Z Y, et al. Deteriorating haze situation and the severe haze episode during December 18–25 of 2013 in Xi'an, China, the worst event on record[J]. Theoretical and Applied Climatology, 2016, 125(1-2): 321-335. DOI:10.1007/s00704-015-1509-8 |
| [26] | Wang P, Cao J J, Shen Z X, et al. Spatial and seasonal variations of PM2.5 mass and species during 2010 in Xi'an, China[J]. Science of the Total Environment, 2015, 508: 477-487. DOI:10.1016/j.scitotenv.2014.11.007 |
| [27] | Zhang T, Cao J J, Tie X X, et al. Water-soluble ions in atmospheric aerosols measured in Xi'an, China: seasonal variations and sources[J]. Atmospheric Research, 2011, 102(1-2): 110-119. DOI:10.1016/j.atmosres.2011.06.014 |
| [28] | Zhang T, Shen Z X, Su H, et al. Effects of aerosol water content on the formation of secondary inorganic aerosol during a winter heavy PM2.5 pollution episode in Xi'an, China[J]. Atmospheric Environment, 2021, 252. DOI:10.1016/j.atmosenv.2021.118304 |
| [29] | Dai Q L, Bi X H, Liu B S, et al. Chemical nature of PM2.5 and PM10 in Xi'an, China: insights into primary emissions and secondary particle formation[J]. Environmental Pollution, 2018, 240: 155-166. DOI:10.1016/j.envpol.2018.04.111 |
| [30] | Wang X, Shen Z X, Liu F B, et al. Saccharides in summer and winter PM2.5 over Xi'an, Northwestern China: sources, and yearly variations of biomass burning contribution to PM2.5 [J]. Atmospheric Research, 2018, 214: 410-417. DOI:10.1016/j.atmosres.2018.08.024 |
| [31] | Liu P P, Lei Y L, Ren H R, et al. Seasonal variation and health risk assessment of heavy metals in PM2.5 during winter and summer over Xi'an, China[J]. Atmosphere, 2017, 8(5). DOI:10.3390/atmos8050091 |
| [32] | Tian J, Wang Q Y, Zhang Y, et al. Impacts of primary emissions and secondary aerosol formation on air pollution in an urban area of China during the COVID-19 lockdown[J]. Environment International, 2021, 150. DOI:10.1016/j.envint.2021.106426 |
| [33] | Rajesh T A, Ramachandran S. Black carbon aerosol mass concentration, absorption and single scattering albedo from single and dual spot aethalometers: radiative implications[J]. Journal of Aerosol Science, 2018, 119: 77-90. DOI:10.1016/j.jaerosci.2018.02.001 |
| [34] | Drinovec L, Močnik G, Zotter P, et al. The "dual-spot" aethalometer: an improved measurement of aerosol black carbon with real-time loading compensation[J]. Atmospheric Measurement Techniques, 2015, 8(5): 1965-1979. DOI:10.5194/amt-8-1965-2015 |
| [35] | Zhao S, Tian H Z, Luo L N, et al. Temporal variation characteristics and source apportionment of metal elements in PM2.5 in urban Beijing during 2018-2019[J]. Environmental Pollution, 2021, 268. DOI:10.1016/j.envpol.2020.115856 |
| [36] | Furger M, Minguillón M C, Yadav V, et al. Elemental composition of ambient aerosols measured with high temporal resolution using an online XRF spectrometer[J]. Atmospheric Measurement Techniques, 2017, 10(6): 2061-2076. DOI:10.5194/amt-10-2061-2017 |
| [37] | Chow J C, Lowenthal D H, Chen L W A, et al. Mass reconstruction methods for PM2.5: a review[J]. Air Quality, Atmosphere & Health, 2015, 8(3): 243-263. |
| [38] | Srivastava D, Xu J S, Vu T V, et al. Insight into PM2.5 sources by applying positive matrix factorization (PMF) at urban and rural sites of Beijing[J]. Atmospheric Chemistry and Physics, 2021, 21(19): 14703-14724. DOI:10.5194/acp-21-14703-2021 |
| [39] | Xu X M, Zhang H F, Chen J M, et al. Six sources mainly contributing to the haze episodes and health risk assessment of PM2.5 at Beijing suburb in winter 2016[J]. Ecotoxicology and Environmental Safety, 2018, 166: 146-156. DOI:10.1016/j.ecoenv.2018.09.069 |
| [40] | Xu Q C, Wang S X, Jiang J K, et al. Nitrate dominates the chemical composition of PM2.5 during haze event in Beijing, China[J]. Science of the Total Environment, 2019, 689: 1293-1303. DOI:10.1016/j.scitotenv.2019.06.294 |
| [41] | Xie Y Z, Liu Z R, Wen T X, et al. Characteristics of chemical composition and seasonal variations of PM2.5 in Shijiazhuang, China: impact of primary emissions and secondary formation[J]. Science of the Total Environment, 2019, 677: 215-229. DOI:10.1016/j.scitotenv.2019.04.300 |
| [42] | Sun Y L, Zhuang G S, Tang A H, et al. Chemical characteristics of PM2.5 and PM10 in haze-fog episodes in Beijing[J]. Environmental Science & Technology, 2006, 40(10): 3148-3155. |
| [43] | Hopke P K. Review of receptor modeling methods for source apportionment[J]. Journal of the Air & Waste Management Association, 2016, 66(3): 237-259. |
| [44] | Han F L, Kota S H, Wang Y G, et al. Source apportionment of PM2.5 in Baton Rouge, Louisiana during 2009-2014[J]. Science of the Total Environment, 2017, 586: 115-126. DOI:10.1016/j.scitotenv.2017.01.189 |
| [45] | Belis C A, Pikridas M, Lucarelli F, et al. Source apportionment of fine PM by combining high time resolution organic and inorganic chemical composition datasets[J]. Atmospheric Environment: X, 2019, 3. DOI:10.1016/j.aeaoa.2019.100046 |
| [46] | Li R, Cui L L, Li J L, et al. Spatial and temporal variation of particulate matter and gaseous pollutants in China during 2014-2016[J]. Atmospheric Environment, 2017, 161: 235-246. DOI:10.1016/j.atmosenv.2017.05.008 |
| [47] | Huang X J, Zhang J K, Luo B, et al. Characterization of oxalic acid-containing particles in summer and winter seasons in Chengdu, China[J]. Atmospheric Environment, 2019, 198: 133-141. DOI:10.1016/j.atmosenv.2018.10.050 |
| [48] | Meng J J, Wang G H, Li J J, et al. Seasonal characteristics of oxalic acid and related SOA in the free troposphere of Mt. Hua, Central China: implications for sources and formation mechanisms[J]. Science of the Total Environment, 2014, 493: 1088-1097. DOI:10.1016/j.scitotenv.2014.04.086 |
| [49] | Chen Z Y, Chen D L, Zhao C F, et al. Influence of meteorological conditions on PM2.5 concentrations across China: a review of methodology and mechanism[J]. Environment International, 2020, 139. DOI:10.1016/j.envint.2020.105558 |
| [50] | Cesari D, Donateo A, Conte M, et al. An inter-comparison of PM2.5 at urban and urban background sites: chemical characterization and source apportionment[J]. Atmospheric Research, 2016, 174-175: 106-119. DOI:10.1016/j.atmosres.2016.02.004 |
| [51] | Rai P, Furger M, Slowik J G, et al. Characteristics and sources of hourly elements in PM10 and PM2.5 during wintertime in Beijing[J]. Environmental Pollution, 2021, 278. DOI:10.1016/j.envpol.2021.116865 |
| [52] | Zhou S Z, Davy P K, Huang M J, et al. High-resolution sampling and analysis of ambient particulate matter in the Pearl River Delta region of Southern China: source apportionment and health risk implications[J]. Atmospheric Chemistry and Physics, 2018, 18(3): 2049-2064. DOI:10.5194/acp-18-2049-2018 |
| [53] | Li M L, Liu Z R, Chen J, et al. Characteristics and source apportionment of metallic elements in PM2.5 at urban and suburban sites in Beijing: implication of emission reduction[J]. Atmosphere, 2019, 10(3). DOI:10.3390/atmos10030105 |
| [54] | Piscitello A, Bianco C, Casasso A, et al. Non-exhaust traffic emissions: sources, characterization, and mitigation measures[J]. Science of the Total Environment, 2021, 766. DOI:10.1016/j.scitotenv.2020.144440 |
| [55] | Chen Y, Xie S D, Luo B, et al. Particulate pollution in urban Chongqing of southwest China: historical trends of variation, chemical characteristics and source apportionment[J]. Science of the Total Environment, 2017, 584-585: 523-534. DOI:10.1016/j.scitotenv.2017.01.060 |
| [56] | Dall'Osto M, Booth M J, Smith W, et al. A study of the size distributions and the chemical characterization of airborne particles in the vicinity of a large integrated steelworks[J]. Aerosol Science and Technology, 2008, 42(12): 981-991. DOI:10.1080/02786820802339587 |
| [57] |
刘倬诚, 牛月圆, 吴婧, 等. 山地型城市冬季大气重污染过程特征及成因分析[J]. 环境科学, 2021, 42(3): 1306-1314. Liu Z C, Niu Y Y, Wu J, et al. Characteristics and cause analysis of heavy air pollution in a mountainous city during winter[J]. Environmental Science, 2021, 42(3): 1306-1314. |
| [58] |
夏丽, 朱彬, 王红磊, 等. 长三角地区一次区域污染过程中细颗粒物的来源解析及其光学特性[J]. 环境科学, 2021, 42(2): 556-563. Xia L, Zhu B, Wang H L, et al. Source apportionment and optical properties of fine particles associated with regional pollution in the Yangtze River Delta[J]. Environmental Science, 2021, 42(2): 556-563. |
| [59] | Zhu W H, Xu X D, Zheng J, et al. The characteristics of abnormal wintertime pollution events in the Jing-Jin-Ji region and its relationships with meteorological factors[J]. Science of the Total Environment, 2018, 626: 887-898. DOI:10.1016/j.scitotenv.2018.01.083 |
| [60] | Liu N, Zhou S, Liu C S, et al. Synoptic circulation pattern and boundary layer structure associated with PM2.5 during wintertime haze pollution episodes in Shanghai[J]. Atmospheric Research, 2019, 228: 186-195. DOI:10.1016/j.atmosres.2019.06.001 |
| [61] | Zhang L Y, Cheng Y, Zhang Y, et al. Impact of air humidity fluctuation on the rise of PM mass concentration based on the high-resolution monitoring data[J]. Aerosol and Air Quality Research, 2017, 17(2): 543-552. DOI:10.4209/aaqr.2016.07.0296 |