 2024, Vol. 45


人类生产活动排放了过多温室气体, 导致全球气温上升和极端天气的频繁发生[1]. 为减少温室气体CO2的排放, 降低极端气候的发生, 世界各国间积极加强合作, 提出了各自应对全球气候危机的行动方案. 2021年中国政府向国际社会公布了自己的碳排放计划《2030年前碳达峰行动方案》, 制定了实现碳达峰碳中和的具体任务、目标、时间表和路线图. 低碳发展已成为各国应对气候变化的必然选择[2], 碳达峰和碳中和就是碳排放与经济发展的脱钩, 即经济发展不再过度依赖化石能源.
现有研究碳排放影响因素的文献多应用IPAT模型、Kaya恒等式、STIRPAT模型以及其扩展模型等, 有研究表明:人口、城镇化率、产业结构和经济增长对碳排放呈现正向的影响[3~ 9]. 研究碳排放与经济发展之间的关系多采取环境库兹涅茨曲线研究方法, 发现中国经济发展与碳排放呈倒U型关系[10, 11], 表明经济发展与碳排放之间存在关联现象. 脱钩理论最早由经济合作与发展组织提出, 其用来研究经济发展与环境压力之间的关联度. Tapio[12]将LMDI分解引入到脱钩理论, 根据脱钩指标将研究对象分3种状态8种情形[13]. 使用LMDI分解和Tapio脱钩模型, 计算贡献率和脱钩努力系数, 研究某地区的碳排放的驱动机制和脱钩状态[14]. 应用LMDI分解和Tapio脱钩模型分析某行业、工业区和城市群工业增长与碳脱钩的关系[15~ 17], 以及各影响因素对人均碳排放量的贡献量和贡献率[18]. 可见, LMDI分解与Tapio模型多被用来分析经济增长与影响碳排放因素的脱钩情况[13, 19~ 21], 以及具体行业经济增长与碳排放的脱钩情形[22~ 24]. 现有研究多基于Kaya恒等式的IPAT模型, 通过LMDI分解和Tapio脱钩模型研究影响碳排放的因素, 及其对经济发展的影响[25~ 29].
为了满足Kaya恒等式, 在IPAT模型LMDI分解过程中会引入新的变量[29], 其中部分新增变量往往缺乏明确的经济学含义. 为此, 本文将STIRPAT模型通过LMDI分解与Tapio脱钩模型相结合, 构建统计回归系数与碳变化量及脱钩弹性系数之间的数量关系, 而无需增加新变量来满足Kaya恒等式. 碳变化量和脱钩弹性指数吸收了STIRPAT模型的统计回归系数, 使其包含数据的统计信息. STIRPAT模型LMDI分解法与满足Kaya恒等式的IPAT模型LMDI分解法碳变化量和脱钩弹性指数相比, 相同变量的碳变化量和脱钩弹性指数更符合数据统计的结果, 更能全面反映研究对象的实际情况.
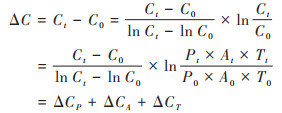
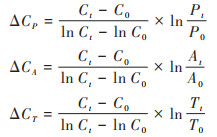
1 材料与方法 1.1 Kaya恒等式和STIRPAT模型的LMDI分解IPAT模型是研究人口(P)、富裕程度(A)和技术水平(T)对环境压力(I)的理论模型, 其一般表达式为[6]:I = P × A × T. 用C表示碳排放量, P表示人口, A = G/P表示人均地区生产总值(G为地区生产总值), T = C/G表示技术水平. 于是满足Kaya恒等式, 研究碳排放的IPAT模型表达式为:C = P × A × T = P × G/P × C/G. 使用Kaya恒等式的LMDI分解法[30~ 33], 计算IPAT模型在不同时间段的碳排放变化量, 令t期的碳排放量为Ct, 基期的碳排放量为C0, 基期和t期的碳变化量ΔC为:
|
(1) |
其中:
|
(2) |
式中ΔCP、ΔCA和ΔCT分别表示:人口、人均地区生产总值和技术水平引起的碳变化量.
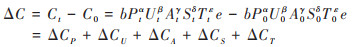
Dietz等在IPAT模型基础上提出了STIRPAT模型[34], 成为研究碳排放与其影响因素之间因果关系的主要理论模型之一, STIRPAT模型可以写为:C = b × Pα× Aβ × Tγ× e. 式中, C为碳排放量, b为常数项, α、β和γ为需要估计的指数项, e为误差项. 扩展STIRPAT模型只需满足乘法形式, 而不需要严格满足Kaya恒等式. 本文选择人口P, 城镇化率U(U = PU/P, 其中PU为城镇常住人口), 人均地区生产总值A, 工业产值占比S(S = Gind/G, 其中Gind为工业产值)和能源强度T(T = E/G, 其中E为能源消耗量)5个变量作为影响碳排放的因素[35~ 37]. 于是, 扩展STIRPAT模型可以写为:C = b × Pα×Uβ×Aγ × Sδ × Tε × e. 式中, α、β、γ、δ和ε为统计回归系数, 即变量每变化1%引起碳排放量变动的百分比. 上述碳排放的变量都是增加碳排放的因素, 因此统计回归系数应当大于0. 参照式(1)对扩展STIRPAT模型进行LMDI分解, 基期和t期之间的碳变化量ΔC为:
|
(3) |
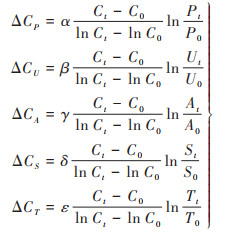
式中, ΔCP、ΔCU、ΔCA、ΔCS和ΔCT分别表述为:
|
(4) |
式中, ΔCP、ΔCU、ΔCA、ΔCS和ΔCT分别表示人口、城镇化率、人均地区生产总值、工业产值占比和能源强度的碳变化量. 对比式(2)和式(4)可以看出, 式(4)碳变化量不仅与各变量的当期和基期的比值有关, 而且还与回归系数α、β、γ、δ和ε的数值有关.
为对比Kaya恒等式和扩展STIRPAT模型LMDI分解的异同, 同样选取人口、城镇化率、人均地区生产总值、工业产值占比和能源强度作为主要变量, 构造满足Kaya恒等式的IPAT模型, 表达式为:C = P × PU/P × G/P × Gind/G × E/G × G/PU× P/Gind× C/E = P × U × A × S × T ×Lab×Pci× F. 可见, 满足Kaya恒等式的IPAT模型中变量的系数为1. 为满足Kaya恒等式, 式中增加了G/PU、P/Gind和C/E这3项. 参照文献[29], G/PU定义为技术水平(Lab), P/Gind定义为实体经济的人口承载强度(Pci), C/E定义为能源碳排放系数(F). 根据式(1)和式(2)可以得到新增变量所对应的碳变化量:ΔCLab、ΔCPci和ΔCF.
扩展STIRPAT模型LMDI分解与Kaya恒等式LMDI分解不同之处在于:①扩展STIRPAT模型中各变量的碳变化量与模型中的统计回归系数α、β、γ、δ和ε的数值有关;②在初始选取相同变量的前提下, 为满足Kaya恒等式, IPAT模型需要在原有假设的基础上增加新的变量, 而STIRPAT模型则不需要;③从式(2)和式(4)可知, 两种模型中相同变量的碳变化量在数值上相差一个与统计回归系数的乘积, 将统计回归系数每变化1%引起碳排放量变动百分比的统计学含义, 扩展为变量的变动引起碳变化量的倍数;④统计回归方法将假设变量以外的影响因素纳入统计回归常数和回归系数中, 满足Kaya恒等式的IPAT模型则不存在统计误差, 部分新增加的变量往往缺乏实际的经济学意义.
1.2 Tapio脱钩模型经济发展的脱钩模型是指经济发展到一定阶段后, 经济发展不再与能源消耗或环境污染成正相关关系, 即经济的发展与资源消耗(或环境污染)实现脱钩, 经济的增长不再会引起环境进一步恶化. Tapio脱钩模型的弹性指数见公式(5)[12, 20, 21, 33]:
|
(5) |
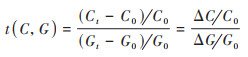
式中, t(C, G)表示与碳排放量和地区生产总值有关的脱钩弹性指数, ΔC和ΔG分别表示t期与基期之间的碳排放和地区生产总值的变化量, ΔC/C0和ΔG/G0分别表示碳排放增加率和地区生产总值增加率. 根据脱钩弹性指数t(C, G)以及ΔC/C0和ΔG/G0的符号和数值可以判定碳排放与经济发展是否存在脱钩, 将脱钩程度分为脱钩、连接和负脱钩3种类型, 又可将其进一步分为8种情形, 详见表 1[12~ 15]. 从中可以看出, 脱钩状态是经济发展不再过度依赖化石能源消耗, 经济发展和碳排放处于一个合理的比例范围;负脱钩状态是经济发展与碳排放处于失调状态, 为维持经济增长或防止经济衰退, 而增加化石能源的消耗;连接状态为经济和碳排放处于同步增加或减少的情形.
|
|
表 1 碳排放与经济增长脱钩状态划分标准 Table 1 Criteria for decoupling between economic development and carbon emissions |
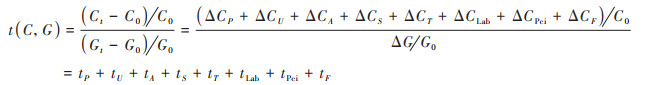
为探究影响碳排放的各变量对碳排放与经济增长之间脱钩的贡献数值, 将式(1)代入式(5)中, 得到满足Kaya恒等式IPAT模型(8个变量)的脱钩弹性指数, 见公式(6):
|
(6) |
式中, tP、tU、tA、tS和tT分别表示影响碳排放变量的人口、城镇化率、人均地区生产总值、工业产值占比和能源强度对总脱钩弹性指数的贡献值, tLab、tPci和tF分别表示技术水平、实体经济的人口承载强度和能源碳排放系数对总脱钩弹性指数的贡献值. 从式(6)可知:①STIRPAT模型统计回归计算的脱钩弹性指数和满足Kaya恒等式的脱钩弹性指数, 在统计回归精度内数值是相同的;②两种模型中相同变量的脱钩指数相差一个与统计回归系数的乘积;③各变量的脱钩弹性指数的数值大于0, 说明该变量对碳排放有促进作用, 对脱钩起阻碍作用;反之, 该变量对碳排放有阻碍作用, 对脱钩起促进作用, 促使经济发展向脱钩状态转化[33].
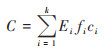
2 碳排放量估算和回归分析 2.1 碳排放量的估算和数据来源本文碳排放主要指温室气体CO2排放, 只考虑本地化石能源消费量所产生的CO2量, 估算公式如下:
|
(7) |
式中, C为碳排放总量, i为化石能源种类, Ei为第i类化石能源消费量, fi为第i种化石能源标准煤折算系数, ci为第i种化石能源碳排放系数, k为本地化石能源消费种类总数. 表 2为化石能源标准煤折算系数和碳排放系数[38~ 40].
|
|
表 2 不同类型化石能源的标准煤折算系数和碳排放系数1) Table 2 Calculation parameters of carbon emissions for different types of fossil energy |
本文选取重庆市2001~2019年的碳排放数据作为研究对象, 其中能源消耗数据来源于国家统计局网站的能源消耗分省统计数据, 其他数据来源于2001~2019年的《重庆市统计年鉴》. 按照式(7)对重庆市2001~2019年原煤、焦炭、原油、汽油、煤油、柴油、燃料油和天然气这8种主要化石能源的碳排放进行核算. 为了消除价格因素的影响, 本文以2001年为基期, 将名义地区生产总值和工业产值换算为实际地区生产总值和工业产值, 其他变量也做了相应的换算.
2.2 STIRPAT模型统计回归分析为应用统计回归方法获得STIRPAT模型中的回归系数, 对扩展STIRPAT模型两边取对数, 得到:lnC = lnb +α lnP + βlnU + γlnA + δlnS + εlnT + e. 为了避免伪回归, 先对数据进行共线性检验, 发现每个变量的方差膨胀因子(VIF)远大于10, 表明各变量之间存在较严重的共线性, 见表 3. 现有研究多采用最小二乘法[40]、偏最小二乘法[41, 42]和岭回归[35~ 37, 40, 43~ 46]等, 采用时间序列数据进行统计回归. 为消除共线性对统计回归结果的影响, 岭回归方法是学者使用较多的回归方法. 为此, 本文采用岭回归方法和时间序列数据对STIRPAT模型进行统计回归分析(使用Stata软件的Ridgereg软件包). 为了找到合适的岭系数kr值, 利用Ridgereg软件包中的广义岭回归程序自动确定岭系数kr值, 再使用该软件包中的普通岭回归调整kr值大小, 以找到最佳显著水平的回归系数, 见表 4.
|
|
表 3 重庆市STIRPAT模型的方差膨胀因子(VIF) Table 3 VIF of the STIRPAT model in Chongqing |
|
|
表 4 重庆市碳排放与各变量的岭回归拟合结果1) Table 4 Ridge regression fitting results of carbon emissions and various variables in Chongqing |
从表 4可以看出, 在5个变量的STIRPAT模型中除城镇化率外其他变量的显著程度都通过了5%假设检验, 拟合优度R2为0.998 7. 删除显著程度数值较大的变量城镇化率, 重新回归发现4个变量的显著程度都在1%以内, 拟合优度R2为0.998 5. 从5个变量和4个变量的拟合优度数值来看, 城镇化率对回归的贡献并不明显. 5个变量和4个变量的STIRPAT模型, 其回归系数均大于0, 符合变量选取的理论假设. 两种情况对应变量回归系数的数值相对变化最大在17.73%以下, 岭回归方法给出了较稳定的统计回归结果. STIRPAT模型中回归得到的回归系数与IPAT模型中的系数相比, 人口的回归系数数值增加3倍多, 城镇化率、人均地区生产总值和工业产值占比的系数数值减少, 而能源强度的系数的数值接近1, 其与IPAT模型中能源强度系数相同. 为确保数据精度能够满足脱钩模型对数据的要求, 将变量回归系数代入到扩展STIRPAT模型的对数表达式中, 用得到的STIRPAT模型预测值与估算值进行对比. 5个变量和4个变量的碳排放的预测值与估算值的差距都在0.02%~2.85%之间, 统计回归所得到的结果是可靠的, 可用于脱钩模型的分析, 见表 5.
|
|
表 5 STIRPAT模型中5个变量和4个变量预测值精度 Table 5 Accuracy of five variables and four variable prediction values in the STIRPAT model |
3 结果与讨论 3.1 碳变化量比较
从式(2)和式(4)可知STIRPAT模型与IPAT模型的LMDI分解中, 相同变量的碳变化量数值相差一个回归系数的乘积. 从图 1可以看出两种模型中相同的变量的碳变化量数值随时间变化趋势相同. 从2001~2019年STIRPAT模型中增加碳排放的主要变量是人均地区生产总值, 减少碳排放主要变量是能源强度;IPAT模型中增加碳排放的主要变量是人均地区生产总值和技术水平, 减少碳排放主要变量是能源强度和实体经济的人口承载强度, 见图 1.

|
图 1 STIRPAT模型(5个变量)和IPAT模型(8个变量)碳变化量随时间的变化情况 Fig. 1 STIRPAT model (five variables) and the IPAT model (eight variables) explore the changes in carbon emissions over time |
图 2是删除城镇化率变量后的STIRPAT模型, 而满足Kaya恒等式IPAT模型为:C = P × G/P × Gind /G × E/G × G/Gind× C/E = P ×A × S × T × D × F, 新增2项, 一项为:Gind/G, 另一项为:C/E. 前者为新增变量, 其含义不明确, 这里定义为“经济工业承载度(D)”, 后者为能源碳排放系数(F).

|
图 2 STIRPAT模型(4个变量)和IPAT模型(6个变量)碳变化量随时间的变化情况 Fig. 2 STIRPAT model (four variables) and the IPAT model (six variables) explore the changes in carbon emissions over time |
图 2与图 1类似, 两个模型中相同变量的碳变化数值随时间的变化趋势相同. 从2001~2019年来看, 两个模型中相同变量中的人均地区生产总值和人口是增加碳排放的因素, 工业产值占比在2014年开始成为减少碳排放的因素, 能源强度在大多数年份是减少碳排放的因素;IPAT模型中, 新增的2个变量经济工业承载度和能源碳排放系数在大多数年份都是减少碳排放的因素.
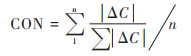
为比较两种方法中, 各变量影响碳排放的具体数值差异, 本文使用贡献率[14]来刻画各变量的碳变化占总的碳变化量情况. 贡献率是衡量各因素对碳排放影响的度量, 其数值等于碳变化量绝对值与各变量的碳变化量绝对值之和的比值, 见式(8). 对于不同变量, 贡献率数值越高的变量, 其对碳排放的影响程度越强.
|
(8) |
式中, ΔC为某一变量的碳变化量, CON为n年贡献率的平均值. 从表 6可以看出, IPAT模型中的人口的贡献率平均值只有1.61%(8个变量)或2.90%(6个变量), 在所有变量中贡献最少. STIRPAT模型中统计回归系数为3.117 4(5个变量)和2.564 6(4个变量), 将人口的贡献率扩大到11.32%(5个变量)和9.90%(4个变量), 超过了城镇化率(5个变量)和工业产值占比(5个变量), 在增加碳排放的因素中处于第2位(5个变量). 上述表明, 在STIRPAT模型LMDI分解中, 变量人口的贡献率获得了提升, 这符合人类活动是增加碳排放的主要因素的客观现实. 用STIRPAT模型LMDI分解法计算的各碳变化量的数值更符合研究对象的实际情况.
|
|
表 6 STIRPAT模型和IPAT模型的碳变化量贡献率/% Table 6 Contribution of carbon change in STIRPAT model and IPAT model/% |
3.2 脱钩指数的比较
从表 5可知, STIRPAT模型碳排放回归预测值和IPAT模型中的碳排放估算值在误差范围内是相同的. 因此, 这两个模型刻画的总的弹性指数也相同. 为展示重庆市2001~2019年经济发展与碳排放的脱钩情形, 分别用数字1~8表示扩张负脱钩、强负脱钩、弱负脱钩、衰退连接、增长连接、衰退脱钩、弱脱钩和强脱钩8种脱钩情形, 见图 3和图 4. 从图 3中的纵坐标可以看出, 重庆市的经济发展与碳排放脱钩呈现出4种情形:强脱钩、弱脱钩、增长连接和扩张负脱钩, 其中强脱钩和弱脱钩共13次, 增长连接3次, 扩张负脱钩2次.

|
图 3 2001~2019年重庆市经济发展与碳排放脱钩情形 Fig. 3 Decoupling situation between economic development and carbon emissions in Chongqing from 2001 to 2019 |

|
图 4 STIRPAT模型和IPAT模型相同变量2001~2019年重庆市经济发展与碳排放脱钩情形对比 Fig. 4 Comparison of the decoupling situation between economic development and carbon emissions in Chongqing from 2001 to 2019 using the same variables in the STIRPAT and IPAT models |
脱钩弹性指数刻画了经济发展与碳排放两者之间的关系, 但无法解释碳排放量变化背后的具体影响因素所起的作用. 为此, 对脱钩弹性指数进行LMDI分解. 根据式(6)各变量弹性指数的贡献率与碳排放变化的贡献率相同. STIRPAT模型与IPAT模型中相同变量的碳变化量相差一个统计回归系数的乘积, 导致其脱钩弹性指数也相差一个统计回归系数的乘积. 图 4中纵坐标显示, 除了人均地区生产总值的脱钩情形不同外, 两种模型其他相同变量的脱钩情形是相同的. 对比图 1和图 4发现, 总的脱钩情形不等于各脱钩情形的相加.
从图 5中可以看到, 在STIRPAT模型的5个变量中, 人均地区生产总值、城镇化率、工业产值占比和人口4个变量的脱钩弹性指数在多数年份都大于0, 其为增加碳排放的因素, 阻碍碳脱钩;能源强度大多年份小于0, 其为减少碳排放的因素, 促进碳脱钩. IPAT模型中新增加的3个因素中, 技术水平大于0, 其是增加碳排放的因素, 阻碍了碳脱钩;人口承载强度小于0和能源碳排放系数在多数年份小于0, 它们是减少碳排放的因素, 促进碳脱钩. 从图 6可以看出, 两种模型中相同影响因素的变化趋势相同, 在IPAT模型中新增的经济工业承载度在大多数年份小于0, 促进碳脱钩.

|
图 5 STIRPAT模型(5个变量)和IPAT模型(8个变量)脱钩弹性指数随时间的变化情况 Fig. 5 Decoupling elasticity index over time of the STIRPAT model (five variables) and the IPAT model (eight variables) |

|
图 6 STIRPAT模型(4个变量)和IPAT模型(6个变量)脱钩弹性指数随时间的变化 Fig. 6 Decoupling elasticity index over time of the STIRPAT model (four variables) and the IPAT model (six variables) |
满足Kaya恒等式的IPAT模型中新增的变量也能成为增加或减少碳排放的因素, 但是其前提是这些新增变量要有明确的经济学意义. 从统计回归结果看, 各变量的回归系数都大于0, 说明各变量都是增加碳排放的因素. 在碳变化量和弹性脱钩指数中有部分变量却成为了减少碳排放的因素, 其原因是碳变化量和弹性脱钩指数表征了变量的相对变化, 只要变量每年递减, 其对应的碳变化量和弹性脱钩指数就会成为减少碳排放的因素, 反之其是增加碳排放的因素.
4 结论(1)STIRPAT模型LMDI分解法和基于Kaya恒等式LMDI分解法在计算总的碳变化量和脱钩弹性指数时两种方法在误差范围内是一致的, 判定的脱钩情形也相同. STIRPAT模型LMDI分解将STIRPAT模型的统计回归系数引入到碳变化量之中, 并通过回归系数将STIRPAT模型与Tapio脱钩模型相关联, 拓展了两个模型各自的应用范围.
(2)STIRPAT模型LMDI分解法主要是在模型初始设定时可能犯遗漏变量的错误, 导致现有变量不能客观全面地表征研究对象. 基于Kaya恒等式LMDI分解法, 会在模型中引入新的变量, 由于满足了恒等式, 不需要对数据进行回归.
(3)统计回归系数的引入导致两种方法中的个别变量的地位不同, 如:人口变量在满足Kaya恒等式的IPAT模型中贡献率位于末位, 而在STIRPAT模型(5变量)的贡献率则上升到第2位. 统计回归系数纳入到了STIRPAT模型的碳变化量和弹性脱钩指数中, 使其更具有统计学意义.
(4)实证表明:STIRPAT模型LMDI分解法与基于Kaya恒等式LMDI分解法一样可以用来计算各个变量的碳变化量和脱钩指数, 可规避为满足恒等式而新增缺乏经济学意义的变量问题, 能体现数据的统计回归结果, 全面反映研究对象的实际情况.
| [1] | Baker H S, Millar R J, Karoly D J, et al. Higher CO2 concentrations increase extreme event risk in a 1.5℃ world[J]. Nature Climate Change, 2018, 8(7): 604-608. DOI:10.1038/s41558-018-0190-1 |
| [2] | Shi Y B, Zhao X X, Jang C L, et al. Decoupling effect between economic development and environmental pollution: a spatial-temporal investigation using 31 provinces in China[J]. Energy & Environment, 2019, 30(5): 755-775. DOI:10.3969/j.issn.1671-5292.2019.05.020 |
| [3] | York R, Rosa E A, Dietz T. A rift in modernity? Assessing the anthropogenic sources of global climate change with the STIRPAT model[J]. International Journal of Sociology and Social Policy, 2003, 23(10): 31-51. DOI:10.1108/01443330310790291 |
| [4] | Shi A Q. The impact of population pressure on global carbon dioxide emissions, 1975-1996: evidence from pooled cross-country data[J]. Ecological Economics, 2003, 44(1): 29-42. DOI:10.1016/S0921-8009(02)00223-9 |
| [5] | Wang Z H, Yin F C, Zhang Y X, et al. An empirical research on the influencing factors of regional CO2 emissions: evidence from Beijing City, China[J]. Applied Energy, 2012, 100: 277-284. DOI:10.1016/j.apenergy.2012.05.038 |
| [6] |
吴振信, 石佳. 基于STIRPAT和G(1, 1)模型的北京能源碳排放影响因素分析及趋势预测[J]. 中国管理科学, 2012, 20(S2): 803-809. Wu Z X, Shi J. The influencing factor analysis and trend forecasting of Beijing energy carbon emission based on STIRPAT and GM(1, 1) model's[J]. Chinese Journal of Management Science, 2012, 20(S2): 803-809. |
| [7] | Zhou X Y, Zhang J, Li J P. Industrial structural transformation and carbon dioxide emissions in China[J]. Energy Policy, 2013, 57: 43-51. DOI:10.1016/j.enpol.2012.07.017 |
| [8] | Tian X, Chang M, Shi F, et al. How does industrial structure change impact carbon dioxide emissions? A comparative analysis focusing on nine provincial regions in China[J]. Environmental Science & Policy, 2014, 37: 243-254. |
| [9] | Shahbaz M, Loganathan N, Muzaffar A T, et al. How urbanization affects CO2 emissions in Malaysia? The application of STIRPAT model[J]. Renewable and Sustainable Energy Reviews, 2016, 57: 83-93. DOI:10.1016/j.rser.2015.12.096 |
| [10] |
林伯强, 蒋竺均. 中国二氧化碳的环境库兹涅茨曲线预测及影响因素分析[J]. 管理世界, 2009(4): 27-36. Lin B Q, Jiang Z J. A forecast for China's environmental Kuznets curve for CO2 emission, and an analysis of the factors affecting China's CO2 emission[J]. Journal of Management World, 2009(4): 27-36. |
| [11] |
郑丽琳, 朱启贵. 中国碳排放库兹涅茨曲线存在性研究[J]. 统计研究, 2012, 29(5): 58-65. Zheng L J, Zhu Q G. Study on existence of environmental Kuznets curve of carbon emissions in China[J]. Statistical Research, 2012, 29(5): 58-65. DOI:10.3969/j.issn.1002-4565.2012.05.008 |
| [12] | Tapio P. Towards a theory of decoupling: degrees of decoupling in the EU and the case of road traffic in Finland between 1970 and 2001[J]. Transport Policy, 2005, 12(2): 137-151. DOI:10.1016/j.tranpol.2005.01.001 |
| [13] | Chen J D, Wang P, Cui L B, et al. Decomposition and decoupling analysis of CO2 emissions in OECD[J]. Applied Energy, 2018, 231: 937-950. DOI:10.1016/j.apenergy.2018.09.179 |
| [14] |
侯丽朋, 王琳, 钱瑶, 等. "双碳"目标下闽三角碳排放脱钩状态及驱动机制分析[J]. 生态学报, 2022, 2022 42(23): 9663-9676. Hou L P, Wang L, Qian Y, et al. Decoupling status and driving mechanisms of carbon emissions in the golden triangle of southern Fujian under "carbon peaking and neutrality" goals[J]. Acta Ecologica Sinica, 2022, 2022 42(23): 9663-9676. |
| [15] |
赖文亭, 王远, 黄琳琳, 等. 福建省行业碳排放驱动因素分解及其与经济增长脱钩关系[J]. 应用生态学报, 2020, 31(10): 3529-3538. Lai W T, Wang Y, Huang L L, et al. Decomposition of driving factors of industry-related CO2 emissions and its decoupling with economic growth in Fujian Province, China[J]. Chinese Journal of Applied Ecology, 2020, 31(10): 3529-3538. |
| [16] |
陈四瑜, 刘晶茹, 孙光明. 基于脱钩指数的工业园区碳排放与经济发展关系[J]. 环境科学, 2023, 44(11): 6412-6420. Chen S Y, Liu J R, Sun G M. Relationship between carbon emissions and economic development of industrial parks based on decoupling index[J]. Environmental Science, 2023, 44(11): 6412-6420. |
| [17] |
刘伟, 毛显强, 李巍, 等. 黄河流域城市群工业增长与碳排放脱钩关系研究[J]. 环境工程技术学报, 2023, 13(2): 849-856. Liu W, Mao X Q, Li W, et al. Study on decoupling relationship between industrial growth and carbon dioxide emission in the urban agglomeration in the Yellow River Basin[J]. Journal of Environmental Engineering Technology, 2023, 13(2): 849-856. |
| [18] |
陈涛, 李晓阳, 陈斌. 中国碳排放影响因素分解及峰值预测研究[J]. 安全与环境学报, 2024, 24(1): 396-406. Chen T, Li X Y, Chen B. Decomposition of influencing factors and peak prediction of carbon emissions in China[J]. Journal of Safety and Environment, 2024, 24(1): 396-406. |
| [19] | Roinioti A, Koroneos C. The decomposition of CO2 emissions from energy use in Greece before and during the economic crisis and their decoupling from economic growth[J]. Renewable and Sustainable Energy Reviews, 2017, 76: 448-459. DOI:10.1016/j.rser.2017.03.026 |
| [20] |
吴一帆, 许杨, 唐洋博, 等. 长江经济带二氧化碳净排放时空演变特征及脱钩效应[J]. 环境科学, 2023, 44(3): 1258-1266. Wu Y F, Xu Y, Tang Y B, et al. Temporal and spatial characteristics of net CO2 emissions and decoupling analysis in Yangtze River economic belt[J]. Environmental Science, 2023, 44(3): 1258-1266. |
| [21] |
李芸邑, 刘利萍, 刘元元. 长江经济带工业污染排放空间分布格局及其影响因素[J]. 环境科学, 2021, 42(8): 3820-3828. Li Y Y, Liu L P, Liu Y Y. Spatial distribution pattern and influencing factors of industrial pollution emissions in Yangtze River economic belt[J]. Environmental Science, 2021, 42(8): 3820-3828. |
| [22] | Zhou X, Zhang M, Zhou M H, et al. A comparative study on decoupling relationship and influence factors between China's regional economic development and industrial energy-related carbon emissions[J]. Journal of Cleaner Production, 2017, 142: 783-800. DOI:10.1016/j.jclepro.2016.09.115 |
| [23] | Wang Q, Jiang R. Is China's economic growth decoupled from carbon emissions?[J]. Journal of Cleaner Production, 2019, 225: 1194-1208. DOI:10.1016/j.jclepro.2019.03.301 |
| [24] | Lu Q L, Yang H, Huang X J, et al. Multi-sectoral decomposition in decoupling industrial growth from carbon emissions in the developed Jiangsu Province, China[J]. Energy, 2015, 82: 414-425. DOI:10.1016/j.energy.2015.01.052 |
| [25] |
吴开亚, 何彩虹, 王桂新, 等. 上海市交通能源消费碳排放的测算与分解分析[J]. 经济地理, 2012, 32(11): 45-51. Wu K Y, He C H, Wang G X, et al. Measurement and decomposition analysis on carbon emissions of transportation industry in Shanghai[J]. Economic Geography, 2012, 32(11): 45-51. |
| [26] |
林涛, 赵涛, 康纪东, 等. 中国区域工业碳排放测算与影响因素分析——以天津市为例[J]. 西安电子科技大学学报(社会科学版), 2013, 23(1): 36-42. Lin T, Zhao T, Kang J D, et al. Estimates and analysis of influencing factors of china's regional industrial carbon emissions: case study of Tianjin[J]. Journal of Xidian University (Social Science Edition), 2013, 23(1): 36-42. |
| [27] |
庄颖, 夏斌. 广东省交通碳排放核算及影响因素分析[J]. 环境科学研究, 2017, 30(7): 1154-1162. Zhuang Y, Xia B. Estimation of CO2 emissions from the transport sector in Guangdong Province, China and analysis of factors affecting emissions[J]. Research of Environmental Sciences, 2017, 30(7): 1154-1162. |
| [28] |
李健, 景美婷, 苑清敏. 绿色发展下区域交通碳排放测算及驱动因子研究——以京津冀为例[J]. 干旱区资源与环境, 2018, 32(7): 36-42. Li J, Jing M T, Yuan Q M. Estimation of carbon emission and driving factors in Beijing-Tianjin-Hebei traffic under green development[J]. Journal of Arid Land Resources and Environment, 2018, 32(7): 36-42. |
| [29] |
林寿富, 王善勇, Marinova D, 等. STIRPAT模型的改进及其应用[J]. 统计与决策, 2018, 34(16): 32-34. Lin S F, Wang S Y, Marinova D, et al. Improvement and application of STIRPAT model[J]. Statistics & Decision, 2018, 34(16): 32-34. |
| [30] |
胡怀敏, 左薇, 徐士元. 长江经济带交通能源碳排放脱钩效应及驱动因素研究[J]. 长江流域资源与环境, 2022, 31(4): 862-877. Hu H M, Zou W, Xu S Y. Decoupling effect and driving factors of transportation energy carbon emission in Yangtze River economic belt[J]. Resources and Environment in the Yangtze Basin, 2022, 31(4): 862-877. |
| [31] |
胡程, 丁正山, 穆学青, 等. 长江经济带旅游交通碳排放时空演变及驱动因素[J]. 南京师大学报(自然科学版), 2022, 45(1): 40-48. Hu C, Ding Z S, Mu X Q, et al. The spatio-temporal evolution and driving factors of carbon dioxide emissions from tourism transportation in the Yangtze River economic belt[J]. Journal of Nanjing Normal University (Natural Science Edition), 2022, 45(1): 40-48. |
| [32] | Ang B W. The LMDI approach to decomposition analysis: a practical guide[J]. Energy Policy, 2005, 33(7): 867-871. DOI:10.1016/j.enpol.2003.10.010 |
| [33] |
刘源, 李向阳, 林剑艺, 等. 基于LMDI分解的厦门市碳排放强度影响因素分析[J]. 生态学报, 2014, 34(9): 2378-2387. Liu Y, Li X Y, Lin J Y, et al. Factor decomposition of carbon intensity in Xiamen city based on LMDI method[J]. Acta Ecologica Sinica, 2014, 34(9): 2378-2387. |
| [34] | Dietz T, Rosa E A. Rethinking the environmental impacts of population, affluence and technology[J]. Human Ecology Review, 1994, 1(2): 277-300. |
| [35] |
颜伟, 黄亚茹, 张晓莹, 等. 基于STIRPAT模型的山东半岛蓝色经济区碳排放预测[J]. 济南大学学报(自然科学版), 2021, 35(2): 125-131. Yan W, Huang Y R, Zhang X Y, et al. Prediction of carbon emission in Shandong Peninsula blue economic zone based on STIRPAT model[J]. Journal of University of Jinan (Science and Technology), 2021, 35(2): 125-131. |
| [36] |
余明成, 徐占军, 余健. 山西省CO2排放影响因素研究及情景分析[J]. 环境科学研究, 2018, 31(8): 1357-1365. Yu M C, Xu Z J, Yu J. Influencing factors of CO2 emission and scenario analysis in Shanxi Province[J]. Research of Environmental Sciences, 2018, 31(8): 1357-1365. |
| [37] |
黄蕊, 王铮. 基于STIRPAT模型的重庆市能源消费碳排放影响因素研究[J]. 环境科学学报, 2013, 33(2): 602-608. Huang R, Wang Z. Influencing factors of carbon emissions from energy consumptions in Chongqing based on STIRPAT model[J]. Acta Scientiae Circumstantiae, 2013, 33(2): 602-608. |
| [38] | 程豪. 碳排放怎么算——《2006年IPCC国家温室气体清单指南》[J]. 中国统计, 2014, 395(11): 28-30. |
| [39] |
任晓松, 赵国浩. 中国工业碳排放及其影响因素灰色预测分析——基于STIRPAT模型[J]. 北京交通大学学报(社会科学版), 2014, 13(4): 18-24. Ren X S, Zhao G H. Gray forecasting of China's industrial carbon emissions and its influencing factors——a study based on the STIRPAT model[J]. Journal of Beijing Jiaotong University (Social Sciences Edition), 2014, 13(4): 18-24. |
| [40] |
胡茂峰, 郑义彬, 李宇涵. 多情景下湖北省交通运输碳排放峰值预测研究[J]. 环境科学学报, 2022, 42(4): 464-472. Hu M F, Zheng Y B, Li Y H. Forecasting of transport carbon emission peak in Hubei Province under multiple scenarios[J]. Acta Scientiae Circumstantiae, 2022, 42(4): 464-472. |
| [41] |
刘茂辉, 刘胜楠, 李婧, 等. 天津市减污降碳协同效应评估与预测[J]. 中国环境科学, 2022, 42(8): 3940-3949. Liu M H, Liu S N, Li J, et al. Evaluation and prediction of the synergistic effect of pollution reduction and carbon reduction in Tianjin[J]. China Environmental Science, 2022, 42(8): 3940-3949. |
| [42] |
刘茂辉, 岳亚云, 刘胜楠, 等. 基于STIRPAT模型天津减污降碳协同效应多维度分析[J]. 环境科学, 2023, 44(3): 1277-1286. Liu M H, Yue Y Y, Liu S N, et al. Multi-dimensional analysis of the synergistic effect of pollution reduction and carbon reduction in Tianjin based on the STIRPAT model[J]. Environmental Science, 2023, 44(3): 1277-1286. |
| [43] |
潘崇超, 王博文, 侯孝旺, 等. 基于LMDI-STIRPAT模型的中国钢铁行业碳达峰路径研究[J]. 工程科学学报, 2023, 45(6): 1034-1044. Pan C C, Wang B W, Hou X W, et al. Carbon peak path of the Chinese iron and steel industry based on the LMDI-STIRPAT model[J]. Chinese Journal of Engineering, 2023, 45(6): 1034-1044. |
| [44] |
姚明秀, 王淼薇, 雷一东. 基于STIRPAT模型的上海市碳达峰预测研究[J]. 复旦学报(自然科学版), 2023, 62(2): 226-237. Yao M X, Wang M W, Lei Y D. Research on Shanghai carbon peak forecast based on STIRPAT model[J]. Journal of Fudan University (Natural Science), 2023, 62(2): 226-237. |
| [45] |
潘栋, 李楠, 李锋, 等. 基于能源碳排放预测的中国东部地区达峰策略制定[J]. 环境科学学报, 2021, 41(3): 1142-1152. Pan D, Li N, Li F, et al. Mitigation strategy of Eastern China based on energy-source carbon emission estimation[J]. Acta Scientiae Circumstantiae, 2021, 41(3): 1142-1152. |
| [46] |
孔令晖, 罗明科, 余辉, 等. 长江中游湖南段湖泊重金属时空累积因素研究[J]. 中国环境科学, 2023, 43(4): 1812-1823. Kong L H, Luo M K, Yu H, et al. Spatial-temporal accumulation factors of heavy metals in Hunan lakes along the middle reach of the Yangtze River[J]. China Environmental Science, 2023, 43(4): 1812-1823. |