 2022, Vol. 43


2. 自然资源部生态地球化学重点实验室, 北京 100037
2. Key Laboratory of Eco-geochemistry, Ministry of Natural Resource, Beijing 100037, China
抗生素可以杀死或抑制细菌的生长, 在医疗、水产养殖和畜禽等行业中发挥了重要作用[1].然而, 近年来抗生素因其对微生物群落安全产生威胁以及进入环境后可能促进自身耐药基因的发展而备受关注[2].氯霉素(CAP)作为一种广谱抗生素, 广泛用于治疗革兰氏阳性/阴性菌及食用动物[3].由于易对人体造成严重毒副作用和致癌特性, 欧盟、美国、澳大利亚、日本和中国等许多国家已经禁止在食品中使用CAP[4].然而, 因其价格低且疗效好, 至今仍被用于药物(如眼部感染)、畜牧业和水产养殖业中[5].此外, CAP可以通过土壤生物而自然产生, 然后转移到植物(如秸秆)、甚至动物体内[6], 最终可能影响人类健康.因此, 环境中CAP的污染及迁移转化行为一直备受关注.吸附作用是CAP在环境中迁移的重要方式之一[7].有研究已深入探讨了水生环境中沉积物和土壤对CAP的吸附作用及其影响因素[8, 9].近期天然胶体(NCs)由于对污染物具有较高活性和迁移能力而引起学者关注[10, 11].
NCs是指一维粒径为1 nm~1 μm, 且具有不同粒径、结构、表面化学和化学成分的多相混合物, NCs普遍存在于水体、沉积物和土壤等环境介质中[12, 13].并且, NCs的粒径和成分密切相关.例如, 水中NCs的荧光强度随相对分子质量增大而减小[14]. NCs的这些理化性质可进一步抑制或促进环境中污染物的迁移能力[12, 15].目前有关NCs对抗生素吸附行为的研究主要关注标准物质(如Aldrich腐殖质和黏土)、工程纳米粒子(如碳管和金属氧化物)或生物炭等[16~18].而关于NCs对抗生素吸附行为的影响机制仍不清楚.有机质是NCs中的重要组成部分, 有研究发现NCs可以改变吸附动力学过程, 但对吸附等温过程的影响较小[19].虽然类腐殖质胶体会促进土霉素(OTC)在沉积物中的吸附, 但类蛋白质胶体则抑制这一过程, 这与其芳香性、亲水性和极性有关[19].沉积物中不同组分NCs对OTC的吸附也具有相似规律[7].Yu等[20]使用多种分析技术和方法, 发现样品中60~80 nm粒径范围的NCs最多, 且对抗生素的吸附起主要作用.目前NCs已被细分为不同粒径和组分的NCs, 以探究其对污染物吸附过程的影响.然而, 相关研究却较少关注NCs理化性质对抗生素在“土-NCs-溶解相”三相吸附体系中的作用.
因此, 本文选取不同来源及污染特性的湖泊沉积物和土壤, 并提取土样中的NCs, 同时结合切向超滤技术、动态光散射(DLS)、紫外-可见吸收光谱(UV-vis)和三维荧光光谱(3D-EEMs)等多种纳米技术, 在表征NCs理化特征的基础上, 分析“土-NCs-溶解相”三相吸附体系中不同介质的吸附率及其影响因素, 以期为环境中抗生素的环境归趋研究及污染防治提供理论支持.
1 材料与方法 1.1 样品采集与处理于2019年分别采集了鄱阳湖河湖交错区(与抚河交汇处)和南昌市区内湖(象湖)两处沉积物样品, 以及人工花圃和油菜花田两处土壤样品, 样品信息详见表 1.所有样品均经冷冻干燥后研磨过100目筛, 此过筛土样命名为S0.
|
|
表 1 沉积物和土壤的基本理化性质 Table 1 Physical and chemical properties of the sediments and soils |
取适量S0样品, 接着加入30%的H2O2溶液以去除有机碳, 并在40℃加热板上间歇搅拌以加速反应[21], 重复上述步骤3次, 得到的样品命名为S1.再取适量S0样品, 接着加入1 mol·L-1 HCl以去除无机碳, 最后通过滴加1 mol·L-1 NaOH使得pH值为中性, 得到的样品命名为S2.分别取适量S0、S1和S2样品, 并按水土比10∶1加入Milli-Q超纯水, 振荡24 h后, 以3 500 r·min-1转速离心15 min, 重复两次, 收集S0样品体系的上清液, 并命名为W0, 其余固体样品在60℃的烘箱中干燥, 得到的样品分别命名为S3、S4和S5.
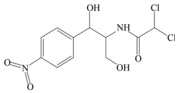
1.2 试剂与标准CAP购自J&K(中国), 其化学性质见表 2.甲醇(色谱纯)购自CNW技术有限公司(德国).本研究使用的所有化学品至少为分析纯.CAP储备液(0.5 g·L-1)在Milli-Q水中制备, 并根据需要稀释至合适的浓度.
|
|
表 2 CAP基本理化参数 Table 2 Physicochemical properties of CAP |
1.3 吸附实验 1.3.1 三相体系吸附实验
基于批处理实验和超滤离心管(Millipore Amicon Ultra, USA)进行CAP三相吸附实验.为了获得足够的NCs, 在15 mL离心管中加入1 g土样及不同浓度的CAP溶液(1~20 mg·L-1).同时加入0.1 g·L-1的NaN3抑制生物活性[9].密封好后置于(25±1)℃的黑暗环境中振荡, 以避免潜在的光降解.对照实验为不加入固体样品的CAP溶液.在达到平衡后(预实验表明3 d已足够达到吸附平衡), 以3 500 r·min-1转速离心15 min.然后将上清液转移到超滤离心管中.根据超滤离心管的要求在4 000 r·min-1转速下离心60 min(该条件下NCs回收率最高).最后, 上清液和过滤液采用高效液相色谱仪(Agilent 1260)进行测定.仪器配有Athena C18柱(150 mm×2.1 mm, 5 μm), CAP检测波长为273 nm, 柱温为40℃, 进样量为5 μL.流动相为超纯水(30%)和甲醇(70%), 流速为0.2 mL·min-1.三相吸附体系中CAP的回收率为(93±5)%.
1.3.2 NCs的吸附实验切向超滤处理前, 采用0.45 μm滤膜过滤上清液W0, 并用Milli-Q超纯水将上清液稀释至1 L, 最后加入CAP储备液使得最终浓度为5 mg·L-1.接着将含NCs和CAP的混合溶液搅拌平衡6 h后, 采用相对分子质量(截留孔径)为100×103、10×103和1×10³ (PES膜, 5×10⁻³ m2, Vivaflow 50, 赛多利斯)的超滤膜对过滤液(< 0.45 μm)进行逐级超滤得到不同相对分子质量的NCs溶液.切向超滤方法参照前期研究[14].超滤过程中所有胶体浓缩液的浓度倍数(cf)均为10.最后得到100×103~0.45 μm、10×103~100×103和1×10³~10×103的胶体浓缩液和 < 100×103、< 10×103和 < 1×10³的超滤液.
1.4 NCs理化性质分析 1.4.1 NCs粒径采用Zeta-sizer分析仪(Malvern)检测NCs粒径.为避免絮凝, 测定前利用超声法对NCs进行30 min超声处理.连续测样3次, 取平均值.
1.4.2 光谱测定用Milli-Q超纯水做空白, 使用紫外-可见分光光度计(UV3300, 美普达, 上海)测定样品的吸光度, 扫描波长为200~800 nm, 扫描间隔为1 nm.
使用荧光分光光度计(日立F-7100)测定样品3D-EEMs.仪器参数如下:响应时间为自动; 激发波长(Ex)为200~450 nm, 间隔为5 nm; 发射波长(Em)为250~600 nm, 间隔为2 nm; PMT电压为700 V, 扫描速度为30 000 nm·min-1, 扫描间隔为5 nm.测定前用Milli-Q超纯水做空白.同时, 根据样品浓度使用Milli-Q超纯水对样品进行不同浓度的稀释, 使其在254 nm波长下的吸光度小于0.3, 从而去除样品的内滤效应[23].
1.5 数据分析 1.5.1 光谱指数UV254即波长254 nm处的吸光度, 可表征胶体的芳香度, 且该值越大其组分中不饱和键越多[24]. UV253/UV220为波长253 nm和220 nm处吸光度的比值, 可表征芳环上的取代基种类和取代程度.该值越大, 则芳环上的取代基以酯类、羧基和羟基等为主; 反之, 则以脂肪链为主[25].
荧光指数(FI)定义为Ex=370 nm时, Em在450 nm和500 nm处的荧光强度比值, 可用于表征胶体中荧光物质的来源.当FI值小于并接近1.4时, 表明荧光物质以陆源为主; FI值大于并接近1.9时, 表明荧光物质以内源性代谢产物为主[26].生物源指数(BIX) 定义为Ex=310 nm时, Em在380 nm和430 nm处的荧光强度比值, 可表征有机质自生源的相对贡献.当BIX在0.8~1.0时, 具有较强的自生源性特征, 而当BIX<0.6时, 有机质主要来自于外源[27, 28].腐殖化指数(HIX)定义为Ex=254 nm时, Em在435~480 nm和300~350 nm的区域积分比值, 可表征有机质组分的腐殖化程度.当HIX值在10~16时, 表现出显著的腐殖质特征; 当HIX值< 4时, 表明腐殖质特征较弱且以自生源为主[23, 29].
1.5.2 平行因子分析法(PARAFAC)利用3D-EEMs数据建立PARAFAC模型, 分析NCs的荧光组成.采用Matlab软件的DOMFluor工具箱对样品进行PARAFAC模型解析[30].在建模之前, 对所有3D-EEMs进行拉曼和瑞利散射校正[31].此外, 使用Milli-Q超纯水在Ex=350 nm时的拉曼散射峰面积, 将所有样品的荧光强度归一化为拉曼单位(R.U.)[32].通过残差分析、裂半分析和目视检查确定合适的组分.最后用最大荧光强度(Fmax)表示该组分的相对含量[33].
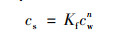
1.5.3 等温吸附模型CAP初始浓度采用线性[式(1)]和非线性[Freundlich模型, 式(2); Langmuir模型, 式(3)]模型拟合沉积物和土壤对CAP的吸附过程, 得到的吸附系数分别为Kd、Kf和KL.
线性模型:

|
(1) |
Freundlich模型:
|
(2) |
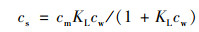
Langmuir模型:
|
(3) |
式中, cw和cs分别为液相中CAP浓度(mg·L-1)和土样中CAP含量(mg·kg-1); Kd表示线性吸附的分配系数(L·kg-1); Kf为Freundlich模型的吸附系数(L1/n·mg1-1n·kg-1); n表示表面吸附点位不均质性的非线性吸附指数; KL为Langmuir模型的吸附系数(L·mg-1); cm表示最大吸附容量(mg·kg-1).
此外, 有机碳归一化吸附容量KOC由土样总有机碳含量计算得到, 见式(4).

|
(4) |
土样样品及相应NCs的粒径分布如图 1所示.可以看出, 所有样品都有两个主要的粒径范围, 且每个样品的最小粒径范围都与其NCs的粒径分布相对应.其中, Sed.-P样品的最大粒径分别为0.26 μm和7.7 μm, Sed.-X样品的最大粒径分别为0.34 μm和11.57 μm, Soil-FN样品的最大粒径分别为0.17 μm和10.10 μm, Soil-ORF样品的最大粒径分别为0.34 μm和11.57 μm.因此, Sed.-P样品的粒径总体来说是最小的.对于NCs的粒径分布, Sed.-P、Sed.-X、Soil-FN和Soil-ORF样品的主要粒径峰值分别为220、342、342和190 nm, 说明Sed.-P和Soil-ORF样品的NCs粒径相对较小.此外, Sed.-X和Soil-FN的NCs粒径分布比Sed.-P和Soil-ORF更集中, 说明其NCs粒径差异较小.

|
图 1 样品粒径分布 Fig. 1 Size distribution of the samples |
相对分子质量不同的NCs的光谱指数(UV254、UV253/UV220、FI、BIX和HIX)分布特征分别见图 2和图 3.各土样均以NCs相对分子质量为100×103~0.45 μm的UV254值最大[图 2(a)], 其中Sed.-P样品中NCs相对分子质量为100×103~0.45 μm的UV254值远高于其他相对分子质量的, 说明该NCs的芳香度高且不饱和键较多.由图 2(b)可知, 各相对分子质量NCs的UV253/UV220值均以Soil-FN最小, 表明Soil-FN样品的NCs芳环上以脂肪链为主、酯类等官能团较多.并且, 所有样品中NCs相对分子质量为100×103~0.45 μm的UV253/UV220值均较高, 说明相对分子质量大的NCs芳环上含有更加丰富的羧基、羟基和羰基等官能团.此外, 从图 2可以看出, 河湖沉积物(Sed.-P和Sed.-X) NCs的UV254值和UV253/UV220值总体来说大于天然土壤NCs(Soil-FN和Soil-ORF), 这表明与天然土壤NCs相比, 河湖沉积物NCs具有更高的芳香度及更多的含氧官能团.这与三峡库区表层沉积物NCs芳香性高于土壤NCs的结果一致[34].

|
图 2 不同沉积物和土壤中NCs的UV254和UV253/UV220值 Fig. 2 UV254and UV253/UV220 of NCs in different sediments and soils |

|
图 3 不同沉积物和土壤中NCs的荧光指数 Fig. 3 Fluorescence indices of NCs in different sediments and soils |
由图 3(a)可知, 各NCs的FI值均值在1.30~1.51之间, 表明NCs有机质组分是陆源输入和藻类、浮游生物等内源产生的混合输入.其中, 以Soil-FN样品NCs的FI值更大(>1.4), 表明其NCs有机质组分具有自生源特征.此外, 随相对分子质量减小, FI值呈增加趋势, 即相对分子质量小的NCs中内源物质组分更多, 这与三峡库区消落带水中不同相对分子质量NCs的荧光特征一致[35].各NCs的BIX值范围为0.64~0.88, 且BIX值随相对分子质量变化的趋势与FI值一致, 说明相对分子质量小的NCs自生源可能性更大.由图 3(c)可知, 各NCs的HIX范围在1.91~9.81之间, 其中, 只有Soil-ORF中相对分子质量为1×10³~10×103的NCs的HIX值大于8, 表明该NCs腐殖化程度较高.且随NCs相对分子质量减小, HIX值呈增加趋势, 说明相对分子质量小的NCs腐殖化程度较高.
2.1.2.2 基于PARAFAC的荧光光谱特征分析通过PARAFAC对样品进行3D-EEMs解析, 共得到C1、C2、C3和C4这4个组分(图 4).通过收敛系数(tucker convergence coefficient, TCC), 将4种荧光组分与在线OpenFluor数据库中的模型进行对比以判定物质组成(表 3).其中, C1的荧光峰位置是235 (310) nm/414 nm, 为陆源类腐殖质[36]; C2的荧光峰位置是255 (365) nm/474 nm, 为类腐殖质物质[37]; C3的荧光峰位置是230 nm/462 nm, 为类腐殖质物质[38]; C4的荧光峰位置是230 (280) nm/346 nm, 为色氨酸[39].

|
图 4 PARAFAC解析出的4种荧光组分 Fig. 4 Four fluorescence components identified using PARAFAC |
|
|
表 3 OpenFlour数据库中PARAFAC荧光组分的鉴定 Table 3 Identification of the PARAFAC components according to the OpenFlour database |
所选沉积物和土壤中不同相对分子质量NCs的4种荧光组分的荧光强度分布情况见图 5.经计算, 100×103~0.45 μm、10×103~100×103和1×10³~10×103这3个相对分子质量NCs的荧光强度占总荧光强度的比例分别为21.80%~55.67%、13.30%~37.17%和24.96%~48.79%, 均值分别为40.07%、22.87%和37.07%.其中, C1、C2和C3的荧光强度在NCs为1×10³~10×103时达最大值, 而C4在NCs为100×103~0.45 μm时达最大值, 说明类腐殖物质主要存在于相对分子质量小的NCs中, 类蛋白质物质主要存在于相对分子质量大的NCs中.Cuss等[40]的研究也发现水生环境中微生物类腐殖质NCs组分相对分子质量为(1.6±0.15)×103.C1~C4组分占该土样NCs总荧光强度的比例分别为45.67%~53.47%、12.43%~57.94%、11.50%~31.57%和3.11%~25.72%, 表明所选沉积物和土壤中类腐殖质含量较高, 而类蛋白物质含量较低.此外, 不同样品总荧光强度大小依次为Sed.-P>Soil-FN>Sed.-X>Soil-ORF, 说明与天然土壤相比, 河湖沉积物中荧光物质的含量相对较多.

|
图 5 沉积物和土壤NCs中4个荧光组分的荧光强度 Fig. 5 Fluorescent intensity of the four fluorescence components in NCs from the different sediments and soils |
沉积物和土壤(S0~S5)不同组分对CAP的吸附等温过程如图 6所示.线性、Freundlich模型和Langmuir模型的拟合参数如表 4和图 7所示.总体而言, Freundlich模型对S0和S2的拟合效果较好(R2>0.98); 线性模型对S1、S3、S4和S5的拟合效果较好(R2>0.96).而Langmuir模型的R2值低于前两个模型或介于两者之间, 表明该模型不能很好地拟合所有样品的吸附过程, 这与之前的研究结果一致[41, 42].因此, 后续对S0和S2的吸附过程分析选择Freundlich模型, 而对S1、S3、S4和S5的吸附过程分析选择线性模型.以上结果说明, S0和S2对CAP的吸附是非线性过程, 而S1和所有不含NCs的组分(S3、S4和S5) 对CAP的吸附则是线性过程, 以分配吸附为主[43].

|
图 6 沉积物和土壤不同组分对CAP的吸附等温线 Fig. 6 CAP sorption isotherms of different fractions of sediments and soils |
|
|
表 4 沉积物和土壤不同组分对CAP吸附的线性、Freundlich和Langmuir模型参数 Table 4 Parameters of line, Freundlich, and Langmuir models for CAP sorption on different fractions of sediments and soils |

|
图 7 沉积物和土壤不同组分的CAP吸附等温模型拟合 Fig. 7 Fitting graphs of sorption isotherms models for the sorption of CAP on the different fractions of sediments and soils |

|
图 8 沉积物和土壤不同组分的拟合Koc值 Fig. 8 Simulated Koc values of different fractions of sediments and soils |
在Freundlich模型中, Kf值表示吸附容量, n值是位点能量分布指数[44]. n=1代表线性吸附; n>1代表吸附过程主要为化学吸附; n < 1代表吸附过程主要为物理吸附[45]. S0的吸附容量为0.53~4.54 L1/n·mg 
有机碳归一化吸附容量(Koc)是指示CAP吸附亲和力的参数.在本研究中, S0、S1、S2、S3、S4和S5的Koc最大值分别为: 1.65、2.48、2.59、1.76、1.40和0.89 L·kg-1(表 4).总体来说, 含有NCs样品的Koc值相对较高, 这表明含有NCs的样品对CAP有更强的吸附亲和力.此外, 本研究使用各样品的最佳拟合吸附模型, 计算了不同CAP浓度下的Koc值(图 8).结果发现, 当CAP为低浓度时, S1和S4的吸附能力相较于其他组分样品低(除样品Sed.-X的S1外); 而当CAP为高浓度时, 各组分的吸附能力相差不大.这说明在低浓度CAP条件下, 去除有机物的土壤样品对CAP的吸附能力较低.这是因为在沉积物/土壤吸附CAP的过程中, 由于CAP分子结构中存在苯环和硝基等官能团而使其成为主要电子受体, 因而易与有机物中的极性芳环发生π-π相互作用[48, 49].当沉积物/土壤中的有机物被去除后, 其对CAP的吸附能力显著降低, 尤其是去除了NCs的S4样品.而随着CAP浓度的增加, 由于有机物表面的吸附位点逐渐减少, 因此不同组分对CAP的吸附差异也逐渐减小.
Koc拟合值和吸附参数的相关性分析结果如图 9所示.当CAP浓度为0.000 1、0.001、0.01、0.1和1 mg·L-1时, Koc拟合值之间为显著正相关关系(R>0.87, P < 0.01), 且R2值随CAP浓度增加而降低.这说明随CAP浓度增加, 沉积物/土壤不同组分对CAP的吸附能力发生改变, 且差距逐渐加大, 这与上文中样品不同组分对CAP的吸附行为在不同浓度存在差异的分析结果一致.不同CAP浓度下Koc拟合值与Kf值(R>0.74, P < 0.01)和cm(R>0.54, P < 0.01)均呈极显著正相关, 而与n值呈极显著负相关(R<-0.72, P < 0.01).此外, Kf值与Kd值(R=0.47, P=0.02)和cm (R=0.64, P < 0.01)呈正相关, 和n值呈负相关.结果表明不同吸附模型的拟合结果是一致的.

|
1. Koc(0.000 1), 2. Koc(0.001), 3. Koc(0.01), 4. Koc(0.1), 5. Koc(1), 6.TOC, 7. Kd, 8. Kf, 9. n, 10. KL, 11. cm; **表示显著性水平, P < 0.01, *表示显著性水平, P < 0.05(双尾) 图 9 吸附参数间的相关性 Fig. 9 Intercorrelations among the sorption parameters |
本研究进一步计算了所有含NCs样品(即S0、S1和S2) 的“土-NCs-溶解相”三相吸附体系中三者的吸附率(图 10).结果表明, CAP主要存在于溶解相中(平均值为80.63%), 其次为土样(平均值为14.21%). S0、S1和S2中NCs的吸附率均值分别为4.46%、3.93%和6.61%, 表明有机质含量高的NCs对CAP的吸附量更高.土壤有机质上含有多种官能团, 如羟基、氨基、羰基和酚羟基等, 这些官能团能参与到土壤吸附抗生素的过程中, 并对吸附产生重要作用[50, 51].但Li等[52]的研究也指出, 当表面吸附占主导时, 去除有机质会使土壤矿物中更多的吸附位点暴露出来, 从而促进磺胺甲唑在红壤和水稻土中的表面吸附.此外, 三相吸附率随CAP浓度的增加呈不规则变化, 这与前文分析结果一致, 即在相对较高的CAP浓度下(cw>0.1 mg·L-1, 图 8), Koc拟合值没有明显变化.

|
(a) S0-Sed.-P, (b)S1-Sed.-P, (c)S2-Sed.-P, (d)S0-Sed.-X, (e)S1-Sed.-X, (f)S2-Sed.-X, (g)S0-Soil-FN, (h) S1-Soil-FN, (i)S2-Soil-FN, (j)S0-Soil-ORF, (k)S1-Soil-ORF, (l)S2-Soil-ORF 图 10 CAP在“土-NCs-溶解相”三相体系的吸附率 Fig. 10 Sorption rate of CAP for the ternary system of "solid phase-NCs-soluble phase" |
不同相对分子质量胶体浓缩液中CAP浓度及吸附率如图 11所示.由图 11(a)可知, 两种沉积物NCs中CAP浓度随相对分子质量的变化趋势相同, 即NCs中CAP浓度随相对分子质量减小呈增加趋势.而两种天然土壤NCs则以相对分子质量为10×103~100×103时CAP浓度最大.类似地, 不同相对分子质量NCs的吸附率也存在相似规律[图 11(b)], 即两种沉积物NCs均以相对分子质量为1×10³~10×103时对CAP的吸附率更大, 而两种天然土壤NCs均以相对分子质量为10×103~100×103时对CAP的吸附率最大.此外, 本研究用分配系数Kd值来衡量CAP在胶体相和真溶解相中的分配关系情况[53].由图 11(c)可知, 所有Kd值均大于1, 表明NCs对CAP有更强的吸附能力.除Soil-ORF样品中NCs相对分子质量为1×10³~10×103的Kd值外, 其他样品的Kd值均随着NCs相对分子质量的减小呈不同程度增加的趋势, 表明在一定程度上, CAP更易分配在相对分子质量小的NCs上.有研究也表明, 随相对分子质量减小, 生物炭胶体的比表面积和孔容增大, 菲、阿特拉津和土霉素在生物炭胶体上的吸附容量均增加[54].另外, 从整体上看, Soil-FN和Soil-ORF中NCs各相对分子质量的Kd值略大于Sed.-P和Sed.-X, 表明NCs在同一相对分子质量中, CAP更倾向于分配在天然土壤NCs中.

|
图 11 CAP在不同胶体中的吸附参数 Fig. 11 Sorption parameters of CAP with different colloids |
结合2.2节中CAP在“土-NCs-溶解相”三相吸附体系中的结果, 经换算可得到CAP在土、不同相对分子质量NCs和溶解相中的吸附率, 结果如图 12所示.可以看出, 总体上仍以溶解相中CAP占主导, 其次为土样, NCs中的占比以相对分子质量为100×103~0.45 μm时最少.虽然Sed.-X样品的土样部分对CAP的吸附率最高, 但其NCs的吸附率并不是最高的, 这可能是因为该样品中的NCs浓度不高、相对分子质量较大.

|
图 12 CAP在各相中的吸附率 Fig. 12 Sorption rate of CAP with different phases |
选取NCs理化性质和CAP吸附指标开展冗余分析(RDA), 前两轴NCs理化性质和CAP吸附指标的相关累计解释量达到97.25%, 其中, 第一排序轴的解释量为97.24%, 第二排序轴仅为0.01%, 说明第一排序轴能够更好地解释CAP吸附指标和NCs理化性质的相关关系.NCs理化性质和CAP吸附指标的RDA结果见图 13.可以看出, NCs理化性质中FI、UV254、UV253/UV220、HIX和C1的连线与其他因子相比连线更长, 可知这5种NCs理化性质对CAP吸附指标起到了很好地解释作用.其中, FI值与Kd值呈显著正相关关系, 表明NCs中内源性代谢产物为主的荧光物质越多, 对CAP的吸附能力越强.UV254、UV253/UV220值和胶体吸附率呈负相关关系, 即组分中不饱和键和芳环上取代基中羧基等种类越多, 对CAP的吸附贡献就越小, 这可能是因为羧基等含氧官能团会发生解离, 水分子可能通过氢键竞争吸附位点, 导致对污染物的吸附容量下降[7].BIX和HIX为极显著负相关关系, 这表明自生源贡献率低和陆源贡献率高的物质其腐殖化程度也高.而HIX和3个吸附参数均存在显著正相关关系, 表明类腐殖质物质对CAP的吸附具有促进作用, 这与C1和吸附率的表征意义一致.吸附率、Kd与C4荧光组分呈极显著负相关关系, 表明C4表示的色氨酸类蛋白物质对CAP的吸附具有抑制作用.而C3和C4荧光组分与UV254值和UV253/UV220值均存在正相关关系, 表明NCs的芳香度和芳环上极性官能团含量增加, 其荧光组分含量也随之增加.

|
图 13 NCs理化性质和CAP吸附指标的冗余分析 Fig. 13 Redundancy analysis of colloidal physicochemical properties and sorption index of CAP |
(1) 光谱参数分析表明, 不同相对分子质量NCs有机质组分为外源和内源的混合输入, 且相对分子质量小的NCs自生源特征更为显著; 另外, PARAFAC模型共解析出4个荧光组分, 且河湖沉积物中荧光物质的相对含量较多.
(2) Freundlich模型可较好地拟合有机质组分较高的样品对CAP的吸附过程, 而线性模型对无机组分较多及不含NCs的样品对CAP吸附的拟合效果较好.且与原始样品相比, 有机组分的吸附容量更高, 尤其是低浓度CAP条件下; Koc值表明, 有NCs的样品对CAP有更高的吸附亲和力.
(3) 所有NCs的吸附分配系数Kd值均大于1, 表明NCs对CAP有更强的吸附能力, 且CAP更容易被相对分子质量小的NCs所吸附; RDA分析结果表明, NCs来源、芳香性、芳环上的有氧官能团、腐殖化程度和类腐殖物质等是影响沉积物和土壤NCs对CAP的吸附能力的关键因子.
| [1] | Jiang X S, Liu L Q, Chen J F, et al. Antibiotic resistance genes and mobile genetic elements in a rural river in Southeast China: occurrence, seasonal variation and association with the antibiotics[J]. Science of the Total Environment, 2021, 778. DOI:10.1016/j.scitotenv.2021.146131 |
| [2] | Cheng X X, Hou H B, Li R S, et al. Adsorption behavior of tetracycline on the soil and molecular insight into the effect of dissolved organic matter on the adsorption[J]. Journal of Soils and Sediments, 2020, 20(4): 1846-1857. DOI:10.1007/s11368-019-02553-7 |
| [3] | Guo N, Ma X F, Ren S J, et al. Mechanisms of metabolic performance enhancement during electrically assisted anaerobic treatment of chloramphenicol wastewater[J]. Water Research, 2019, 156: 199-207. DOI:10.1016/j.watres.2019.03.032 |
| [4] | Zhang J Y, Zhao R X, Cao L J, et al. High-efficiency biodegradation of chloramphenicol by enriched bacterial consortia: kinetics study and bacterial community characterization[J]. Journal of Hazardous Materials, 2020, 384. DOI:10.1016/j.jhazmat.2019.121344 |
| [5] | Xiao L L, Liu F H, Kumar P S, et al. Rapid removal of chloramphenicol via the synergy of Geobacter and metal oxide nanoparticles[J]. Chemosphere, 2022, 286. DOI:10.1016/j.chemosphere.2021.131943 |
| [6] |
张玲, 白军红, 梁金凤, 等. 基于CiteSpace文献计量的湖泊抗生素抗性基因研究进展与热点分析[J]. 环境科学学报, 2021, 42(1): 308-320. Zhang L, Bai J H, Liang J F, et al. Research progress and hot spot analysis of antibiotic resistance genes in lakes based on CiteSpace literature metrology[J]. Acta Scientiae Circumstantiae, 2021, 42(1): 308-320. |
| [7] | Zhang D, Yang S K, Wang Y N, et al. Adsorption characteristics of oxytetracycline by different fractions of organic matter in sedimentary soil[J]. Environmental Science and Pollution Research, 2019, 26(6): 5668-5679. DOI:10.1007/s11356-018-4028-1 |
| [8] | Zhang T, Wu B, Sun N, et al. Sorption and degradation of wastewater-associated pharmaceuticals and personal care products in agricultural soils and sediment[J]. Water Science & Technology, 2013, 68(5): 991-998. |
| [9] |
余绵梓, 袁啸, 李适宇, 等. 典型PPCPs在河流沉积物中的吸附特性[J]. 中国环境科学, 2019, 39(4): 1724-1733. Yu M Z, Yuan X, Li S Y, et al. Experimental and modeling study of sorption characteristics of selected PPCPs onto river sediments[J]. China Environmental Science, 2019, 39(4): 1724-1733. DOI:10.3969/j.issn.1000-6923.2019.04.046 |
| [10] | Nie M H, Yan C X, Xiong X Y, et al. Degradation of chloramphenicol using a combination system of simulated solar light, Fe2+ and persulfate[J]. Chemical Engineering Journal, 2018, 348: 455-463. DOI:10.1016/j.cej.2018.04.124 |
| [11] |
周旋, 晏彩霞, 鞠民, 等. 不同来源土样胶体对氯霉素吸附行为的影响[J]. 环境科学学报, 2020, 40(11): 4169-4179. Zhou X, Yan C X, Ju M, et al. Effects of different soil colloids on the sorption behavior of chloramphenicol[J]. Acta Scientiae Circumstantiae, 2020, 40(11): 4169-4179. |
| [12] | Lead J R, Wilkinson K J. Aquatic colloids and nanoparticles: current knowledge and future trends[J]. Environmental Chemistry, 2006, 3(3): 159-171. DOI:10.1071/EN06025 |
| [13] |
王沛芳, 包天力, 胡斌, 等. 天然胶体的水环境行为[J]. 湖泊科学, 2021, 33(1): 28-48. Wang P F, Bao T L, Hu B, et al. Environmental behaviors of natural colloids in water environment[J]. Journal of Lake Sciences, 2021, 33(1): 28-48. |
| [14] | Yan C X, Liu H H, Sheng Y R, et al. Fluorescence characterization of fractionated dissolved organic matter in the five tributaries of Poyang Lake, China[J]. Science of the Total Environment, 2018, 637-638: 1311-1320. DOI:10.1016/j.scitotenv.2018.05.099 |
| [15] | Lapworth D J, Stolpe B, Williams P J, et al. Characterization of suboxic groundwater colloids using a multi-method approach[J]. Environmental Science & Technology, 2013, 47(6): 2554-2561. |
| [16] | Dordio A V, Miranda S, Prates Ramalho J P, et al. Mechanisms of removal of three widespread pharmaceuticals by two clay materials[J]. Journal of Hazardous Materials, 2017, 323: 575-583. DOI:10.1016/j.jhazmat.2016.05.091 |
| [17] | Le Guet T, Hsini I, Labanowski J, et al. Sorption of selected pharmaceuticals by a river sediment: role and mechanisms of sediment or Aldrich humic substances[J]. Environmental Science and Pollution Research, 2018, 25(15): 14532-14543. DOI:10.1007/s11356-018-1684-0 |
| [18] | Yang F, Zhang Q, Jian H X, et al. Effect of biochar-derived dissolved organic matter on adsorption of sulfamethoxazole and chloramphenicol[J]. Journal of Hazardous Materials, 2020, 396. DOI:10.1016/j.jhazmat.2020.122598 |
| [19] | Wang Z Z, Jiang Q L, Wang R Z, et al. Effects of dissolved organic matter on sorption of oxytetracycline to sediments[J]. Geofluids, 2018(6). DOI:10.1155/2018/1254529 |
| [20] | Yu K F, Sun C, Zhang B, et al. Size-dependent adsorption of antibiotics onto nanoparticles in a field-scale wastewater treatment plant[J]. Environmental Pollution, 2019, 248: 1079-1087. DOI:10.1016/j.envpol.2019.02.090 |
| [21] | Wang L L, Niu J F, Yang Z F, et al. Effects of carbonate and organic matter on sorption and desorption behavior of polycyclic aromatic hydrocarbons in the sediments from Yangtze River[J]. Journal of Hazardous Materials, 2008, 154(1-3): 811-817. DOI:10.1016/j.jhazmat.2007.10.096 |
| [22] | Sun K, Shi Y, Wang X Y, et al. Organokaolin for the uptake of pharmaceuticals diclofenac and chloramphenicol from water[J]. Chemical Engineering Journal, 2017, 330: 1128-1136. DOI:10.1016/j.cej.2017.08.057 |
| [23] | Ohno T. Fluorescence inner-filtering correction for determining the humification index of dissolved organic matter[J]. Environmental Science & Technology, 2002, 36(4): 742-746. |
| [24] | Nishijima W, Speitel Jr G E. Fate of biodegradable dissolved organic carbon produced by ozonation on biological activated carbon[J]. Chemosphere, 2004, 56(2): 113-119. DOI:10.1016/j.chemosphere.2004.03.009 |
| [25] | Peuravuori J, Pihlaja K. Isolation and characterization of natural organic matter from lake water: comparison of isolation with solid adsorption and tangential membrane filtration[J]. Environment International, 1997, 23(4): 441-451. DOI:10.1016/S0160-4120(97)00049-4 |
| [26] | Jaffé R, Boyer J N, Lu X, et al. Source characterization of dissolved organic matter in a subtropical mangrove-dominated estuary by fluorescence analysis[J]. Marine Chemistry, 2003, 84(3-4): 195-210. |
| [27] | Salve P R, Lohkare H, Gobre T, et al. Characterization of chromophoric dissolved organic matter (CDOM) in rainwater using fluorescence spectrophotometry[J]. Bulletin of Environmental Contamination and Toxicology, 2012, 88(2): 215-218. DOI:10.1007/s00128-011-0424-7 |
| [28] |
卜鸡明, 何佳, 焦立新, 等. 滇池流域入湖河流溶解性有机质的分布及来源[J]. 环境科学学报, 2020, 40(8): 2795-2804. Bu J M, He J, Jiao L X, et al. Analysis of distribution characteristics and source of dissolved organic matter in the rivers that flow into the Dianchi Lake Basin[J]. Acta Scientiae Circumstantiae, 2020, 40(8): 2795-2804. |
| [29] | Zsolnay A, Baigar E, Jimenez M, et al. Differentiating with fluorescence spectroscopy the sources of dissolved organic matter in soils subjected to drying[J]. Chemosphere, 1999, 38(1): 45-50. DOI:10.1016/S0045-6535(98)00166-0 |
| [30] | Stedmon C A, Bro R. Characterizing dissolved organic matter fluorescence with parallel factor analysis: a tutorial[J]. Limnology and Oceanography, 2008, 6(11): 572-579. |
| [31] | Zepp R G, Sheldon W M, Moran M A. Dissolved organic fluorophores in southeastern US coastal waters: correction method for eliminating Rayleigh and Raman scattering peaks in excitation-emission matrices[J]. Marine Chemistry, 2004, 89(1-4): 15-36. DOI:10.1016/j.marchem.2004.02.006 |
| [32] | Lawaetz A J, Stedmon C A. Fluorescence intensity calibration using the Raman Scatter Peak of water[J]. Applied Spectroscopy, 2009, 63(8): 936-940. DOI:10.1366/000370209788964548 |
| [33] | Stedmon C A, Markager S, Bro R. Tracing dissolved organic matter in aquatic environments using a new approach to fluorescence spectroscopy[J]. Marine Chemistry, 2003, 82(3-4): 239-254. DOI:10.1016/S0304-4203(03)00072-0 |
| [34] |
李璐璐, 江韬, 闫金龙, 等. 三峡库区典型消落带土壤及沉积物中溶解性有机质(DOM)的紫外-可见光谱特征[J]. 环境科学, 2014, 35(3): 933-941. Li L L, Jiang T, Yan J L, et al. Ultraviolet-visible (UV-Vis) spectral characteristics of dissolved organic matter (DOM) in soils and sediments of typical water-level fluctuation zones of Three Gorges Reservoir areas[J]. Environmental Science, 2014, 35(3): 933-941. |
| [35] |
陈雪霜, 江韬, 卢松, 等. 三峡库区消落带水体DOM不同分子量组分三维荧光特征[J]. 环境科学, 2016, 37(3): 884-892. Chen X S, Jiang T, Lu S, et al. Three-dimensional fluorescence spectral characteristics of different molecular weight fractionations of dissolved organic matter in the water-level fluctuation zones of Three Gorges Reservoir areas[J]. Environmental Science, 2016, 37(3): 884-892. |
| [36] | Garcia R D, Reissig M, Queimalinos C P, et al. Climate-driven terrestrial inputs in ultraoligotrophic mountain streams of Andean Patagonia revealed through chromophoric and fluorescent dissolved organic matter[J]. Science of the Total Environment, 2015, 521-522: 280-292. DOI:10.1016/j.scitotenv.2015.03.102 |
| [37] | Peleato N M, Sidhu B S, Legge R L, et al. Investigation of ozone and peroxone impacts on natural organic matter character and biofiltration performance using fluorescence spectroscopy[J]. Chemosphere, 2017, 172: 225-233. DOI:10.1016/j.chemosphere.2016.12.118 |
| [38] | Murphy K R, Ruiz G M, Dunsmuir W T M, et al. Optimized parameters for fluorescence-based verification of ballast water exchange by ships[J]. Environmental Science & Technology, 2006, 40(7): 2357-2362. |
| [39] | Walker S A, Amon R M W, Stedmon C A. Variations in high-latitude riverine fluorescent dissolved organic matter: a comparison of large Arctic rivers[J]. Journal of Geophysical Research, 2013, 118(4): 1689-1702. DOI:10.1002/2013JG002320 |
| [40] | Cuss C W, Guéguen C. Determination of relative molecular weights of fluorescent components in dissolved organic matter using asymmetrical flow field-flow fractionation and parallel factor analysis[J]. Analytica Chimica Acta, 2012, 733: 98-102. DOI:10.1016/j.aca.2012.05.003 |
| [41] | Shen G X, Zhang Y, Hu S Q, et al. Adsorption and degradation of sulfadiazine and sulfamethoxazole in an agricultural soil system under an anaerobic condition: kinetics and environmental risks[J]. Chemosphere, 2018, 194: 266-274. DOI:10.1016/j.chemosphere.2017.11.175 |
| [42] | Conde-Cid M, Novoa-Muñoz J C, Fernández-Sanjurjo M J, et al. Pedotransfer functions to estimate the adsorption and desorption of sulfadiazine in agricultural soils[J]. Science of the Total Environment, 2019, 691: 933-942. DOI:10.1016/j.scitotenv.2019.07.166 |
| [43] | Weber J W, Young T M. A distributed reactivity model for sorption by soils and sediments. 6. Mechanistic implications of desorption under supercritical fluid conditions[J]. Environmental Science & Technology, 1997, 31(6): 1686-1691. |
| [44] | Hu M F, Liu L, Hou N, et al. Insight into the adsorption mechanisms of ionizable imidazolinone herbicides in sediments: kinetics, adsorption model, and influencing factors[J]. Chemosphere, 2021, 274. DOI:10.1016/j.chemosphere.2021.129655 |
| [45] | Desta M B, Lucia A. Batch sorption experiments: langmuir and Freundlich isotherm studies for the adsorption of textile metal ions onto teff straw (Eragrostis tef) agricultural waste[J]. Journal of Thermodynamics, 2013(1). DOI:10.1155/2013/375830 |
| [46] | Yan Q S, Zhang L Y, Jiang M L, et al. Sorption of chloramphenicol on pond sediments and the effect of coexistence Cu(Ⅱ)[J]. Water Science & Technology, 2013, 68(6): 1251-1257. |
| [47] | Revitt D M, Balogh T, Jones H. Sorption behaviours and transport potentials for selected pharmaceuticals and triclosan in two sterilised soils[J]. Journal of Soils and Sediments, 2015, 15(3): 594-606. DOI:10.1007/s11368-014-1025-y |
| [48] | Liao P, Zhan Z Y, Dai J, et al. Adsorption of tetracycline and chloramphenicol in aqueous solutions by bamboo charcoal: a batch and fixed-bed column study[J]. Chemical Engineering Journal, 2013, 228: 496-505. DOI:10.1016/j.cej.2013.04.118 |
| [49] | Di X, Wang X, Liu Y P, et al. Solid-phase extraction coupled with switchable hydrophilicity solvent-based homogeneous liquid-liquid microextraction for chloramphenicol enrichment in environmental water samples: a novel alternative to classical extraction techniques[J]. Analytical and Bioanalytical Chemistry, 2019, 411(4): 803-812. DOI:10.1007/s00216-018-1486-8 |
| [50] | Zhang Y, Huang F X, Wang L, et al. Facilitating effect of heavy metals on di(2-ethylhexyl) phthalate adsorption in soil: new evidence from adsorption experiment data and quantum chemical simulation[J]. Science of the Total Environment, 2021, 772. DOI:10.1016/j.scitotenv.2021.144980 |
| [51] |
马妍, 王童, 周生坤, 等. 地带性土壤对苯胺吸附行为的研究[J]. 环境工程, 2021, 39(10): 191-196, 156. Ma Y, Wang T, Zhou S K, et al. Study on adsorption behavior of aniline on zonal soil[J]. Environmental Engineering, 2021, 39(10): 191-196, 156. |
| [52] | Li X N, Song Y, Jia M Y, et al. Sorption and desorption characteristics of sulfamethazine in three different soils before and after removal of organic matter[J]. Pedosphere, 2021, 31(5): 796-806. DOI:10.1016/S1002-0160(21)60026-7 |
| [53] | Xia X H, Rabearisoa A H, Jiang X M, et al. Bioaccumulation of perfluoroalkyl substances by Daphnia magna in water with different types and concentrations of protein[J]. Environmental Science & Technology, 2013, 47(19): 10955-10963. |
| [54] | Hameed R, Lei C, Lin D H. Adsorption of organic contaminants on biochar colloids: effects of pyrolysis temperature and particle size[J]. Environmental Science and Pollution Research, 2020, 27(15): 18412-18422. DOI:10.1007/s11356-020-08291-5 |