 2022, Vol. 43

2. 广东省科学院生态环境与土壤研究所, 华南土壤污染控制与修复国家地方联合工程研究中心, 广东省农业环境综合治理重点实验室, 广东省面源污染防治工程技术研究中心, 广州 510650;
3. 梅州市国际水土保持研究院, 梅州 514000
 , HUANG Bin2,3 , YUAN Zai-jian2,3
 , WANG Dong-dong2,3 , WANG Quan-quan2,3 , CHEN Jia-cun2,3 , XIE Zhen-yue2,3
2. National-Regional Joint Engineering Research Center for Soil Pollution Control and Remediation in South China, Guangdong Key Laboratory of Integrated Agro-environmental Pollution Control and Management, Guangdong Engineering Research Center for Non-point Source Pollution Control, Institute of Eco-environmental and Soil Sciences, Guangdong Academy of Sciences, Guangzhou 510650, China;
3. International Institute of Soil and Water Conservation, Meizhou 514000, China
农业面源污染指农业活动过程中畜禽和水产养殖废水排放、化肥与农药流失和农村人类活动等因素导致污染物进入环境造成的污染[1, 2], 具有排放随机、过程复杂和不易被监测与控制等特征[3].中国是世界最大的集约化农业发展中国家之一[4], 从1978~2017年, 我国化肥年施用量从884万t增加到5 859万t, 农药年施用量由0.73万t增加到166万t, 但化肥和农药利用率不足1/3, 畜禽养殖粪污有效处理率不足1/2[5].农用化肥和农药的大量投入造成了严重的农业面源污染[6, 7], 我国农业的化学需氧量(COD)、总氮(TN)和总磷(TP)排放量分别占全部污染物排放总量的49.77%、51.97%和67.22%[8].
广东省是我国农业生产较发达的省份, 同时也是农业面源污染问题突出的地区之一[5, 9], 全省农业污染排放和农村生活排污占水体COD、TN和TP排放量的60.47%、56.74%和77.21%[10].近年来, 广东省城市化进程加快, 城市化率从1999年的31.18%上升到2019年的71.40%, 农业产业结构发生较大改变[4], 土地利用格局的改变会使得农业面源污染排放量与排放特征发生变化[11].但以往广东省农业面源污染研究集中在种植业、畜禽养殖业和农村人口这些方面[12, 13], 对水产养殖、农田固废和农村生活所产生的污染负荷有所忽视[4, 14], 且大多数农业面源污染负荷估算的研究集中在某个流域或者某个典型区域, 因此, 有必要对广东省的农业面源污染负荷的时空变化与来源进行全面分析与评估, 以期为广东省农业生态环境保护及治理提供理论依据.
1 材料与方法 1.1 研究方法与数据来源本研究采用清单分析法估算广东省农业面源污染负荷, 该方法不用考虑复杂的污染过程, 能够在较长的时间和较大的空间尺度上对面源污染负荷进行较准确的评估[13].空间上将广东省划分为粤东(汕头市、汕尾市、潮州市和揭阳市)、粤西(湛江市、茂名市和阳江市)、粤北(韶关市、河源市、梅州市、清远市和云浮市)和珠三角(广州市、佛山市、肇庆市、深圳市、东莞市、惠州市、珠海市、中山市和江门市)这4个区域进行对比研究.将农业面源污染源分为3类: 第一类是耕作过程中施用的化肥、农药和塑料等化学品以及农作物产品收获后产生的作物废物; 第二类是畜禽养殖和水产养殖产生的养殖业污染物; 第三类是农村地区居民的生活废弃物[5].农田固废很少被纳入评价面源污染的指标中, 但是由于在还田过程中微生物分解养分和径流冲刷联合作用[14], 农田固废仍具有潜在污染量[15, 16], 因此本研究将农田固废作为评价农业面源污染负荷指标之一.
为了在统一尺度上比较各类污染物, 根据文献[17]确定化学需氧量(COD)、总氮(TP)和总磷(TP)为主要的污染负荷指标, 并以化肥、畜禽养殖、水产养殖、农田固废和农村生活作为农业面源污染的污染源.化肥、农药和地膜的过度使用会增加温室气体排放和加剧耕地退化[16], 但是由于其排污系数难以获得[5], 因此引入排放强度来判断农业耕地投入要素污染现状.
本研究数据来源于文献[18, 19].农作物、化肥、农村生活和畜禽养殖的产污和排污系数参考文献[20~24]; 水产养殖产污和排污系数则依据文献中广东渔业各养殖类型占比, 选取池塘养殖作为主要养殖方式[22], 并根据文献[25, 26]进行系数修正, 其中是否引入沉积物对污染物吸附对水产养殖污染负荷排污系数的取值范围影响较大, 有研究表明, 鱼塘清淤和内源性养分释放同样会产生环境污染[27, 28], 因此为了避免高估或低估污染负荷本文中取化学分析法和物料平衡法所给出的两种排污系数的平均值以确定本文水产养殖产污排污系数.由于化肥施用后并不产生COD污染, 在计算COD负荷时, 化肥不作为计算指标.具体的计算指标、排污系数及其来源见表 1和表 2, 其中给出主要的污染负荷贡献单位的排污系数.
|
|
表 1 农业面源污染基本计算单位和数据来源 Table 1 List of the elementary unit and data sources of agricultural non-point source pollution |
|
|
表 2 农业面源污染排污系数和数据来源 Table 2 Discharge coefficient and data source of agricultural non-point source pollution |
 渔业养殖种类占比i×排污系数i
1.1.1 污染负荷计算
|
(1) |

|
(2) |
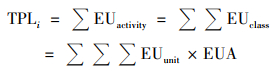
式中, TPLi为农业面源污染指标i的污染负荷量, i包括化学需氧量(COD)、总氮(TN)和总磷(TP); TPL(Total Pollution Loads)为农业面源污染总污染负荷; EUactivity为农业活动的污染源的污染负荷; EUclass为各类农业活动污染源中各类别的污染负荷; EUunit为各类农业活动污染源中各类别基本单元的污染负荷; EUA为EUunit的排污量, EUA由以下公式计算出.
|
(3) |

|
(4) |
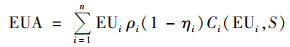
式中, EUi为基本单位; ρi为污染物产生系数; ηi为相关资源利用效率(%); PEi为农业面源污染物的产量; Ci为污染物排放系数, 由(EUi, S)所决定的; (EUi, S)为基本单位在不同的区域环境特点、水文条件、降雨、土壤、植被覆盖和各种社会政策的综合作用.该公式可以简化为式(4), Qi为i的排污系数, 即农业面源污染物的产量乘以排污系数.
1.1.2 投入强度计算
|
(5) |
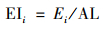
式中, EIi为i的单位投入强度(kg·hm-2), Ei为投入要素i的施用量, AL为i单位的作用面积(hm2).根据文献[12, 29]和本文数据计算结果, 确定化肥和农药面源污染程度分级.针对化肥污染, 将污染等级分为4个等级, 分别是化肥年投入强度小于225kg·hm-2的区域为无污染区, 225~500 kg·hm-2的区域为轻度污染区, 500~1 000 kg·hm-2的区域为中度污染区, 大于1 000 kg·hm-2的区域为重度污染区; 对于农药投入强度, 将污染等级分为3个等级, 施用量小于10 kg·hm-2的区域为轻度污染区, 10~30 kg·hm-2的区域为中度污染区, 大于30 kg·hm-2的区域为重度污染区.
1.2 分析方法农业生产要素投入量和农业污染负荷指标间的相关性采用Pearson相关分析计算, 显著性和极显著性水平分布设定为P < 0.05和P < 0.01.采用GraphPad Prism 9.0进行数据处理和作图.使用ArcGIS10.7进行空间分布计算.
2 结果与分析 2.1 农业面源污染负荷年际变化特征从图 1可以看出, 广东省农业面源污染总负荷由1999年的236.63×10⁴ t下降到2019年的222.40×10⁴ t, 降幅为6.08%. COD污染负荷由169.05×10⁴ t下降到148.96×10⁴ t, 降幅为11.88%; TN污染负荷从59.92×10⁴ t增加到62.91×10⁴ t, 增幅为4.99%, TP污染负荷从7.65×10⁴ t增加到9.66×10⁴ t, 增幅为26.17%.

|
图 1 1999~2019年广东省农业面源污染物总污染负荷、COD、TN和TP负荷 Fig. 1 Total non-point source pollutant, COD, TN, and TP loads of Guangdong province from 1999 to 2019 |
从广东省不同区域的污染负荷贡献率情况可以看出(图 2), 2019年总污染负荷贡献率表现为: 珠三角>粤西>粤北>粤东.2019年珠三角COD、TN和TP污染负荷贡献率相较于1999年分别下降了1.82%、4.19%和5.23%, 但仍为4个区域中最高; 粤东污染负荷贡献率为4个区域中最低, COD、TN和TP污染负荷贡献率下降了3.06%、3.68%、3.22%; 2016年之前粤西和粤北地区污染负荷贡献率基本保持不变, 2016年后污染负荷贡献率上升趋势较为明显, 相比于1999年, 2019年污染负荷贡献率分别增加了4.48%和1.31%.

|
图 2 1999~2019年珠三角、粤西、粤北和粤东地区的COD、TN和TP污染负荷贡献率 Fig. 2 Percent contributions of COD, TN, and TP loads of the Pearl River Delta, western Guangdong, northern Guangdong, and eastern Guangdong from 1999 to 2019 |
1999~2019年广东省COD的主要来源是畜禽养殖, TN的主要来源是化肥和畜禽养殖, TP的主要来源是畜禽养殖和水产养殖, 而农作物废弃物排污占比相对较低(图 3).值得注意的是水产养殖对不同污染物负荷的贡献均呈现出逐年上升的趋势, COD污染负荷贡献率由7.25%上升至15.15%, TN污染负荷贡献率从10.07%上升至16.60%, TP污染负荷贡献率从16.89%上升至23.79%.

|
图 3 1999~2019年广东省不同污染源污染负荷贡献率 Fig. 3 Percent contributions of different pollution sources to the total pollutant load of COD, TN, and TP of Guangdong province from 1999 to 2019 |
粤西和粤北COD和TN污染负荷贡献率结构较为类似, 且20年间各污染物污染负荷贡献率变化幅度不明显, 畜禽养殖是COD和TP的主要来源, 化肥是TN的主要来源(图 4).珠三角地区畜禽养殖COD、TN和TP的污染负荷贡献率明显下降, 水产养殖占污染负荷贡献率明显上升, 相比于1999年, 2019年水产养殖COD污染负荷贡献率上升11.71%, TN污染负荷贡献率达到25.04%, 并且成为了TP污染负荷的主要来源.粤东地区污染负荷结构变化不大, 畜禽养殖是COD和TP的主要来源, 化肥是TN主要来源.

|
图 4 1999~2019年不同地区COD、TN和TP不同污染源负荷贡献率 Fig. 4 Percent contributions of different pollution sources to the total pollutant load of COD, TN, and TP in different regions from 1999 to 2019 |
近20年广东省耕地面积减少38.44%(表 3), 化肥和地膜的施用量分别增加30.63%和96.90%;农药施用量在2012年达到最高值(113.88×10³ t), 2016年后开始下降, 2019年农药施用量相较于2016年减少了28.24%.
|
|
表 3 1999~2019年广东省种植业生产要素投入情况 Table 3 Input of agricultural production factors of Guangdong province from 1999 to 2019 |
广东省近20年化肥平均投入强度属轻度污染状态(333.44 kg·hm-2), 投入强度较高的城市主要有佛山市、深圳市、中山市、广州市、东莞市、茂名市、湛江市、潮州市和汕头市(图 5), 所有城市化肥投入强度均有提高, 全省总体提高了67.61%, 达到了中度污染水平(558.87 kg·hm-2).广东省近20年农药平均投入强度属于中度污染(14.81 kg·hm-2), 投入强度涨幅较高的城市主要有佛山市、东莞市、中山市、珠海市、深圳市和潮州市.相比于1999~2008年, 2009~2019年农药投入强度提高了64.23%, 农药投入涨幅较高的城市有佛山市、东莞市和潮州市, 广州市农药投入强度有所下降.

|
(a)和(c)为广东省各市近20年化肥和农药的平均投入强度; (b)和(d)为广东省各市近10年(2009~2019年)和前10年(1999~2009)化肥和农药投入强度的差值 图 5 1999~2019年广东省化肥和农药投入强度和差异 Fig. 5 Input intensity and difference of fertilizers and pesticides in Guangdong Province from 1999 to 2019 |
相关性分析结果表明(表 4), COD污染负荷与TN和TP污染负荷之间存在极显著相关性(P < 0.01); COD、TN和TP污染负荷与化肥、农膜和农药投入强度之间均呈负相关, 其中COD与化肥投入强度呈显著负相关(P < 0.05).
|
|
表 4 农业生产要素投入强度与农业面源污染负荷相关性分析结果1) Table 4 Correlation analysis results between agricultural production factors input intensity and total pollution load |
为了进一步揭示污染负荷和投入强度之间的关系, 将农业面源污染负荷、投入强度和污染负荷计算单位以及城镇化率进行相关性分析(表 5), 其中农业面源污染负荷与面源污染负荷计算单位呈极显著相关(P < 0.01), 与城镇化率呈极显著负相关(P < 0.01); 投入强度与城镇化率呈极显著正相关(P < 0.01), 与农村人口数和耕地面积呈极显著负相关(P < 0.01), 投入强度与投入总量并不存在显著相关关系, 并且投入强度与畜禽养殖产量和粮食作物产量呈负相关关系, 其中农药和农膜投入强度与畜禽养殖产量和粮食作物产量呈极显著负相关(P < 0.01).
|
|
表 5 农业面源污染计算指标与农业面源污染负荷指标相关性分析结果 Table 5 Correlation analysis results of indicators affecting agricultural non-point source pollution and agricultural non-point source pollution load indicators |
3 讨论
近20年来, 广东省面源污染负荷变化呈现一定的时间阶段性特征, 国内经济体制改革和国际经济形势的变化以及环境保护政策的改变对农业生产和农产品市场的影响是导致污染负荷变化的主要原因[30]. 1999~2006年经历了市场调节增长的阶段, 在自由市场机制下, 农产品的商品属性得到充分地展现[5], 从而刺激了农业产品的生产, 污染负荷随之增加.而在2007年污染负荷出现大幅度地降低, 这是由于金融危机出现所导致畜禽养殖数量的急剧减少造成的[31]. 2007~2015年期间, 随着经济的复苏以及一系列有利的农业政策出台, 使得污染负荷缓慢增长. 2015~2019年期间, 环境保护政策的完善与实施力度的加大, 又使得污染负荷逐年降低.化肥、农药和地膜的使用量受经济形势影响较小, 这可能与耕地逐渐转变为建设用地或者撂荒导致的耕地面积减小有关[32, 33], 为保证农作物产量投入了更多的化肥和农药.相关行动方案的颁布使得化肥与农药的使用量近几年有所下降[34, 35], 但是地膜投入量并未出现降低的趋势, 说明种植业生产要素的投入很大程度上受到农业政策的影响.
珠三角地区污染负荷贡献率最高, 说明珠三角地区存在着较大的农业面源污染问题[36].珠三角地区作为华南地区经济中心和人口最稠密地区, 高速发展导致农业用地极大地被压缩[4], 而珠三角地区人均肉类产品消费远高于全国平均水平[37], 为了保证供应, 化肥的施用量大幅增加并且畜禽养殖的规模不断扩大; 其次, 考虑到食物的运输距离成本, 珠三角周边地区农业生产的积极性较高[4]; 此外, 居民饮食结构的改变也会对蔬菜这类施肥量远高于其他农作物的农产品需求量增加[12, 13].
从污染来源方面看, 化肥是广东省TN污染负荷最主要的来源[5], 畜禽养殖业是COD和TP污染负荷的主要来源, 渔业养殖对于污染负荷的占比呈现明显上升趋势.广东是全国主要的水产养殖区域[38.39], 并且目前水产养殖业规模仍在持续扩大[40~42], 2019年珠三角地区水产养殖占广东省41.15%, 相比于1999年, 水产养殖总产量上升112.98%, 然而水产养殖过程中饲料的利用效率普遍较低[43], 导致大量的养分扩散至水域或者滞留在养殖区域内, 水产养殖的污染物排放逐渐成为珠三角地区TN和TP污染负荷的主要来源[42, 44].粤北和粤西地区农业生产方式主要以畜禽养殖和种植业为主, 所以污染来源主要是畜禽粪污以及化肥施用.粤东地区由于农村人口比重较高, 使得农村生活的污染排放在COD污染负荷来源中的占比逐渐上升, 此外粤东地区位于沿海地带, 水产养殖规模的扩大使得水产养殖排放的总磷占比也逐年上升.
城镇化的提高会导致耕地面积的缩减和耕地使用率的降低以及农村劳动力的转移[45~47], 为了增加粮食产量, 耕地投入要素强度相应增加, 因此城镇化率与耕地投入要素强度呈正相关; 但是高城镇化率会导致当地农业生产活动减弱[47], 降低当地的农业面源污染负荷(表 5).因此城镇化率的增加在减少当地的农业面源污染负荷的同时增加了耕地投入要素强度.目前广东省化肥利用率较低[6], 较高的化肥投入强度会增加N2O等温室气体的排放[16].较高强度的化肥和地膜施用, 会导致农田持久性有机污染物和微塑料的大量富集[48, 49].因此在处理高城镇化率的城市农业面源污染问题时, 化肥、农药和地膜是重点关注对象[50], 并且需要考虑提高耕地生产投入要素利用效率的问题[51].
基于广东省面源污染负荷时空特征及变化趋势, 对于广东省面源污染问题, 需针对不同的污染物类型来采取相应地措施.在COD污染的管控方面, 应着重于畜禽养殖以及农村生活污水处理上, 而对于总氮和总磷污染负荷的管控, 要从化肥的施用管理入手, 其次应减少散户畜禽养殖并逐步完善规模化畜禽养殖业粪污处理系统.最后, 需要增加水产养殖面源污染排放的监管和治理力度[52, 53], 完善水产养殖业中污染物扩散机制, 加强水产养殖污染控制技术的研究, 制定有效的预警防治措施.此外, 农业生产过程中产生的新型污染物(例如抗生素、微塑料和持久性有机污染物等)也需要引起重视[54, 55].
4 结论(1) 近20年来, 广东省农业面源污染总污染负荷和COD负荷有所下降, TN和TP的污染负荷上升.农业面源污染负荷排放存在阶段性变化特征, 经济和农业政策对农业面源污染负荷影响较大, 尤其是对种植业生产要素的影响较为明显.
(2) 从空间上来看, 珠三角地区是广东省农业面源污染负荷最高的地区.城镇化率与农村人口和农业面源污染指标呈现极显著关系.
(3) 畜禽养殖是COD的主要来源, 化肥和畜禽养殖是TN的主要来源, 畜禽养殖和水产养殖是TP的主要来源, 水产养殖污染物排放占比呈现出明显上升趋势, 且不同区域的农业生产模式造成的污染物来源存在差异.
(4) 广东省面源污染负荷总量虽有下降, 但农业生产投入强度仍然呈上升趋势, 面源污染问题依旧严峻.
致谢: 感谢中国科学院亚热带农业生态研究所李裕元教授在本文选题及写作过程中所提的宝贵意见.
| [1] |
肖宇婷, 姚婧, 谌书, 等. 沱江流域总氮面源污染负荷时空演变[J]. 环境科学, 2021, 42(8): 3773-3784. Xiao Y T, Yao J, Chen S, et al. Temporal and spatial evolution of non-point source pollution load of total nitrogen in Tuojiang River basin[J]. Environmental Science, 2021, 42(8): 3773-3784. |
| [2] |
王思如, 杨大文, 孙金华, 等. 我国农业面源污染现状与特征分析[J]. 水资源保护, 2021, 37(4): 140-147, 172. Wang S R, Yang D W, Sun J H, et al. Analysis on status and characteristics of agricultural non point source pollution in China[J]. Water Resources Protection, 2021, 37(4): 140-147, 172. |
| [3] | Jin G, Li Z H, Deng X Z, et al. An analysis of spatiotemporal patterns in Chinese agricultural productivity between 2004 and 2014[J]. Ecological Indicators, 2019, 105: 591-600. DOI:10.1016/j.ecolind.2018.05.073 |
| [4] | Mao Y P, Zhang H, Tang W Z, et al. Net anthropogenic nitrogen and phosphorus inputs in Pearl River Delta region (2008-2016)[J]. Journal of Environmental Management, 2021, 282. DOI:10.1016/j.jenvman.2021.111952 |
| [5] | Zou L L, Liu Y S, Wang Y S, et al. Assessment and analysis of agricultural non-point source pollution loads in China: 1978-2017[J]. Journal of Environmental Management, 2020, 263. DOI:10.1016/j.jenvman.2020.110400 |
| [6] | Sun C, Chen L, Zhai L M, et al. National assessment of nitrogen fertilizers fate and related environmental impacts of multiple pathways in China[J]. Journal of Cleaner Production, 2020, 277. DOI:10.1016/j.jclepro.2020.123519 |
| [7] | Ongley E D, Zhang X L, Yu T. Current status of agricultural and rural non-point source pollution assessment in China[J]. Environmental Pollution, 2010, 158(5): 1159-1168. DOI:10.1016/j.envpol.2009.10.047 |
| [8] | 中华人民共和国生态环境部, 国家统计局, 中华人民共和国农业农村部. 关于发布《第二次全国污染源普查公报》的公告[EB/OL]. https://www.mee.gov.cn/xxgk2018/xxgk/xxgk01/202006/t20200610_783547.html, 2020-06-08. |
| [9] |
董斯齐, 黄翀. 粤港澳大湾区陆源氮污染来源结构与空间分布[J]. 环境科学, 2021, 42(11): 5384-5393. Dong S Q, Huang C. Land-based nitrogen pollution source structure and spatial distribution in Guangdong-Hong Kong-Macao Greater Bay Area[J]. Environmental Science, 2021, 42(11): 5384-5393. |
| [10] | 广东省生态环境厅, 广东省农业农村厅, 广东省统计局. 广东省第二次全国污染源普查公报[EB/OL]. http://gdee.gd.gov.cn/wrygzdt/content/post_3100417.html, 2020-10-14. |
| [11] |
方娜, 刘玲玲, 游清徽, 等. 不同尺度土地利用方式对鄱阳湖湿地水质的影响[J]. 环境科学, 2019, 40(12): 5348-5357. Fang N, Liu L L, You Q H, et al. Effects of land use types at different spatial scales on water quality in Poyang Lake wetland[J]. Environmental Science, 2019, 40(12): 5348-5357. |
| [12] |
叶延琼, 章家恩, 李逸勉, 等. 基于GIS的广东省农业面源污染的时空分异研究[J]. 农业环境科学学报, 2013, 32(2): 369-377. Ye Y Q, Zhang J E, Li Y M, et al. Spatial-temporal variation of agricultural non-point source pollution based on GIS technology in Guangdong Province, China[J]. Journal of Agro-Environment Science, 2013, 32(2): 369-377. |
| [13] |
林兰稳, 朱立安, 曾清苹. 广东省农业面源污染时空变化及其防控对策[J]. 生态环境学报, 2020, 29(6): 1245-1250. Lin L W, Zhu L A, Zeng Q P. Spatial and temporal changes of agricultural non-point source pollution in Guangdong Province and its prevention and control measures[J]. Ecology and Environmental Sciences, 2020, 29(6): 1245-1250. |
| [14] |
农业农村部渔业渔政管理局, 全国水产技术推广总站, 中国水产学会. 2020中国渔业统计年鉴[M]. 北京: 中国农业出版社, 2020. Fishery Administration of the Ministry of Agriculture and Rural Areas, National Fisheries Technology Extension Center, China Society of Fisheries. 2020 China fishery statistical yearbook[M]. Beijing: China Agriculture Press, 2020. |
| [15] | Zhang Y N, Long H L, Li Y R, et al. Non-point source pollution in response to rural transformation development: a comprehensive analysis of China's traditional farming area[J]. Journal of Rural Studies, 2021, 83: 165-176. DOI:10.1016/j.jrurstud.2020.10.010 |
| [16] | Ye S J, Song C Q, Shen S, et al. Spatial pattern of arable land-use intensity in China[J]. Land Use Policy, 2020, 99. DOI:10.1016/j.landusepol.2020.104845 |
| [17] | 中华人民共和国生态环境部, 国家统计局, 中华人民共和国农业农村部. 关于发布《第二次全国污染源普查公报》的公告[EB/OL]. https://www.mee.gov.cn/xxgk2018/xxgk/xxgk01/202006/t20200610_783547.html, 2020-06-09. |
| [18] | 《广东农村统计年鉴》编纂委员会. 广东农村统计年鉴2000-2020[M]. 北京: 中国统计出版社, 2000. |
| [19] | 广东省统计局. 广东统计年鉴2000-2020[M]. 北京: 中国统计出版社, 2000. |
| [20] | 赖斯芸. 非点源污染调查评估方法及其应用研究[D]. 北京: 清华大学, 2004. 38-45. |
| [21] | Wang X L, Yang Z L, Liu X, et al. The composition characteristics of different crop straw types and their multivariate analysis and comparison[J]. Waste Management, 2020, 110: 87-97. DOI:10.1016/j.wasman.2020.05.018 |
| [22] | 农业农村部渔业渔政管理局, 全国水产技术推广总站, 中国水产学会. 2019中国渔业统计年鉴[M]. 北京: 中国农业出版社, 2019. |
| [23] | Tao Y, Liu J, Guan X Y, et al. Estimation of potential agricultural non-point source pollution for Baiyangdian Basin, China, under different environment protection policies[J]. PLoS One, 2020, 15(9). DOI:10.1371/journal.pone.0239006 |
| [24] |
陶园, 徐静, 任贺靖, 等. 黄河流域农业面源污染时空变化及因素分析[J]. 农业工程学报, 2021, 37(4): 257-264. Tao Y, Xu J, Ren H J, et al. Spatiotemporal evolution of agricultural non-point source pollution and its influencing factors in the Yellow River Basin[J]. Transactions of the Chinese Society of Agricultural Engineering, 2021, 37(4): 257-264. |
| [25] |
武淑霞, 刘宏斌, 刘申, 等. 农业面源污染现状及防控技术[J]. 中国工程科学, 2018, 20(5): 23-30. Wu S X, Liu H B, Liu S, et al. Review of current situation of agricultural non-point source pollution and its prevention and control technologies[J]. Engineering Science, 2018, 20(5): 23-30. |
| [26] |
李丽芬, 徐云强, 苏保林, 等. 池塘养殖污染负荷核算方法研究及比较分析[J]. 农业环境科学学报, 2019, 38(9): 2174-2183. Li L F, Xu Y Q, Su B L, et al. Accounting methods and comparative analysis of pollution load from an aquaculture pond[J]. Journal of Agro-Environment Science, 2019, 38(9): 2174-2183. |
| [27] |
刘思儒, 赵继东, 肖尚斌, 等. 洱海藻类水华高风险期沉积物氮磷释放通量时空变化[J]. 环境科学, 2020, 41(2): 734-742. Liu S R, Zhao J D, Xiao S B, et al. Spatio-temporal variation of release flux of sediment nitrogen and phosphorus in high-risk period of algal bloom in Lake Erhai[J]. Environmental Science, 2020, 41(2): 734-742. |
| [28] | Chen M, Chen J, Du P. An inventory analysis of rural pollution loads in China[J]. Water Science & Technology, 2006, 54(11-12): 65-74. |
| [29] |
邓春梅, 李玉萍, 李茂芬, 等. 基于GIS的海南省农业面源污染时空分异研究[J]. 南方农业学报, 2020, 51(10): 2580-2587. Deng C M, Li Y P, Li M F, et al. Spatio-temporal variation of agriculture non-point source pollution based on GIS technology in Hainan Province[J]. Journal of Southern Agriculture, 2020, 51(10): 2580-2587. DOI:10.3969/j.issn.2095-1191.2020.10.032 |
| [30] | Fan L C, Yuan Y M, Ying Z C, et al. Decreasing farm number benefits the mitigation of agricultural non-point source pollution in China[J]. Environmental Science and Pollution Research, 2019, 26(1): 464-472. DOI:10.1007/s11356-018-3622-6 |
| [31] | Zhang T, Ni J P, Xie D T. Assessment of the relationship between rural non-point source pollution and economic development in the Three Gorges Reservoir Area[J]. Environmental Science and Pollution Research, 2016, 23(8): 8125-8132. DOI:10.1007/s11356-016-6344-7 |
| [32] | Yang R, Zhang J, Xu Q, et al. Urban-rural spatial transformation process and influences from the perspective of land use: a case study of the Pearl River Delta Region[J]. Habitat International, 2020, 104. DOI:10.1016/j.habitatint.2020.102234 |
| [33] | Yang C, Liu H Z, Li Q Q, et al. Rapid urbanization induced extensive forest loss to urban land in the Guangdong-Hong Kong-Macao Greater Bay Area, China[J]. Chinese Geographical Science, 2021, 31(1): 93-108. DOI:10.1007/s11769-021-1177-9 |
| [34] | 中华人民共和国农村农业部. 到2020年化肥使用量零增长行动方案[EB/OL]. http://www.moa.gov.cn/nybgb/2015/san/201711/t20171129_5923401.htm, 2015-02-17. |
| [35] | 中华人民共和国农村农业部. 到2020年农药使用量零增长行动方案[EB/OL]. http://www.moa.gov.cn/nybgb/2015/san/201711/t20171129_5923401.htm, 2015-02-17. |
| [36] | Wan S Z, Chen F S, Hu X F, et al. Urbanization aggravates imbalances in the active C, N and P pools of terrestrial ecosystems[J]. Global Ecology and Conservation, 2020, 21. DOI:10.1016/j.gecco.2019.e00831 |
| [37] | Chen C, Wen Z G, Wang Y H. Nitrogen flow patterns in the food system among cities within urban agglomeration: a case study of the Pearl River Delta region[J]. Science of the Total Environment, 2020, 703. DOI:10.1016/j.scitotenv.2019.135506 |
| [38] | Wang Q D, Li Z J, Gui J F, et al. Paradigm changes in freshwater aquaculture practices in China: moving towards achieving environmental integrity and sustainability[J]. Ambio, 2018, 47(4): 410-426. |
| [39] | Wang Q D, Cheng L, Liu J S, et al. Freshwater aquaculture in PR China: trends and prospects[J]. Reviews in Aquaculture, 2015, 7(4): 283-302. DOI:10.1111/raq.12086 |
| [40] | Cai C F, Gu X H, Ye Y T, et al. Assessment of pollutant loads discharged from aquaculture ponds around Taihu Lake, China[J]. Aquaculture Research, 2013, 44(5): 795-806. DOI:10.1111/j.1365-2109.2011.03088.x |
| [41] | Meng W Q, Feagin R A. Mariculture is a double-edged sword in China[J]. Estuarine, Coastal and Shelf Science, 2019, 222: 147-150. DOI:10.1016/j.ecss.2019.04.018 |
| [42] | Ren C Y, Wang Z M, Zhang Y Z, et al. Rapid expansion of coastal aquaculture ponds in China from Landsat observations during 1984-2016[J]. International Journal of Applied Earth Observation and Geoinformation, 2019, 82. DOI:10.1016/j.jag.2019.101902 |
| [43] | Zhang Y, Bleeker A, Liu J G. Nutrient discharge from China's aquaculture industry and associated environmental impacts[J]. Environmental Research Letters, 2015, 10(4). DOI:10.1088/1748-9326/10/4/045002 |
| [44] |
何媛婷, 王石英, 袁再健, 等. 珠江三角洲土地利用变化及其对城市化发展的响应[J]. 生态环境学报, 2020, 29(2): 303-310. He Y T, Wang S Y, Yuan Z J, et al. Land use change and its response to urbanization in the Pearl River Delta[J]. Ecology and Environmental Sciences, 2020, 29(2): 303-310. |
| [45] |
王文锦, 王卿, 朱安生, 等. 2000~2018年长三角土地利用变化对农田生态系统氨排放的影响[J]. 环境科学, 2021, 42(7): 3442-3450. Wang W J, Wang Q, Zhu A S, et al. Role of land use changes on ammonia emissions from agricultural ecosystems in the Yangtze River Delta Region from 2000 to 2018[J]. Environmental Science, 2021, 42(7): 3442-3450. |
| [46] | Shao S, Li B L, Fan M T, et al. How does labor transfer affect environmental pollution in rural China? Evidence from a survey[J]. Energy Economics, 2021, 102. DOI:10.1016/j.eneco.2021.105515 |
| [47] | Lu H, Xie H L. Impact of changes in labor resources and transfers of land use rights on agricultural non-point source pollution in Jiangsu Province, China[J]. Journal of Environmental Management, 2018, 207: 134-140. |
| [48] | Dereumeaux C, Fillol C, Quenel P, et al. Pesticide exposures for residents living close to agricultural lands: a review[J]. Environment International, 2020, 134. DOI:10.1016/j.envint.2019.105210 |
| [49] | Kumar M, Xiong X N, He M J, et al. Microplastics as pollutants in agricultural soils[J]. Environmental Pollution, 2020, 265. DOI:10.1016/j.envpol.2020.114980 |
| [50] | Zhang J T, Tian H Q, Shi H, et al. Increased greenhouse gas emissions intensity of major croplands in China: implications for food security and climate change mitigation[J]. Global Change Biology, 2020, 26(11): 6116-6133. DOI:10.1111/gcb.15290 |
| [51] | Zhang Y J, Yu Q. Identification of current research intensity and influence factors of agricultural nitrogen loss from cropping systems[J]. Journal of Cleaner Production, 2020, 276. DOI:10.1016/j.jclepro.2020.123308 |
| [52] | Qiu J. China vows to clean up rural environment[EB/OL]. https://doi.org/10.1038/news.2011.200, 2011-04-01. |
| [53] | Li X, Li Y Y, Lv D Q, et al. Nitrogen and phosphorus removal performance and bacterial communities in a multi-stage surface flow constructed wetland treating rural domestic sewage[J]. Science of the Total Environment, 2020, 709. DOI:10.1016/j.scitotenv.2019.136235 |
| [54] | Huang Y, Liu Q, Jia W Q, et al. Agricultural plastic mulching as a source of microplastics in the terrestrial environment[J]. Environmental Pollution, 2020, 260. DOI:10.1016/j.envpol.2020.114096 |
| [55] | Oberoi A S, Jia Y Y, Zhang H Q, et al. Insights into the fate and removal of antibiotics in engineered biological treatment systems: a critical review[J]. Environmental Science & Technology, 2019, 53(13): 7234-7264. |