 2022, Vol. 43


2. 上海长三角城市湿地生态系统国家野外科学观测研究站, 上海 200234
2. Yangtze River Delta Urban Wetland Ecosystem National Field Observation and Research Station, Shanghai 200234, China
沉积物作为重要的碳汇, 对调节全球气候变化具有重要作用.沉积物中有机碳的存储是有机碳从生物圈向地圈迁移的主要途径, 有助于调节全球生态系统的碳循环.沉积物环境中有机质的分布及来源的探究对于了解全球生物地球化学的碳循环至关重要[1].同时, 碳循环在调节养分循环及生态系统中起着重要作用, 而N(氮)和P(磷)的迁移转化通常以有机质为重要载体, 通过水环境初级生产和有机物降解紧密耦合[2].因此, 对环境中碳循环的全面认识有助于阐明C、N和P生物地球化学循环的耦合机制及相关的生态环境效应, 从而为水体富营养化的防治提供科学指导.
稳定的碳和氮同位素(δ13C和δ15N)和总有机碳(TOC)与总氮(TN)的比率(通常表示为C/N), 被广泛用作在水生环境中阐明有机质来源的判断指标[3, 4].陆地有机物的C/N比率在12~400之间变化, 而浮游植物的C/N比则变化较小(约6~8)[5, 6], 陆生植物和浮游生物之间碳同位素含量通常受到光合作用机制和碳源的不同而表现出一定的差异性[7].氮同位素通常用于区分硝酸盐的天然和人为来源, 例如人工合成肥料δ15N值在-3‰~3‰之间[8], 浮游生物δ15N值在5~8之间[9], 污水有机质δ15N值在7~25之间[3], 大气沉降NO3-的δ15N值在0.2‰~0.8‰之间[10].
过去10年来, 中国长三角区域经济的快速发展和城市化对其环境, 特别是对长三角核心城市上海地区的环境产生了重大影响.青浦区作为长三角生态绿色一体化发展示范区(示范区)的先行启动区, 地处江苏、浙江和上海两省一市交界, 近一半位于上海市饮用水源保护地内, 周边地区污染输入较为严重, 主要包括农业种植废弃物、生活污水、水产养殖废水和工业废物等的排放[11].然而目前, 青浦区水体沉积物有机质分布特征及来源相关研究较为有限, 主要集中在相关流域水质变化趋势[12, 13]、浮游植物[14, 15]、植被[16]和重金属污染[17, 18]等研究.因此对该区域沉积物中有机质分布特征及来源的研究有助于揭示该地区的环境状况, 也为环境保护和治理提供指导.
本研究以长三角一体化示范区青浦区为研究区域, 通过量化青浦区表层沉积物中有机质和碳氮同位素成分, 了解研究区域有机碳和氮的分布特征, 阐明沉积物有机质的主要来源, 并采用有机污染指数进行了综合评价, 以期为一体化示范区生态保护和水污染治理提供参考, 同时为非点源污染负荷的估算与控制提供科学依据.
1 材料与方法 1.1 研究区域概况青浦区位于上海郊区, 太湖下游, 黄浦江上游, 东经120°53′~121°17′, 北纬30°59′~31°16′之间, 总面积676 km2, 水域面积124 km2, 全区共计有1 945条河流.年降雨量1 056 mm, 平均温度15.5℃.其中, 太浦河作为跨界河流, 流经江苏吴江区、浙江嘉善县和上海青浦区, 连接太湖和黄浦江; 金泽水库是上海市四大饮用水水源地之一, 也是上海唯一地处长三角一体化示范区内的水源地; 青西郊野公园以大莲湖为核心, 位于淀山湖下游, 是淀山湖水经由拦路港注入黄浦江的枢纽通道.
1.2 样品采集与前处理本研究共设采样点25个, 具体采样点位位置如图 1所示, 采样点具体信息见表 1.于2020年11月分别采集了金泽水库周边(J1、J2、J3、J4、J5、J6、J7、J8)、青西郊野公园(Q1、Q2、Q3、Q4、Q5、Q6、Q7、Q8、Q9)和太浦河流域(T1、T2、T3、T4、T5、T6、T7、T8)的表层沉积物样品.

|
图 1 研究区域采样点示意 Fig. 1 Sampling sites map of the study area |
|
|
表 1 研究区域采样点经纬度和土地利用类型 Table 1 Latitude and longitude of sampling points in the study area and land use types |
使用活塞式柱状沉积物采样器(北京新地标土壤设备有限公司)于采样点上游和下游收集3个表层(0~5 cm)沉积物混合样, 重复采集3次, 混合后的样品置于塑封袋中, 4℃冷藏保存, 样品采集完成后立即运回实验室进行前处理.样品经冷冻干燥、研磨后过100目筛, 密封保存, 以用于随后的TOC、TN、δ13C和δ15N分析.
1.3 分析方法用0.5 mol·L-1盐酸对前处理后的沉积物样品进行预处理24 h, 反复用去离子水洗涤离心, 直至上清液为中性, 然后将样品烘干, 使用德国耶拿multic N/C 3100测定样品中TOC含量; TN含量采样过硫酸钾氧化法测定[19].
使用稳定同位素比值质谱仪(TC/EA-Thermo Fisher MAT 253)测量有机碳(δ13C)和氮(δ15N)的同位素组成.实验中的δ13C数据以美国南卡罗来纳州白垩系PDB为标准品, δ15N数据以大气中的N2为标准品, 计算公式为:
|
|
式中, Rsample为实际样品同位素比值, Rstandard为标准物同位素比值.
1.4 质量控制和数据分析TOC分析测定前, 以碳酸钙为标样建立标准曲线, 分析误差在5%以内时进样, 每个样品分析3次, 取平均值.每个采样点的TN、δ13C和δ15N含量均测定3次, 取平均值, 相对误差需小于5%.本研究使用Excel 2019对青浦区表层沉积物中TN、TOC、C/N、δ13C和δ15进行分析和处理; 使用SPSS 16.0软件进行Pearson相关性分析, 以研究参数之间的相关性; 使用IsoSource软件计算了不同端元物质对研究区域目标采样点贡献率; 所有数据图均通过Origin 2021软件绘制, 且采样点图使用ArcGIS 10.5结合现场采样具体情况绘制完成.
2 结果与讨论 2.1 TN、TOC、C/N、δ13C和δ15N的空间分布特征研究区域表层沉积物中ω(TOC)和ω(TN)范围分别为0.21%~3.55%(平均值为1.18%)和0.02%~0.23%(平均值为0.09%), ω(TOC)排前3的采样点依次为J6(3.55%)、J8(3.34%)和J5(3.07%).其中, J6采样点为林地, 陆生植物及水生植物生长繁盛, 根据采样现场周边环境观察, 岸上主要以陆生植物垂柳树和樟树为主, 同时水面有大量水生植物芦竹和野菱, 其残骸腐烂分解之后使得沉积物中有机质和总氮含量增加; J8和J5采样点分别为农业用地和农贸市场附近, 人类活动行为较为复杂, 由图 2也可看出上述3个采样点表层沉积物中TN含量相对于其他采样点较高(>0.18%), 这可能是因为沉积物环境中养分含量容易受人类活动(例如生活污水排放、化肥使用和淡水养殖)的影响[20].此外, 除了来源方式和人类活动影响外, 不同采样点之间TOC的差异性也可能受沉积物颗粒大小的影响, 有研究表明颗粒越小, 比表面积越大, 越容易吸附有机质[21].与其他研究区域相比(表 2), 本研究区域中表层沉积物中ω(TOC)低于[4]骆马湖(0.55%~3.76%, 平均值为1.62%), 高于长江口区域[22](0.17%~1.16%, 平均值为0.52%)与鄱阳湖[23](0.63%~1.86%, 平均值为1.15%)相当, ω(TN)与鄱阳湖(0.063%~0.16%, 平均值为0.1%)和黄河口[24](0.01%~0.11%)相当, 低于骆马湖(0.04%~0.46%, 平均值为0.19). Pearson相关性结果(图 3和表 3)显示TOC与TN呈显著正相关(R2=0.694 26, P<0.05), 表明TOC与TN具有相似来源, 这与刘倩等[4]和Sui等[25]的研究结果相一致.

|
图 2 表层沉积物中TOC、TN和C/N空间分布特征 Fig. 2 Spatial distribution characteristics of TOC, TN, and C/N in surface sediments |
|
|
表 2 长三角及中国其他研究区域表层沉积物中有机质研究比较1) Table 2 Comparison of research on organic matter in surface sediments of the Yangtze River Delta and other research regions in China |

|
图 3 研究区域表层沉积物TOC与TN含量之间的关系 Fig. 3 Relationship between TOC and TN contents of surface sediments in the study area |
|
|
表 3 研究区域表层沉积物TOC、TN、C/N、δ13C和δ15N的相关关系1) Table 3 Pearson correlations between TOC, TN, C/N, δ13C, and δ15N of surface sediments in the study area |
有研究表明沉积物C/N值可用于指示环境中主要有机物的来源[26, 27], 当C/N值在10~20之间时, 指示来源为沉水植物、浮游植物或者是混有一定量的陆生植物; 当C/N值在6.6~13之间时, 指示来源为污水有机质[3]; 当C/N值在10~16之间时, 指示来源为土壤有机质[3], 且C/N值越高, 则反映了较高的陆源输入比例.研究区域表层沉积物中C/N值范围为3.54~28.2, 平均值为13.75, 这表明研究区域表层沉积物中有机质主要来源为土壤有机质、陆生植物和污水, 其中J1点位C/N值最高(C/N=28.25), 除了来自陆地来源输入的影响外, 较高的C/N比率也可能归因于人为活动的影响[28], 如广泛使用有机化学品.
一般而言, 水生生态系统中有机质的δ13C分布范围较广, 陆生C3植物δ13C一般为-30‰~-26‰, 海洋浮游植物有机碳范围一般为-22‰~-18‰[29].研究区域表层沉积物中δ13C范围为-28.04‰~-10.80‰, 平均值为-22.28‰(图 4), 其中含量最高值和最低值分别位于J6和Q9, 相较于其他研究区域而言(表 2), 低于骆马湖表层沉积物(-27.32‰~-8.36‰, 平均值为-14.98‰), 高于北京地区河流表层沉积物(-27.2‰~-24.9‰, 平均值为-25.9‰).研究区域中δ13C与C/N呈显著正相关(P<0.05, 表 3), 表明这两个参数可用于确定研究区域有机物的来源.

|
图 4 表层沉积物中δ13C和δ15N空间分布特征 Fig. 4 Spatial distribution characteristics of δ13C and δ15N in surface sediments |
氮的动态循环受动力学同位素分馏作用的影响, 特别是在溶解和颗粒状氮化合物的生物转化和再循环过程中[30, 31].一般而言, 沉积物中δ15N范围在-1‰~18‰之间[3], 变化范围较大.研究区域表层沉积物中δ15N范围为2.28‰~11.19‰, 平均值为5.76‰(图 4), 且与C/N值无明显相关性, 这可能是因为有机物自身的分解(如自溶、浸出、微生物矿化)和人为活动的干扰[8].
2.2 来源解析河流沉积物中有机质的来源主要分为自然来源和人为来源[37].自然来源包括陆地土壤的侵蚀、陆生植物的凋落物和浮游植物; 人为来源主要为生活污水和地表径流.有研究表明无机氮的矿化、氧化和含量较高会影响C/N值, 因此C/N值作为单一源指示指标具有一定的局限性[24], 故本研究采用C/N、δ13C和δ15N相结合对研究区域表层沉积物有机质潜在来源进行分析.
Gu等[38]的研究利用C/N比值和δ13C/δ15N比值发现华南粤东沿海最大海水养殖区表层沉积物中有机碳主要来自海洋有机质; Liu等[24]在对黄河口渤海地区表层沉积物中有机质来源的研究中发现, 海洋有机碳在沉积物中占主导地位, 而陆源有机碳仅占10%~20%.
2.2.1 表层沉积物中有机质来源的定性分析沉积物中有机质来源受到水和沉积的理化性质、初级生产力、流域水文特征和人类活动的影响[3, 20, 39].结合前人研究以及研究区域潜在污染源, 最终选择污水有机质、陆生C3植物、陆生C4植物、浮游植物和土壤有机质为本研究中端元物质, 各端元物质C/N、δ13C和δ15N的分布见表 4.
|
|
表 4 典型沉积物端元物质的δ13C、δ15N和C/N值的分布[3, 4, 9, 10, 40] Table 4 Distribution of δ13C, δ15N, and C/N values of typical sources of sedimentary organic matter |
图 5中约有6~10个采样点不在所选端元物质范围内, 这可能是因为一方面C/N与δ13C或δ15N比值法可能受限于所选端元物质数量不够[3], 另一方面这可能意味着采样点受到多种混合源的影响作用[25].从中可知, 研究区域表层沉积物中有机质主要来源为污水有机质、陆生植物和土壤有机质.此外, 对于不同土地利用类型背景下研究区域表层沉积物有机质来源分析表明, 工业用地和农业用地分别主要受到污水有机质和陆生C4植物的影响, 林地和居民区用地背景下的采样点受到多种端元物质影响.

|
图 5 δ15N、δ13C和C/N比值对研究区域表层沉积物的有机质来源定性识别结果 Fig. 5 Qualitative identification results of δ15N, δ13C, and C/N ratio on the source of organic matter in the surface sediments of the study area |
根据沉积物样本的δ13C和δ15N值, 利用IsoSource模型评估了不同有机质来源对研究区域表层沉积物中有机质的相对贡献(图 6).

|
图 6 不同端元物质对研究区域表层沉积物中有机质的贡献率 Fig. 6 Contribution rate of different end member materials to the organic matter in the surface sediments of the study area |
总体而言土壤有机质对研究区域表层沉积物中有机质贡献率相对较高, 在所有25个采样点中, 土壤有机质来源占比分布范围为5%~96.8%, 平均值为31.5%, 其中J7采样点土壤有机质来源贡献率达到96.8%; 其次是陆生C4植物(范围为0%~89.1%, 平均值为25.63%)和陆生C3植物(范围为0%~75.8%, 平均值为22.58%).
值得注意的是, 除J7、Q3和Q4采样点以外, 其余采样点均受到污水有机质来源的影响(贡献率范围为1%~53.5%), 这表明除自然过程以外, 人为活动对研究区域沉积物中有机质的形成具有重要的作用, 另一方面, 截止2019年, 全区生活污水集中纳管处理占42.2%, 其余均就地排放进入河道[41], 且处理设施不完善及早期处理工艺不达标问题较为突出[42].
有研究表明土地利用方式对环境中有机质的空间分布具有重要影响作用[43~45].土地利用类型的变化直接影响土壤物理化学特性、生物多样性和相关的生物地球化学周期, 导致土壤环境条件的改变, 从而影响碳生物地球化学循环及其相关平衡[46].此外, 有研究表明土壤TC、TN和δ15N在不同森林类型下变化显著, 主要影响因素有土壤C/N比值以及土壤水分含量[28].
图 7为不同土地利用类型背景中, 所选端元物质对研究区域沉积物中有机质来源的贡献率分布情况.从图 7可以看出由于工业用地人为活动较复杂, 且紧邻航道太浦河, 来往船只活动频繁, 故工业用地受多种端元物质影响, 且来源分布相对均衡; 就生活污水来源而言, 居民区(16.45%)环境中有机质来源受生活污水影响较大, 其次为工业用地(9.50%), 农业用地(5.19%)和林地(5.35%)受污水有机质影响最低.此外, 土壤有机质的输入对各土地利用类型中有机质的来源均有较高的影响作用(平均值均>20.51%), 这表明研究区域河流沉积物中有机质受土壤有机质自然来源影响较为广泛, 这可能是因为近年来, 随着工业郊区化进程的发展, 工业建设用地面积增加, 大大降低了植被覆盖率, 地表土壤遭到破坏, 最终导致沉积物中陆地成分的有机质和氮负荷增.

|
图 7 不同土地利用类型下各端元物质的贡献率 Fig. 7 Contribution rate of each end-member material under different land use types |
在农业用地环境中, 土壤有机质(平均值为34.86%)和陆生C3植物(平均值为32.03%)的贡献较明显, 陆生C3植物主要包括水稻、大豆、马铃薯和菠菜等, 2020年青浦区的蛙稻田(以蛙代替农药化肥)种植面积达到5.79 km2(约为579 hm2), 其中2.13 km2(约为213 hm2)在青西郊野公园.肥料的δ15N范围为-2‰~4‰[47], 而本研究农业用地表层沉积物中δ15N介于3.97‰~6.86‰, 这进一步验证了来源分析结果的准确性.
综上所述, 研究区域表层沉积物中有机质主要受到外源物质的影响, 如土壤有机质、陆生C4植物和污水有机质, 且主要受人为活动影响.
2.3 污染指数评价利用有机指数和有机氮评价来评估研究区域表层沉积物中有机质污染程度, 评价公式如下[48]:

|
|
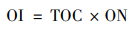
式中, ON为沉积物中有机氮含量(%), TN为沉积物中总氮含量(%), OI为有机污染指数, TOC为沉积物中有机碳含量(%), 评价标准如表 5所示.
|
|
表 5 沉积物有机污染指数评价标准 Table 5 Evaluation criteria for organic pollution index of sediments |
研究区域表层沉积物中有机质指数评价结果如图 8所示, 有机污染指数范围为0.006~0.745, 平均值为0.163, 总体处于轻度污染状态; 有机氮含量变化范围为0.019%~0.223%, 平均值为0.089%, 整体处于中度污染状态.总体而言研究区域表层沉积物中有机污染状态与太湖胥口湾[49]表层沉积物相当, 相较于云南洱海罗时江河口湿地[50]中表层沉积物的污染程度较低.

|
红色虚线表示有机污染指数评价临界值 图 8 研究区域表层沉积物有机污染指数评价结果 Fig. 8 Evaluation results of organic pollution index of surface sediments in the study area |
在所有采样点的有机指数评价中, 有44.00%采样点处于清洁状态, 40.00%采样点处于轻度污染状态, 4.00%的采样点处于中度污染状态, 12.00%的采样点处于重度污染状态.其中金泽地区(J5、J6和J8)有机污染指数相较于研究区域其他采样点明显偏高(重度污染), 这是因为金泽地区采样点均属于火泽荡水系, 且金泽镇居民生活区位于火泽荡周边, 环境中有机质的分布主要受人为活动的影响, 而同属于金泽地区的采样点J4和J7属于轻度污染水平, 这主要是因为上述两个采样点位于航道, 来往船只频繁使得水文条件较为复杂, 动力作用下, 一方面沉积物中吸附的有机质会再悬浮, 另一方面, 氧化还原条件的变化也会对有机质的分解产生一定影响.在其他环境中同样发现有机质的分布及降解受到空间变异性(环境条件、河流水文条件和人类活动干预等)的影响[51], 例如沿海湿地[52]和港口[37].
3 结论本文探究了长三角示范区青浦区表层沉积物中TOC、TN及其同位素的含量和空间分布特征.青浦区表层沉积物中ω(TOC)和ω(TN)范围分别为0.21%~3.55%(平均值为1.18%)和0.02%~0.23%(平均值为0.09%); 有机污染评价指数显示研究区域总体处于轻度污染水平, 其中金泽水库周边地区有机污染呈重度污染状态, 有潜在富营养化风险; 此外, 研究区域表层沉积物中δ13C范围为-28.04‰~-10.80‰, δ15N范围为2.28‰~11.19‰, 来源分析表明, 研究区域沉积物中有机质主要受土壤有机质、污水有机质和陆生植物的影响, 且土壤有机质贡献率最大, 污水有机质对研究区域有机质来源贡献同样不可忽视.因此, 应当采取一定措施防止水土流失及生活污水排放行为等对研究区域生态系统造成的负面影响.
| [1] | Xu G, Liu J, Hu G, et al. Distribution and source of organic matter in surface sediment from the muddy deposit along the Zhejiang coast, East China Sea[J]. Marine Pollution Bulletin, 2017, 123(1-2): 395-399. DOI:10.1016/j.marpolbul.2017.08.053 |
| [2] | Chen J G, Yang H Q, Zeng Y, et al. Combined use of radiocarbon and stable carbon isotope to constrain the sources and cycling of particulate organic carbon in a large freshwater lake, China[J]. Science of the Total Environment, 2018, 625: 27-38. DOI:10.1016/j.scitotenv.2017.12.275 |
| [3] | Guo Q J, Wang C Y, Wei R F, et al. Qualitative and quantitative analysis of source for organic carbon and nitrogen in sediments of rivers and lakes based on stable isotopes[J]. Ecotoxicology and Environmental Safety, 2020, 195. DOI:10.1016/j.ecoenv.2020.110436 |
| [4] |
刘倩, 庞燕, 项颂, 等. 骆马湖表层沉积物有机质分布特征及来源解析[J]. 中国环境科学, 2021, 41(10): 4850-4856. Liu Q, Pang Y, Xiang S, et al. Distribution characteristics and source analysis of organic matter in surface sediments of Luoma Lake[J]. China Environmental Science, 2021, 41(10): 4850-4856. DOI:10.3969/j.issn.1000-6923.2021.10.043 |
| [5] | Jennerjahn T C, Ittekkot V, Klöpper S, et al. Biogeochemistry of a tropical river affected by human activities in its catchment: brantas River estuary and coastal waters of Madura Strait, Java, Indonesia[J]. Estuarine, Coastal and Shelf Science, 2004, 60(3): 503-514. DOI:10.1016/j.ecss.2004.02.008 |
| [6] | Wu Y, Zhang J, Liu S M, et al. Sources and distribution of carbon within the Yangtze River system[J]. Estuarine, Coastal and Shelf Science, 2007, 71(1-2): 13-25. DOI:10.1016/j.ecss.2006.08.016 |
| [7] | Stevenson M A, McGowan S, Pearson E J, et al. Anthropocene climate warming enhances autochthonous carbon cycling in an upland Arctic Lake, Disko Island, West Greenland[J]. Biogeosciences, 2021, 18(8): 2465-2485. DOI:10.5194/bg-18-2465-2021 |
| [8] | Gao X L, Yang Y W, Wang C Y. Geochemistry of organic carbon and nitrogen in surface sediments of coastal Bohai Bay inferred from their ratios and stable isotopic signatures[J]. Marine Pollution Bulletin, 2012, 64(6): 1148-1155. DOI:10.1016/j.marpolbul.2012.03.028 |
| [9] | Shao L, Wu D S, Zhang D, et al. Using isotopes to identify the sources of organic carbon and nitrogen in surface sediment in shallow lakes alongside Poyang Lake[J]. Wetlands, 2019, 39(S1): 25-33. DOI:10.1007/s13157-017-0988-z |
| [10] |
倪兆奎, 李跃进, 王圣瑞, 等. 太湖沉积物有机碳与氮的来源[J]. 生态学报, 2011, 31(16): 4661-4670. Ni Z K, Li Y J, Wang S R, et al. The sources of organic carbon and nitrogen in sediment of Taihu Lake[J]. Acta Ecologica Sinica, 2011, 31(16): 4661-4670. |
| [11] | 田多松. 城市水源地环境风险源综合评价体系及管理对策研究——以太浦河为例[D]. 上海: 华东师范大学, 2016. |
| [12] |
房振南, 金科, 王雪姣, 等. 长三角一体化生态绿色发展示范区主要河湖水质变化趋势分析[J]. 水利水电快报, 2021, 42(4): 68-74. Fang Z N, Jin K, Wang X J, et al. Analysis on water quality variation trend of main rivers and lakes in integrated demonstration area on ecologically friendly development in Yangtze River Delta[J]. Express Water Resources & Hydropower Information, 2021, 42(4): 68-74. |
| [13] | 张舒, 黄慧慧. 上海淀浦河多年水质演变趋势分析[J]. 黑龙江水利科技, 2017, 45(7): 37-38, 144. DOI:10.3969/j.issn.1007-7596.2017.07.011 |
| [14] |
杨丽, 张玮, 尚光霞, 等. 淀山湖浮游植物功能群演替特征及其与环境因子的关系[J]. 环境科学, 2018, 39(7): 3158-3167. Yang L, Zhang W, Shang G X, et al. Succession characteristics of phytoplankton functional groups and their relationships with environmental factors in Dianshan Lake, Shanghai[J]. Environmental Science, 2018, 39(7): 3158-3167. |
| [15] |
王霞, 郭凯娟, 李晓旭, 等. 淀山湖浮游植物生物完整性指数的构建及水生态健康评价[J]. 上海师范大学学报(自然科学版), 2021, 50(1): 39-49. Wang X, Guo K J, Li X X, et al. Construction of phytoplanktonic index of biotic integrity and evaluation of water ecological health in Dianshan Lake, China[J]. Journal of Shanghai Normal University (Natural Sciences), 2021, 50(1): 39-49. DOI:10.3969/J.ISSN.1000-5137.2021.01.006 |
| [16] |
刘垚燚, 曾鹏, 张然, 等. 基于GEE和BRT的1984-2019年长三角生态绿色一体化发展示范区植被覆盖度变化[J]. 应用生态学报, 2021, 32(3): 1033-1044. Liu Y Y, Zeng P, Zhang R, et al. Vegetation coverage change of the demonstration area of ecologically friendly development in the Yangtze River Delta, China based on GEE and BRT during 1984-2019[J]. Chinese Journal of Applied Ecology, 2021, 32(3): 1033-1044. |
| [17] |
王漫漫, 陆昊, 李慧明, 等. 太湖流域典型河流重金属污染和生态风险评估[J]. 环境化学, 2016, 35(10): 2025-2035. Wang M M, Lu H, Li H M, et al. Pollution level and ecological risk assessment of heavy metals in typical rivers of Taihu basin[J]. Environmental Chemistry, 2016, 35(10): 2025-2035. DOI:10.7524/j.issn.0254-6108.2016.10.2016022301 |
| [18] |
王亚楠, 杨再福, 汪涛, 等. 太浦河流域土壤重金属污染状况分析及风险评价[J]. 环境工程, 2019, 37(1): 18-22. Wang Y N, Yang Z F, Wang T, et al. Analysis and risk assessment of heavy metals in soils of Taipu River basin[J]. Environmental Engineering, 2019, 37(1): 18-22. |
| [19] |
雷明丹, 王朝晖, 江涛. 青岛近岸海域表层沉积物生源要素分布及污染状况评价[J]. 海洋环境科学, 2021, 40(1): 93-100. Lei M D, Wang Z H, Jiang T. Distribution and pollution assessment of biogenic elements in surface sediments from Qingdao coastal area[J]. Marine Environmental Science, 2021, 40(1): 93-100. |
| [20] | Zhou Z K, Wang Y P, Yang H, et al. Sedimentary record of nutrients and sources of organic matter in the Shuanglong reservoir, Dianchi watershed, China[J]. Environmental Science and Pollution Research, 2021, 28(14): 17763-17774. DOI:10.1007/s11356-020-12085-0 |
| [21] | Yuan H W, Chen J F, Ye Y, et al. Sources and distribution of sedimentary organic matter along the Andong salt marsh, Hangzhou Bay[J]. Journal of Marine Systems, 2017, 174: 78-88. DOI:10.1016/j.jmarsys.2017.06.001 |
| [22] |
吴丹丹, 葛晨东, 高抒, 等. 长江口沉积物碳氮元素地球化学特征及有机质来源分析[J]. 地球化学, 2012, 41(3): 207-215. Wu D D, Ge C D, Gao S, et al. Carbon, nitrogen geochemical character and source analyses in Changjiang estuarine sediments[J]. Geochimica, 2012, 41(3): 207-215. DOI:10.3969/j.issn.0379-1726.2012.03.002 |
| [23] |
王毛兰, 赖建平, 胡珂图, 等. 鄱阳湖表层沉积物有机碳、氮同位素特征及其来源分析[J]. 中国环境科学, 2014, 34(4): 1019-1025. Wang M L, Lai J P, Hu K T, et al. Compositions and sources of stable organic carbon and nitrogen isotopes in surface sediments of Poyang Lake[J]. China Environmental Science, 2014, 34(4): 1019-1025. |
| [24] | Liu D Y, Li X, Emeis K C, et al. Distribution and sources of organic matter in surface sediments of Bohai Sea near the Yellow River Estuary, China[J]. Estuarine, Coastal and Shelf Science, 2015, 165: 128-136. DOI:10.1016/j.ecss.2015.09.007 |
| [25] | Sui J, Zhang J H, Ren S J, et al. Organic carbon in the surface sediments from the intensive mariculture zone of Sanggou Bay: distribution, seasonal variations and sources[J]. Journal of Ocean University of China, 2019, 18(4): 985-996. DOI:10.1007/s11802-019-3768-y |
| [26] | Ramaswamy V, Gaye B, Shirodkar P V, et al. Distribution and sources of organic carbon, nitrogen and their isotopic signatures in sediments from the Ayeyarwady (Irrawaddy) continental shelf, northern Andaman Sea[J]. Marine Chemistry, 2008, 111(3): 137-150. |
| [27] | Smits A P, Currinder B, Framsted N, et al. Watershed and lake attributes dictate landscape patterns of resource flows in mountain lakes[J]. Water Resources Research, 2021, 57(4). DOI:10.1029/2020WR027673 |
| [28] | Farooq T H, Chen X Y, Shakoor A, et al. Unraveling the influence of land-use change on δ13C, δ15N, and soil nutritional status in coniferous, broadleaved, and mixed forests in Southern China: a field investigation[J]. Plants, 2021, 10(8). DOI:10.3390/plants10081499 |
| [29] | Liu M, Hou L J, Xu S Y, et al. Organic carbon and nitrogen stable isotopes in the intertidal sediments from the Yangtze Estuary, China[J]. Marine Pollution Bulletin, 2006, 52(12): 1625-1633. DOI:10.1016/j.marpolbul.2006.06.008 |
| [30] | Jiang H, Zhang Q Q, Liu W J, et al. Climatic and anthropogenic driving forces of the nitrogen cycling in a subtropical river basin[J]. Environmental Research, 2021, 194. DOI:10.1016/j.envres.2021.110721 |
| [31] | Wang X, Wu X Y, Chen M, et al. Isotopic constraint on the sources and biogeochemical cycling of nitrate in the Jiulong River Estuary[J]. Journal of Geophysical Research: Biogeosciences, 2021, 126(3). DOI:10.1029/2020JG005850 |
| [32] | Chen X C, Feng M H, Ke F, et al. Source and Biogeochemical Distribution of Organic Matter in Surface Sediment in the Deep Oligotrophic Lake Fuxian, China[J]. Aquatic Geochemistry, 2018, 24(1): 55-77. DOI:10.1007/s10498-018-9330-5 |
| [33] |
陈旋, 李玉娥, 万运帆, 等. 基于13C、15N和C/N识别南岳小流域沉积有机质的来源[J]. 应用生态学报, 2021, 32(6): 1998-2006. Chen X, Li Y E, Wan Y F, et al. Tracing the sources of sedimentary organic matter in Nanyue small watershed based on 13C, 15N and C/N[J]. Chinese Journal of Applied Ecology, 2021, 32(6): 1998-2006. |
| [34] |
王欣, 陈欣瑶, 邹云, 等. 阳澄湖沉积物中氮、磷及有机质空间分布特征与污染评价[J]. 环境监控与预警, 2021, 13(3): 44-49. Wang X, Chen X Y, Zou Y, et al. Spatial distribution characteristics and pollution assessment of nitrogen, phosphorus and organic matter in sediments of Yangcheng Lake[J]. Environmental Monitoring and Forewarning, 2021, 13(3): 44-49. DOI:10.3969/j.issn.1674-6732.2021.03.009 |
| [35] |
原璐彬, 邢书语, 刘鑫, 等. 镇江市古运河和金山湖河湖上覆水体和沉积物氮及有机质分布特征及污染评价[J]. 环境科学, 2021, 42(7): 3186-3197. Yuan L B, Xing S Y, Liu X, et al. Distribution characteristics and pollution evaluation of nitrogen and organic matter in overlying water and sediment of Guyun River and Jinshan Lake in Zhenjiang City[J]. Environmental Science, 2021, 42(7): 3186-3197. |
| [36] |
张远, 张彦, 于涛. 太湖典型湖区沉积物外源有机质贡献率研究[J]. 环境科学研究, 2011, 24(3): 251-258. Zhang Y, Zhang Y, Yu T. Contribution rate of exogenous organic matter in sediments from typical areas of Taihu Lake[J]. Research of Environmental Sciences, 2011, 24(3): 251-258. |
| [37] | Zander F, Heimovaara T, Gebert J. Spatial variability of organic matter degradability in tidal Elbe sediments[J]. Journal of Soils and Sediments, 2020, 20(6): 2573-2587. DOI:10.1007/s11368-020-02569-4 |
| [38] | Gu Y G, Ouyang J, Ning J J, et al. Distribution and sources of organic carbon, nitrogen and their isotopes in surface sediments from the largest mariculture zone of the eastern Guangdong coast, South China[J]. Marine Pollution Bulletin, 2017, 120(1-2): 286-291. DOI:10.1016/j.marpolbul.2017.05.013 |
| [39] | Ausín B, Bruni E, Haghipour N, et al. Controls on the abundance, provenance and age of organic carbon buried in continental margin sediments[J]. Earth and Planetary Science Letters, 2021, 558. DOI:10.1016/j.epsl.2021.116759 |
| [40] | Amir M, Paul D, Samal R N. Sources of organic matter in Chilika lagoon, India inferred from stable C and N isotopic compositions of particulates and sediments[J]. Journal of Marine Systems, 2019, 194: 81-90. DOI:10.1016/j.jmarsys.2019.03.001 |
| [41] |
曹偲佳. 农村生活污水提质增效策略研究——以上海市青浦区为例[J]. 城市道桥与防洪, 2020(6): 111-113, 120. Cao S J. Study on strategies for improving quality and efficiency of rural domestic sewage[J]. Urban Roads Bridges & Flood Control, 2020(6): 111-113, 120. |
| [42] |
季永兴, 韩非非, 施震余, 等. 长三角一体化示范区水生态环境治理思考[J]. 水资源保护, 2021, 37(1): 103-109. Ji Y X, Han F F, Shi Z Y, et al. Thinking on water eco-environment management in regional integration demonstration area of Yangtze River Delta[J]. Water Resources Protection, 2021, 37(1): 103-109. |
| [43] | Chen M L, Zeng C, Zhang F, et al. Characteristics of dissolved organic matter from a transboundary himalayan watershed: relationships with land use, elevation, and hydrology[J]. ACS Earth and Space Chemistry, 2020, 4(3): 449-456. DOI:10.1021/acsearthspacechem.9b00329 |
| [44] | Liu C, Li Z W, Hu B X, et al. Identifying eroded organic matter sources in sediments at fluvial system using multiple tracers on the Loess Plateau of China[J]. CATENA, 2020, 193. DOI:10.1016/j.catena.2020.104623 |
| [45] |
马小亮, 吴晓东, 叶琳琳, 等. 青藏高原腹地不同植被下河流溶解性有机碳特征[J]. 环境科学与技术, 2018, 41(9): 79-84, 89. Ma X L, Wu X D, Ye L L, et al. Research of rivers in the Qinghai-Tibet Plateau with different types of vegetation regarding DOC content[J]. Environmental Science & Technology, 2018, 41(9): 79-84, 89. |
| [46] | Wu X, Nguyen-Sy T, Sun Z, et al. Soil organic matter dynamics as affected by land use change from rice paddy to wetland[J]. Wetlands, 2020, 40(6): 2199-2207. DOI:10.1007/s13157-020-01321-5 |
| [47] | Zhang Y, Lu X Q, Liu H L, et al. Identifying the sources of organic matter in marine and riverine sediments of Bohai Bay and its catchment using carbon and nitrogen stable isotopes[J]. Chinese Journal of Oceanology and Limnology, 2015, 33(1): 204-209. DOI:10.1007/s00343-015-4068-z |
| [48] |
隋桂荣. 太湖表层沉积物中OM、TN、TP的现状与评价[J]. 湖泊科学, 1996(4): 319-324. Sui G R. Statement and evaluation of organic matter, total nitrogen and total phosphate in surface layer sediments in Taihu Lake[J]. Journal of Lake Sciences, 1996(4): 319-324. |
| [49] |
张杰, 汪院生, 郭西亚, 等. 草型湖区沉积物营养盐分布与污染评价[J]. 环境科学, 2019, 40(10): 4497-4504. Zhang J, Wang Y S, Guo X Y, et al. Distribution and pollution assessment of nutrients in the surface sediments of a macrophyte-dominated Zone in lake Taihu[J]. Environmental Science, 2019, 40(10): 4497-4504. |
| [50] |
王书锦, 刘云根, 张超, 等. 洱海流域入湖河口湿地沉积物氮、磷、有机质分布及污染风险评价?[J]. 湖泊科学, 2017, 29(1): 69-77. Wang S J, Liu Y G, Zhang C, et al. Distribution and pollution risk assessment of nitrogen, phosphorus and organic matter in inlet rivers of Erhai Basin[J]. Journal of Lake Sciences, 2017, 29(1): 69-77. |
| [51] | Bao R, Blattmann T M, McIntyre C, et al. Relationships between grain size and organic carbon 14C heterogeneity in continental margin sediments[J]. Earth and Planetary Science Letters, 2019, 505: 76-85. DOI:10.1016/j.epsl.2018.10.013 |
| [52] | Lalimi F Y, Silvestri S, D'Alpaos A, et al. The spatial variability of organic matter and decomposition processes at the marsh scale[J]. Journal of Geophysical Research: Biogeosciences, 2018, 123(12): 3713-3727. DOI:10.1029/2017JG004211 |