 2022, Vol. 43


2. 南京信息工程大学气象灾害预报预警与评估协同创新中心, 气象灾害教育部重点实验室, 南京 210044;
3. 江苏省农业气象重点实验室, 南京信息工程大学应用气象学院, 南京 210044
2. Key Laboratory of Meteorological Disaster, Ministry of Education (KLME), Collaborative Innovation Center on Forecast and Evaluation of Meteorological Disasters (CIC-FEMD), Nanjing University of Information Science & Technology, Nanjing 210044, China;
3. Jiangsu Key Laboratory of Agricultural Meteorology, College of Applied Meteorology, Nanjing University of Information Science and Technology, Nanjing 210044, China
PM2.5是指大气颗粒物中动力学直径≤2.5 μm的粒子, 其来源和组成复杂, 对人体健康和环境质量有很大的影响.面对我国日趋严重的大气污染, 近年来针对PM2.5的研究已成为各部门关注的焦点.其中, 有机气溶胶(organic aerosols, OAs)是大气颗粒物的重要组成部分, 占PM2.5质量的20%~60%[1, 2], 由来自不同源的化合物组成, 有着不同的物理、化学特性[3, 4], 在不同程度上影响着气候效应和人体健康[5].
有机气溶胶组成复杂, 多环芳烃(polycyclic aromatic hydrocarbons, PAHs)和正构烷烃(normal alkanes, n-alkanes)是其中重要的非极性化合物部分.正构烷烃的主要来源是生物体的脂肪酸、蜡质和烃类物质[6], 水生藻类和微生物是碳数低于20的短链正构烷烃的主要贡献者[7], 而C26~C36这类高分子量正构烷烃来源于陆生高等植物蜡[8].其中高分子量的正构烷烃危害性相对低分子量更高, 更易吸附在细颗粒物表面, 对人体呼吸系统有重要的影响[9, 10].多环芳烃占比虽然较低, 却不容忽视, 主要来源于生物质的不完全燃烧和化石燃料燃烧等人为过程[9~11], 另外也有自然排放, 包括火山喷发等[12, 13], 具有致癌、致毒和致畸性[14, 15]等特点, 美国环保署(U. S. Environmental Protection Agency, EPA)将其列为优先控制的环境污染物, 共16种[16~18].
目前国内外对长三角、北京和东北等地区有机气溶胶的组成以及来源已有较多研究, 采用多种分析方法, 包括特征比值法[19~22]、主成分分析法(principal component analysis, PCA)[23~25]、有机分子标志物法[26, 27]和同位素分析法等[28].Liu等[29]的研究利用生物质燃烧示踪剂与卫星数据结合以及模式运算的方式, 发现长三角的生物质燃烧信号来自东南地区短时大面积的秸秆燃烧活动. Chen等[30]的研究综合运用特征比值法和正定矩阵因子分解(positive matrix factorization, PMF), 发现在观测期间青藏高原东南部受人为污染和自然排放的共同影响, 冬季家庭采暖会排放大量正构烷烃.本地多环芳烃来源依次为生物质燃烧、汽油燃烧、住宅燃烧和煤燃烧, 另外, 还受印度生物质燃烧传输的影响. Zheng等[31]研究了东南亚春季生物质燃烧对东京湾附近海洋有机气溶胶的影响, 结合稳定碳同位素方法, 分析了5类化合物发现: 生物质燃烧是东京湾上空有机气溶胶的重要来源.此外, 左旋葡聚糖常与其他化合物进行相关性分析, 是植物纤维素热解产生的一种脱水糖, 作为生物质燃烧最常用的指示剂[32].
大多有机气溶胶的研究集中在长三角、珠三角和京津冀等发达地区[20, 33, 34], 对于我国西南地区有机气溶胶的分析较少.另外东南亚作为生物质燃烧旺盛区域, 燃烧集中期在干燥的3月和4月, 此时盛行偏西风[31, 35], 广西不仅毗邻东南亚生物质燃烧旺盛的地区, 可能受到传输影响, 还靠近珠三角经济发达的贸易区, 可能受到船舶排放影响, 选取广西作为采样点有十分重要的意义.另外采样站点位于十万大山腹地, 人烟稀少, 受到本地人为排放污染小, 可作为背景点参考.因此, 本研究在广西十万大山腹地布设站点, 通过采集PM2.5颗粒物, 分析多环芳烃和正构烷烃的浓度变化特征及来源, 结合后向轨迹和主成分分析法探讨污染物的潜在来源, 对华南地区污染防控有重要意义.
1 材料与方法 1.1 研究区域与样品采集采样点位于广西防城港市郊区南屏乡常隆村(20°48′35″N, 107°38′02″E), 海拔高度为759 m, 处在十万大山腹地, 靠近东南亚生物质燃烧旺盛区域, 并且临近珠三角经济发达的贸易区.采样时间为2017年11月至2018年10月, 一周采一次, 流量为1.05 m3·min-1, 每次采样时长为48 h(崂应2031, 青岛崂山应用技术研究所).共采集45个PM2.5样品, 冬季16个, 春季10个, 夏季11个, 秋季8个, 采集完成后放入-26℃的环境中冷藏待测.

|
图 1 采样地点示意 Fig. 1 Sampling location indication |
碳质组分的测定使用全自动半连续式OC/EC分析仪(Sunset Laboratory, 美国), 切取1.5 cm2样品膜在石英炉纯氦气环境下经不同加热程序挥发有机碳(OC), 随后升温在氦氧混合气(10%氧气)中氧化元素碳(EC)生成气态氧化物, 两种气体经催化转化为CO2, 后用非散射红外法定量.每个样品测定后使用CH4/CO2标准气校正仪器, 每日进样前使用蔗糖标准溶液定标.
1.2.2 左旋葡聚糖测定左旋葡聚糖(levoglucosan, Lev)利用离子色谱(ICS 5000+, Thermo Scientific)进行测定, 样品预处理方法为: 用打孔器(punch)切1~2片20 mm直径的样品膜, 并加入8 mL超纯水(Milli-Q Reference, 美国), 经过30 min的超声萃取, 再用0.22 μm的过滤器(水相针式, 聚四氟乙烯滤膜)过滤, 最后进行仪器测定.
1.2.3 非极性化合物测定采用安捷伦气相色谱质谱仪(Agilent GC7890B/MS 5977A)的热脱附(TD)方法测定PAHs和n-alkanes化合物浓度.使用30 m×0.25 mm×0.25 μm规格的毛细管柱, 用打孔器切下半径为0.15 cm的样品膜2~3片, 放进TD内衬管, 进样口初始温度为35℃, 运行5 s, 然后以12℃·min-1升温到300℃; 柱箱初始温度为35℃, 运行3 min, 然后以10℃·min-1升温到120℃, 运行11.5 min, 再以4℃·min-1升温到146℃, 运行18 min, 最后以8℃·min-1升温到310℃, 保持16 min并运行54.5 min.高纯氦气作为载气的流速为1.0 mL·min-1, 进样方式为分流比5∶1的分流进样, 进样体积为1 μL, 将六甲基苯作为内标物质, 采用内标法进行定量.共测定了17种PAHs: 萘(Nap)、苊烯(Acy)、二氢苊(Ace)、芴(Flu)、菲(Phe)、蒽(Ant)、荧蒽(Flua)、芘(Pyr)、苯并[a]蒽(BaA)、䓛(Chry)、苯并[b]荧蒽(BbF)、苯并[k]荧蒽(BkF)、苯并[e]芘(BeP)、苯并[a]芘(BaP)、二苯并[a, h]蒽(DahA)、茚并[1, 2, 3-cd]芘(IcdP)和苯并[g, h, i]苝(BghiP); 20种C16~C35的n-alkanes.
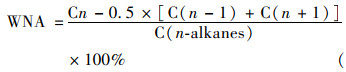
1.2.4 特征比值法分析特征比值法常用于有机气溶胶的朔源研究中[12, 33, 36]. n-alkanes的诊断方法包括两种: 最大碳数(Cmax)和碳偏好指数(carbon preference index, CPI), 用来评估n-alkanes的相对贡献. CPI为奇数碳烷烃与偶数碳烷烃浓度和的比值, 常作为估量化石源和生物源排放贡献的一个定性指标: 当n-alkanes以植物蜡源为主时CPI值通常较高(CPI>5), 而当n-alkanes以化石源排放为主时CPI值接近1[7, 37]:

|
(1) |
WaxCn为含碳数为n的正构烷烃的植物蜡源部分的浓度贡献:

|
(2) |
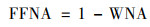
WNA为植物蜡的贡献率(%), 计算如下:
|
(3) |
FFNA(fossil fuel n-alkanes, FFNA)为化石燃料贡献率(%):
|
(4) |
主成分分析法(PCA)是一种最广泛的数据降维计算的统计学方法.现通常用来分析研究有机气溶胶组分的来源[19, 21, 36, 38], 本研究使用SPSS 25进行计算, 再通过因子旋转和回归分析, 最后确定不同源的贡献率.
1.2.6 后向气流轨迹分析本研究利用拉格朗日计算模型: HYSPLIT-4进行后向轨迹分析, 选择500 m高度上向后48 h轨迹模拟, 每隔6 h输出一条轨迹, 再进行聚类分析, 气象数据是美国国家海洋和大气管理局(NOAA)在全球数据管理系统(GDAS)上发布的.火点数据从FIRMS(fire information for resoutce management system)网站获得.
1.3 控制变量每次采样前需对仪器状态进行检查, 包括流速、流量和时间的检查, 采样期间每周需要对切割头进行清洗, 每个月进行一次野外空白采样, 作为平行样品.实验过程中, 每天需要打入一个2mg·L-1的标准和一个空白, 以此来检验仪器状态是否正常.每切一个样品膜之前需对镊子和打孔器进行清洗, 使用二氯甲烷∶甲醇体积比为2∶1的混合溶液, 减少实验误差.另外参考美国环境保护署(EPA)方法[16], 进行实验室回收率实验, 并对所有样品进行空白校正, 空白样品低于真实样品中对应目标化合物浓度的20%, 对后续目标化合物定量无明显影响.各化合物的标准曲线相关系数达0.99以上, 满足后续测样要求, 氘代内标的回收率为70%~120%, 满足定量分析的要求, 所有物质均高于检测限.
2 结果与讨论从2017年11月至2018年10月进行野外样品采集, 分析了PM2.5中的相关化学组分: PAHs和n-alkanes, 其相关浓度见图 2和表 1.采样期间, ρ(PM2.5)的年平均值为(35.31±21.86)μg·m-3, 变化范围在13.9~91.2μg·m-3, 其中有21 d低于我国大气环境质量标准24 h日均一级浓度限值(35μg·m-3)[39], 41d低于二级浓度限值(75μg·m-3).研究区域的OC和EC年平均值分别是(2.90±2.5) μg·m-3和(0.41±0.34) μg·m-3, 远远低于北京夏季农村地区[40, 41], PAHs和n-alkanes的年平均值分别是(4.28±4.25)ng·m-3和(13.70±14.72)ng·m-3, 低于其他背景站点如长三角背景点临安[ρ(PAHs): 25 ng·m-3, ρ(n-alkanes): 60 ng·m-3][42], 高于其他城市地区如拉萨西郊[ρ(n-alkanes): (10± 6.6)ng·m-3][43], 与喜马拉雅相当[ρ(PAHs): 5.57 ng·m-3][44], 表明该区域适宜作为背景点进行研究.

|
图 2 采样期间PM2.5中各组分浓度时间变化特征 Fig. 2 Temporal variation in the concentration of each component in PM2.5 during the sampling period |
|
|
表 1 采样期间不同组分不同季节的平均值1) Table 1 Average concentrations of different components in different seasons during sampling period |
OC的主要来源是燃烧排放[41, 45], 也可以是植物孢子、花粉和藻类等微小生物直接排放形成气溶胶[46], 在冬季明显高于其他季节, 但远低于东南亚地区[45], 表明冬季相比其他季节受到的燃烧或者生物排放影响更大, 而整个地区受到的影响较小.结合图 2和表 1可知, PAHs、n-alkanes、Lev、OC和EC的变化趋势一致, 其中PAHs和n-alkanes各季节的总浓度变化均为: 冬季[(7.86±5.19)ng·m-3, (27.51±16.9)ng·m-3]>春季[(2.73±1.76)ng·m-3, (7.64±4.71ng·m-3]>秋季[(2.34±1.45)ng·m-3, (7.01±4.55)ng·m-3]>夏季[(1.91±1.67)ng·m-3, (3.98±3.12)ng·m-3].具体来说, 中高环PAHs(4~6环)的浓度高于低环(2环和3环)浓度.高分子量(含碳数>25)的n-alkanes浓度高于低分子量的浓度(含碳数 < 20), 总体年平均值为(17.70±14.72)ng·m-3, n-alkanes整体浓度相较于PAHs要高出3~4倍, 在PM2.5中所占含量极低, 仅0.39%, 却不容忽视.Lev作为生物质燃烧的常用示踪剂[47], 在化合物中占有较高的数量级, 是植物热解产生的一种脱水糖[32], 与OC有着较好的相关性(r=0.69), 对研究该区域的污染来源有一定的指示作用.在春季的Lev浓度最低, 这与临安背景地点不同[38], 表明在春季受到的生物质燃烧影响较低.
为探究研究区域不同季节下有机污染物的传输模式, 对四季进行后向轨迹分析.结果如图 3所示, 冬季气团轨迹分成了5个聚类, 其中聚类2和聚类3分别占了20%和30%, 有50%的气团污染来自低空海洋传输, 采样点靠近广西最南部的北部湾, 临近港口, 既沿海又沿边, 与东盟各国海陆相连, 经济贸易加速发展中, 推测有交通运输的影响.聚类1占比24%, 主要来自采样点附近, 结合图 2, 12月22日OC浓度较高, 且该日前后在本地有极明显的火点, 属于本地源排放, 聚类4和5共占26%, 来自北方高空远距离传输.春季有5个聚类, 有69%来自海洋传输, 有8%的气团来自泰国, 图 2中显示在4月16日污染较高, 通过检查火点数据发现该日前后有密集的生物质燃烧, 且从单日气流轨迹可知是来自泰国、越南和老挝等地, 还有19%来自本地源排放.夏季, 在季风的影响下有37%气溶胶来自泰国, 此外还有19%的气溶胶来自港口地区, 18%来自东部南海, 26%来自广西中部地区.秋季有4个聚类, 43%来自广东西部地区短距离传输, 27%来自广西北部的湖南, 另外还有来自海洋上污染排放的影响.总体来说, 采样点的污染源分为海洋源, 远距离传输和本地源.

|
图 3 采样点2018年48 h后向轨迹 Fig. 3 Sampling point 48-hour backward trajectory in 2018 |
本研究测定了20种n-alkanes(C16~C35), 表 1给出了这些化合物不同季节以及年平均值.从图 4(a)中n-alkanes的季节变化规律和图 4(b)中不同碳数n-alkanes的占比可知, 冬季和春季平均n-alkanes占比较高, 别占到59.6%和16.6%, 其次是秋季和夏季, 占15.2%和8.6%.其中, 全年含量最高的是C29, 其次是C31和C27, 各季节的Cmax为冬季(C31)、春季(C29)、夏季(C29)和秋季(C31), 体现了植物源的排放特征[8]. C19在秋季有明显较高的占比, Tian等[48]的研究指出燃煤和锅炉燃烧会在C16~C19产生一个较高的峰值. n-alkanes随碳数的变化在四季有一定的相似规律, 其来源贡献可以解释丰度变化模式, 从C26开始有明显的奇偶差异, 且奇数碳烷烃高于偶数碳烷烃, 表明高等植物蜡的排放强于人为排放的影响[49].

|
图 4 正构烷烃的平均值及各季节占比 Fig. 4 Average of n-alkanes and the percentage of each season |
有研究表明, 人为源和生物源均是大气中n-alkanes的来源[36, 37], 人为源主要贡献包括化石燃料燃烧和生物质燃烧[8], 而植物蜡排放、花粉和生物体内的脂肪酸是生物源的主要贡献者[24].化石燃料燃烧主要排放含碳数低于25的n-alkanes[28]; 而高等陆生植物主要排放含碳数高于26的n-alkanes, 奇数碳烷烃的含量远高于偶数碳的含量[50].该采样点作为广西背景点, 不仅受到本地源的影响, 还有远距离输送带来的人为污染影响.同时采样点处在十万大山腹地, 植被茂盛, 因此会释放大量的脂肪族化合物[33].为比较化石源和自然源的相对贡献, 本研究计算了CPI、WNA和FFNA[1, 13, 37], 结果如表 2显示.
|
|
表 2 采样点不同季节PM2.5中正构烷烃和多环芳烃的诊断值 Table 2 Diagnostic ratios of n-alkanes and PAHs in PM2.5 in different seasons at sampling site |
观测期间, 冬季CPI值为1.45, 春季1.90, 夏季1.50, 秋季1.53, 这表明采样期间正构烷烃是由化石源和自然源共同作用的[49].春季CPI值接近2, 表明在春季生物源的贡献会相对较高, 在冬季化石燃料燃烧等人为排放影响较大; 各季节生物源的贡献分别为: 春季(30.6%)>秋季(20.6%)>夏季(19.2%)>冬季(18.9%), 这与CPI值的研究结果一致.在春季植物生长旺盛, 此外东南亚处于生物质燃烧旺盛的季节, 图 3中后向轨迹发现有小部分气团污染来自泰国等地, 影响了春季高等植物蜡的排放贡献.夏季气团较为干净, 但化石源占比较高, 结合后向轨迹发现, 来自海洋传输, 推测是船舶交通运输的影响.
2.2 多环芳烃来源解析大气中PAHs是一种混合物[8], 主要由煤和石油等化石燃料及木材和烟草等含碳氢化合物不完全燃烧或热解所形成[51].本研究测定了17种PAHs在颗粒物样品中的丰度, 并确定了每种物质在不同季节的浓度变化情况.从表 1和图 5(a)可知, 其中浓度大小顺序为: BghiP(6环)>BbF(5环)>IcdP(6环)>BeP(5环)>BaP(5环), 从图 5(b)和5(c)可知, 各物质在冬季中含量最高, 表明在冬季受到的燃烧影响最大, 总PAHs在各季节中的占比分别为冬季(53%)>春季(18.4%)>秋季(15.7%)>夏季(12.9%).从图 5(d)可知, 各季节中5环PAHs的占比最高, 其次是6、4、3和2环.

|
图 5 PAHs的平均值和占比 Fig. 5 Average and percentage of PAHs |
为了确定PAHs的来源, 采用诊断率来进行具体解析, 本研究通过计算IdcP/(IdcP+BghiP)、BaA/(BaA+Chr)、Flua/(Flua+Pyr)、(BaP+BeP)/BghiP和BaP/BghiP来探究广西背景点不同季节中多环芳烃的潜在来源污染, 具体计算结果见表 2.当IdcP/(IdcP+BghiP) < 0.2时, 代表石油源, 在0.2~0.5之间表示污染来自石油燃烧和燃煤的混合源, >0.5时表示生物质燃烧[13]; 当BaA/(BaA+Chr) < 0.2时代表了石油源, 0.2~0.35时表示燃煤源和汽油源, 0.35~0.5来自燃煤排放, >0.5时表示生物质燃烧[11]; 当Flua/(Flua+Pyr) < 0.4时代表了石油源, 0.4~0.5代表了化石燃料燃烧, >0.5时表示生物质燃烧[37].
本研究IdcP/(IdcP+BghiP)四季的均值在0.4左右, 表明IdcP和BghiP多来源于燃煤以及化石燃料燃烧; BaA/(BaA+Chr)也在0.4左右, 表明这两种污染物多由燃煤排放; Flua/(Flua+Pyr)四季均在0.5左右波动, 是化石燃料、燃煤、生物质燃烧的混合源.另外, 通过计算BeP/(BaP+BeP)来判断气溶胶的光解老化程度[9], BeP光学性质稳定, 不易老化分解, BaP更容易光解老化, 比值越大说明老化程度越大.本研究中BeP/(BaP+BeP)四季均在0.6左右, 说明本次研究中气溶胶老化程度相对较高.冬季和秋季污染程度相对较高, 气溶胶光解老化程度相对较低, 冬季和秋季BghiP主要由生物质不完全燃烧产生.而夏季清洁大气加上高温加速了气溶胶光解老化, 导致(BaP+BeP)/BghiP和BaP/BghiP相对冬季和春季要低, 主要是交通排放污染.而春季气溶胶受远距离污染输送的影响, 光解老化程度升高, (BaP+BeP)/BghiP和BaP/BghiP也是相对较低, 这与上文所得的结论一致.
2.3 主成分分析(PCA)特征比值法只能定性表征污染潜在来源, 为了更有效识别不同季节下污染源的贡献, 利用SPSS 25对研究区域不同季节进行主成分分析(PCA).其中2环和3环的PAHs浓度过低, 且在传输过程中易降解[44], BaP易光解氧化[13], 因此选取了中高环的多环芳烃进行分析; 低碳数的n-alkanes受温度影响较大[53], 各季节中Cmax贡献较高的是C29和C31, 因此选取典型低分子量C23和C24以及高分子量C29和C31进行分析.另外Lev作为典型的生物质燃烧示踪剂[32], 增加了结论的可靠性.由于秋季样品量过少, 导致分析结果出现较大误差, 这里就不予讨论.
PCA结果如表 4所示, 提取了特征值大于1的物质, 并进行旋转, 各季节的因子均能解释总变量的90%以上.其中冬季提取了3个因子, 因子1解释了总变量的41.5%, 其中载荷较高的化合物是BbF、BkF、BeP、IcdP、DahA和BghiP, BbF和BkF作为柴油排放的指示物[37], BeP、IcdP和BghiP作为汽油燃烧排放指示物[51], 此外采样点靠近北部湾, 与东盟国家进行经济贸易, 船舶运输较多, 结合后向轨迹结果分析[图 3(a)]和表 2可知: 有50%的气团来自东部和南部的海洋, CPI为1.45, IdcP/(IdcP+BghiP)的值为0.44, 是石油和化石燃料燃烧的混合源, 也验证了之前的猜想, 因此因子1解释为汽油和柴油燃烧; 因子2载荷较高的是Flua、Pyr、BaA和Chr, 这4种物质通常用来指示燃煤排放[48], 且表 2显示Flua/(Flua+Pyr)的值为0.51, 表明是生物质燃烧的影响, 另外低分子量的n-alkanes与Lev的荷载也相对较高, 主要是生物质燃烧排放, 因此因子2归为燃煤源以及生物质燃烧源; 因子3中高分子量n-alkanes的荷载较高, 然而PAHs的荷载都比较低, 左旋葡聚糖与之相关性也不高, 因此因子3解释为本地自然源排放, 主要包括植物蜡排放.
|
|
表 4 不同季节中多环芳烃和正构烷烃的旋转因子载荷1) Table 4 Rotation factor loading of PAHs and n-alkanes |
春季提取了3个因子, 因子1和2与冬季相似, 但在因子2中左旋葡聚糖与其他物质相关性不高, 因此因子2解释为燃煤源; 因子3中多环芳烃的贡献较低, 其大气寿命小于左旋葡聚糖[32], C29和C31与左旋葡聚糖荷载较高, 相关性也好, 图 3(b)中显示有8%的气团来自泰国和老挝地区, 表明本地受到了远距离传输的影响, 在传输过程中低环的多环芳烃降解, 另外春季是东南亚生物质燃烧旺盛的季节[35, 54], 燃烧也会产生高分子量的n-alkanes, 因此因子3解释为生物质燃烧, 解释了变量的26.1%, 这与上文结论一致.
夏季提取了3个因子, 因子1解释了变量的53.4%, 后向轨迹结果中显示有37%来自海洋传输[图 3(c)], 与冬季相似, 柴油排放的指示物的荷载较高, 且结合表 2结果: IdcP/(IdcP+BghiP)的值为0.41, 因此因子1归为交通源; 因子2中荷载较高的是C29和C31, 左旋葡聚糖与之相关性不高, 表明来自高等植物蜡排放, 因此解释为自然源; 因子3中除左旋葡聚糖荷载较高外, 其余贡献较低, 图 3(c)显示聚类5有37%来自泰国和老挝地区, 此时处于非生物质燃烧旺盛的季节, 是在季风的影响下, 气团污染传输到本地, 虽然传输量大, 但影响较小, 解释了变量的10.6%, 因此因子3归为生物质燃烧传输影响(生物质燃烧2).综合表明, 广西郊区的空气污染主要来源于燃煤、交通排放、生物质燃烧以及植物排放.
3 结论(1) 2018年广西ρ(PM2.5)年平均值为(35.31±21.86) μg·m-3, ρ(OC)和ρ(EC)平均值依次为(2.9±2.53) μg·m-3和(0.41±0.34) μg·m-3, 分别占PM2.5的8.7% 和1.8%.左旋葡聚糖是重要的生物质燃烧示踪剂, 在冬季有较高的浓度.多环芳烃和正构烷烃的季节变化规律一致, 均是冬季和春季浓度高, 秋季和夏季浓度低. PAHs中5环和6环的分子占比较大, 超过60%, 其次是中低环分子(4环和3环); n-alkanes中高分子量占比较高(C29>C31>C27), 且奇偶碳数有明显差异.其在PM2.5颗粒中虽占比较低, 不足1%, 但由于较大的危害性而不容忽视.
(2) 综合运用特征比值法、正定矩阵因子分解法和后向轨迹发现: 冬季非极性有机气溶胶中41.5%受港口船舶交通排放、海洋源输送影响, 36.7%的污染贡献来自燃煤和局地生物质燃烧; 春季, 污染气团中有25.2%来自生物质燃烧传输影响, 45.0%来自研究区域南部的海洋输送, 高等植物蜡排放污染较高; 夏季, 53.4%气团污染来自船舶交通源传输, 10.6%的燃烧污染来自西南泰国的跨境输送; 秋季燃煤占比较高.广西虽然靠近东南亚生物质燃烧旺盛区域, 但在春季受到的影响较低.因靠近珠三角地区, 受海上船舶排放的传输影响较高.
| [1] | Song Y, Zhang Y, Dai W. PM2.5 Sources and their effects on human health in China: case report[A]. In: Nriagu J (Ed. ). Encyclopedia of Environmental Health (2nd ed. )[M]. Amsterdam: Elsevier, 2019. |
| [2] | Shang J, Khuzestani R B, Tian J Y, et al. Chemical characterization and source apportionment of PM2.5 personal exposure of two cohorts living in urban and suburban Beijing[J]. Environmental Pollution, 2019, 246: 225-236. DOI:10.1016/j.envpol.2018.11.076 |
| [3] | Li J J, Li J, Wang G H, et al. Molecular characteristics of organic compositions in fresh and aged biomass burning aerosols[J]. Science of the Total Environment, 2020, 741. DOI:10.1016/j.scitotenv.2020.140247 |
| [4] | Bhattarai H, Saikawa E, Wan X, et al. Levoglucosan as a tracer of biomass burning: recent progress and perspectives[J]. Atmospheric Research, 2019, 220: 20-33. DOI:10.1016/j.atmosres.2019.01.004 |
| [5] | 王丽萍, 谢栓栓, 王昌惠. PM2.5对呼吸系统疾病的影响及其相关机制[J]. 临床肺科杂志, 2019, 24(1): 148-151. DOI:10.3969/j.issn.1009-6663.2019.01.037 |
| [6] |
衣雅男, 侯战方, 杨千才, 等. 泰安市夏季PM2.5中正构烷烃和糖类化合物的化学组成及其来源[J]. 环境科学, 2020, 41(3): 1045-1055. Yi Y N, Hou Z F, Yang Q W, et al. Chemical compositions and sources of n-alkanes and saccharides in PM2.5 from Taian City during the summer[J]. Environmental Science, 2020, 41(3): 1045-1055. |
| [7] | Hernández-Guzmán F A, Macías-Zamora J V, Ramírez-álvarez N, et al. Source identification of n-alkanes and isoprenoids using diagnostic ratios and carbon isotopic composition on crude oils and surface waters from the Gulf of Mexico[J]. Environmental Monitoring and Assessment, 2021, 193(10). DOI:10.1007/s10661-021-09440-0 |
| [8] | Medi Dc' A, Lješevi Dc' M, Inui H, et al. Efficient biodegradation of petroleum n-alkanes and polycyclic aromatic hydrocarbons by polyextremophilic Pseudomonas aeruginosa san ai with multidegradative capacity[J]. RSC Advances, 2020, 10(24): 14060-14070. DOI:10.1039/C9RA10371F |
| [9] | Dat N D, Chang M B. Review on characteristics of PAHs in atmosphere, anthropogenic sources and control technologies[J]. Science of the Total Environment, 2017, 609: 682-693. DOI:10.1016/j.scitotenv.2017.07.204 |
| [10] | Ghanavati N, Nazarpour A, Watts M J. Status, source, ecological and health risk assessment of toxic metals and polycyclic aromatic hydrocarbons (PAHs) in street dust of Abadan, Iran[J]. CATENA, 2019, 177: 246-259. DOI:10.1016/j.catena.2019.02.022 |
| [11] | Lamichhane S, Krishna K C B, Sarukkalige R. Polycyclic aromatic hydrocarbons (PAHs) removal by sorption: a review[J]. Chemosphere, 2016, 148: 336-353. DOI:10.1016/j.chemosphere.2016.01.036 |
| [12] | Zhang K, Yang L M, Li Q, et al. Hourly measurement of PM2.5-bound nonpolar organic compounds in Shanghai: characteristics, sources and health risk assessment[J]. Science of the Total Environment, 2021, 789. DOI:10.1016/j.scitotenv.2021.148070 |
| [13] | Li Y Z, Juhasz A L, Ma L Q, et al. Inhalation bioaccessibility of PAHs in PM2.5: implications for risk assessment and toxicity prediction[J]. Science of the Total Environment, 2019, 650: 56-64. DOI:10.1016/j.scitotenv.2018.08.246 |
| [14] | Ho S S H, Li L J, Qu L L, et al. Seasonal behavior of water-soluble organic nitrogen in fine particulate matter (PM2.5) at urban coastal environments in Hong Kong[J]. Air Quality, Atmosphere & Health, 2019, 12(4): 389-399. |
| [15] | Ji Y M, Zhao J, Terazono H, et al. Reassessing the atmospheric oxidation mechanism of toluene[J]. Proceedings of the National Academy of Sciences of the United States of America, 2017, 114(31): 8169-8174. DOI:10.1073/pnas.1705463114 |
| [16] | Li J L, Wang Y X, Zhang C X, et al. The source apportionment of polycyclic aromatic hydrocarbons (PAHs) in the topsoil in Xiaodian sewage irrigation area, North of China[J]. Ecotoxicology, 2014, 23(10): 1943-1950. DOI:10.1007/s10646-014-1328-1 |
| [17] | Kumar V, Kothiyal N C, Saruchi, et al. Sources, distribution, and health effect of carcinogenic polycyclic aromatic hydrocarbons (PAHs)-current knowledge and future directions[J]. Journal of the Chinese Advanced Materials Society, 2016, 4(4): 302-321. DOI:10.1080/22243682.2016.1230475 |
| [18] | Nassar H F, Tang N, Toriba A, et al. Environmental carcinogenic polycyclic aromatic hydrocarbons (PAHs): concentrations, sources and hazard effects[J]. International Journal of Advanced Research, 2015, 3(10): 511-524. |
| [19] | Wang F W, Lin T, Li Y Y, et al. Comparison of PM2.5 carbonaceous pollutants between an urban site in Shanghai and a background site in a coastal East China Sea island in summer: concentration, composition and sources[J]. Environmental Science: Processes & Impacts, 2017, 19(6): 833-842. |
| [20] | Wang Q Q, He X, Zhou M, et al. Hourly measurements of organic molecular markers in urban Shanghai, China: primary organic aerosol source identification and observation of cooking aerosol aging[J]. ACS Earth and Space Chemistry, 2020, 4(9): 1670-1685. DOI:10.1021/acsearthspacechem.0c00205 |
| [21] | Liu D, Vonwiller M, Li J, et al. Fossil and non-fossil fuel sources of organic and elemental carbonaceous aerosol in Beijing, Shanghai, and Guangzhou: seasonal carbon source variation[J]. Aerosol and Air Quality Research, 2020, 20(11): 2495-2506. DOI:10.4209/aaqr.2019.12.0642 |
| [22] | Lin C S, Huang R J, Xu W, et al. Comprehensive source apportionment of submicron aerosol in Shijiazhuang, China: secondary aerosol formation and holiday effects[J]. ACS Earth and Space Chemistry, 2020, 4(6): 947-957. DOI:10.1021/acsearthspacechem.0c00109 |
| [23] | Lanzafame G M, Srivastava D, Favez O, et al. One-year measurements of secondary organic aerosol (SOA) markers in the Paris region (France): concentrations, gas/particle partitioning and SOA source apportionment[J]. Science of the Total Environment, 2021, 757. DOI:10.1016/j.scitotenv.2020.143921 |
| [24] | Langner J, Gidhagen L, Bergström R, et al. Model-simulated source contributions to PM2.5 in Santiago and the central region of Chile[J]. Aerosol and Air Quality Research, 2020, 20(5): 1111-1126. DOI:10.4209/aaqr.2019.08.0374 |
| [25] | Hu R L, Xu Q C, Wang S X, et al. Chemical characteristics and sources of water-soluble organic aerosol in Southwest suburb of Beijing[J]. Journal of Environmental Sciences, 2020, 95: 99-110. DOI:10.1016/j.jes.2020.04.004 |
| [26] | Drosatou A D, Skyllakou K, Theodoritsi G N, et al. Positive matrix factorization of organic aerosol: insights from a chemical transport model[J]. Atmospheric Chemistry and Physics, 2019, 19(2): 973-986. DOI:10.5194/acp-19-973-2019 |
| [27] | Booyens W, Beukes J P, van Zyl P G, et al. Assessment of polar organic aerosols at a regional background site in Southern Africa[J]. Journal of Atmospheric Chemistry, 2019, 76(2): 89-113. DOI:10.1007/s10874-019-09389-y |
| [28] |
李存林, 马素萍, 常福宣, 等. 青藏高原北部土壤正构烷烃氢同位素及物源意义[J]. 中国环境科学, 2019, 39(5): 2095-2105. Li C L, Ma S P, Chang F Y, et al. n-Alkanes hydrogen isotopes in soil from the Northern region, Tibetan Plateau: implications for sources of organic matter[J]. China Environmental Science, 2019, 39(5): 2095-2105. DOI:10.3969/j.issn.1000-6923.2019.05.038 |
| [29] | Liu X Y, Zhang Y L, Peng Y R, et al. Impacts of regional-transported biomass burning emissions on chemical and optical properties of carbonaceous aerosols in Nanjing, East China[J]. Atmospheric Chemistry & Physics Discussions, 2019. DOI:10.5194/acp-2018-1029 |
| [30] | Chen Y, Cao J J, Zhang J, et al. n-alkanes and polycyclic aromatic hydrocarbons in total suspended particulates from the Southeastern Tibetan Plateau: concentrations, seasonal variations, and sources[J]. Science of the Total Environment, 2014, 470-471: 9-18. DOI:10.1016/j.scitotenv.2013.09.033 |
| [31] | Zheng L S, Yang X Y, Lai S C, et al. Impacts of springtime biomass burning in the Northern Southeast Asia on marine organic aerosols over the Gulf of Tonkin, China[J]. Environmental Pollution, 2018, 237: 285-297. DOI:10.1016/j.envpol.2018.01.089 |
| [32] | Li Y M, Fu T M, Yu J Z, et al. Impacts of chemical degradation on the global budget of atmospheric levoglucosan and its use as a biomass burning tracer[J]. Environmental Science & Technology, 2021, 55(8): 5525-5536. |
| [33] |
薛国艳, 王格慧, 吴灿, 等. 长三角背景点夏季大气PM2.5中正构烷烃和多环芳烃的污染特征和来源解析[J]. 环境科学, 2020, 41(2): 554-563. Xue G Y, Wang G H, Wu C, et al. Pollution characteristics and source apportionment of n-alkanes and PAHs in summertime PM2.5 at background site of Yangtze River Delta[J]. Environmental Science, 2020, 41(2): 554-563. DOI:10.3969/j.issn.1000-6923.2020.02.011 |
| [34] | Xie Q R, Su S H, Chen S, et al. Molecular characterization of size-segregated organic aerosols in the urban boundary layer in wintertime Beijing by FT-ICR MS[J]. Faraday Discussions, 2021, 226: 457-478. DOI:10.1039/D0FD00084A |
| [35] |
姚媛, 贺欣, 朱君. 云贵高原昆明站点不同气溶胶污染个例下气溶胶特征对比研究[J]. 环境科学学报, 2020, 40(6): 1976-1986. Yao Y, He X, Zhu J. Contrastive aerosol characteristics during different aerosol pollution cases in Kunming site of Yunnan-Guizhou Plateau[J]. Acta Scientiae Circumstantiae, 2020, 40(6): 1976-1986. |
| [36] | Sun N, Li X D, Ji Y D, et al. Sources of PM2.5-associated PAHs and n-alkanes in Changzhou China[J]. Atmosphere, 2021, 12(9). DOI:10.3390/atmos12091127 |
| [37] | Kang M, Kim K, Choi N, et al. Recent occurrence of PAHs and n-alkanes in PM2.5 in Seoul, Korea and characteristics of their sources and toxicity[J]. International Journal of Environmental Research and Public Health, 2020, 17(4). DOI:10.3390/ijerph17041397 |
| [38] | Liang L L, Engling G, Cheng Y, et al. Biomass burning impacts on ambient aerosol at a background site in East China: insights from a yearlong study[J]. Atmospheric Research, 2020, 231. DOI:10.1016/j.atmosres.2019.104660 |
| [39] |
付晓燕. 我国环境空气质量标准发展及现状[J]. 环境与可持续发展, 2014, 39(3): 41-43. Fu X Y. Development and current situation of ambient air quality standard in China[J]. Environment and Sustainable Development, 2014, 39(3): 41-43. |
| [40] | Xu J S, Srivastava D, Wu X F, et al. An evaluation of source apportionment of fine OC and PM2.5 by multiple methods: APHH-Beijing campaigns as a case study[J]. Faraday Discussions, 2021, 226: 290-313. DOI:10.1039/D0FD00095G |
| [41] | Wu X F, Chen C R, Vu T V, et al. Source apportionment of fine organic carbon (OC) using receptor modelling at a rural site of Beijing: insight into seasonal and diurnal variation of source contributions[J]. Environmental Pollution, 2020, 266. DOI:10.1016/j.envpol.2020.115078 |
| [42] | Feng J L, Hu J C, Xu B H, et al. Characteristics and seasonal variation of organic matter in PM2.5 at a regional background site of the Yangtze River Delta region, China[J]. Atmospheric Environment, 2015, 123: 288-297. DOI:10.1016/j.atmosenv.2015.08.019 |
| [43] | Chen P F, Kang S C, Li C L, et al. Source apportionment and risk assessment of atmospheric polycyclic aromatic hydrocarbons in Lhasa, Tibet, China[J]. Aerosol and Air Quality Research, 2018, 18(5): 1294-1304. DOI:10.4209/aaqr.2017.12.0603 |
| [44] | Chen P F, Li C L, Kang S C, et al. Characteristics of particulate-phase polycyclic aromatic hydrocarbons (PAHs) in the atmosphere over the central himalayas[J]. Aerosol and Air Quality Research, 2017, 17(12): 2942-2954. DOI:10.4209/aaqr.2016.09.0385 |
| [45] | Kalita G, Kunchala R K, Fadnavis S, et al. Long term variability of carbonaceous aerosols over Southeast Asia via reanalysis: association with changes in vegetation cover and biomass burning[J]. Atmospheric Research, 2020, 245(4). DOI:10.1016/j.atmosres.2020.105064 |
| [46] | Florou K, Papanastasiou D K, Pikridas M, et al. The contribution of wood burning and other pollution sources to wintertime organic aerosol levels in two Greek cities[J]. Atmospheric Chemistry and Physics, 2017, 17(4): 3145-3163. DOI:10.5194/acp-17-3145-2017 |
| [47] | Liang L L, Engling G, Du Z Y, et al. Seasonal variations and source estimation of saccharides in atmospheric particulate matter in Beijing, China[J]. Chemosphere, 2016, 150: 365-377. DOI:10.1016/j.chemosphere.2016.02.002 |
| [48] | Tian Y Z, Liu X, Huo R Q, et al. Organic compound source profiles of PM2.5 from traffic emissions, coal combustion, industrial processes and dust[J]. Chemosphere, 2021, 278. DOI:10.1016/j.chemosphere.2021.130429 |
| [49] | Ambade B, Sankar T K, Kumar A, et al. Characterization of PAHs and n-alkanes in atmospheric aerosol of jamshedpur City, India[J]. Journal of Hazardous, Toxic, and Radioactive Waste, 2020, 24(2). DOI:10.1061/(ASCE)HZ.2153-5515.0000490 |
| [50] | Wang D X, Kang X, Gu Y, et al. Electronic tuning of Ni by Mo species for highly efficient hydroisomerization of n -alkanes comparable to Pt-based catalysts[J]. ACS Catalysis, 2020, 10(18): 10449-10458. DOI:10.1021/acscatal.0c01159 |
| [51] | Zhu C S, Li L J, Huang H, et al. n-alkanes and PAHs in the southeastern Tibetan Plateau: characteristics and correlations with brown carbon light absorption[J]. Journal of Geophysical Research: Atmospheres, 2020, 125(19). DOI:10.1029/2020JD032666 |
| [52] |
吴瑕, 曹芳, 翟晓瑶, 等. 长春秋季细颗粒物中有机气溶胶组成特征及来源[J]. 环境科学, 2019, 40(8): 3438-3446. Wu X, Cao F, Zhai X Y, et al. Molecular composition and source apportionment of fine organic aerosols in autumn in Changchun[J]. Environmental Science, 2019, 40(8): 3438-3446. |
| [53] | Li J J, Li J, Wang G H, et al. Effects of atmospheric aging processes on in vitro induced oxidative stress and chemical composition of biomass burning aerosols[J]. Journal of Hazardous Materials, 2020, 401. DOI:10.1016/j.jhazmat.2020.123750 |
| [54] |
张玉洽, 杨迎春, 李杰, 等. 东南亚生物质燃烧对我国春季PM2.5质量浓度影响的数值模拟[J]. 环境科学研究, 2016, 29(7): 952-962. Zhang Y Q, Yang Y C, Li J, et al. Modeling the impacts of biomass burning in Southeast Asia on PM2.5 over China in spring[J]. Research of Environmental Sciences, 2016, 29(7): 952-962. |