 2021, Vol. 42


近年来, 随着我国颗粒物浓度的持续下降, 环境受体中臭氧(O3)浓度不断凸显[1, 2], 已经成为影响我国空气质量的重要污染物之一[3]. 有研究表明O3污染会对人类健康[4, 5]、植物生长[6, 7]和气候变化[8, 9]造成不利影响. 环境空气中挥发性有机物(volatile organic compounds, VOCs)是臭氧(O3)生成的关键前体物[10], 有研究表明中国大部分城市的臭氧污染均属于VOCs控制区[11~13]. 因此, 明确环境受体中VOCs的化学特征及其来源对有效控制臭氧污染具有重要作用.
目前, 国内外关于VOCs的研究主要是集中在VOC物种的特征与来源解析[14~16]、健康风险评估[17~19]和VOCs在二次有机气溶胶和臭氧产生中的作用[20~22]等方面. 例如徐晨曦等[14]、古颖纲等[16]和陈浩等[20]分别针对成都市区、广州市区和西安市郊进行了来源解析研究, 发现了机动车排放和工业源是市区和郊区VOCs共同的主要贡献源. Li等[21]的研究在北京利用收集的VOCs数据与多个模型相结合, 调查了VOCs在二次有机气溶胶(SOA)和O3生产中的作用, 发现烷烃和芳香烃是OFP的主要贡献源类. 随着近年来臭氧污染事件的频繁发生[23], 精细化地进行VOCs来源解析研究已经成为臭氧污染管控的重要需求. 高时间分辨率的VOCs在线监测仪器能够快速获得VOCs物种数据[24, 25], 对于精细地进行VOCs的化学特征及来源解析的研究具有重要的作用. 张栋等[19]、徐晨曦等[26]和Liu等[27]的研究利用在线获得的小时分辨率的VOCs监测数据分析其反应活性及利用正定矩阵因子分解模型解析其来源, 发现了机动车尾气和燃烧源是主要贡献源类. 尽管如此, 目前针对不同臭氧污染形势(臭氧污染事件和非臭氧污染时期)进行精细化的VOCs来源解析研究仍然十分有限, 不利于环境受体中VOCs及臭氧的精细管控.
天津市是京津冀城市群中重要的工业和港口城市, 其环境中臭氧的污染不容乐观[28]. 余益军等[29]的研究发现天津市2013~2018年臭氧最大日8 h滑动平均的年均升高速率达到6.52 μg·m-3, 其中污染物排放对升高速率贡献了91.7%. 近年来, 有学者在天津市陆续开展了环境受体中VOCs来源解析研究[30~34], Liu等[30]的研究发现汽车尾气(23.1%)和工业排放(19.9%)是全年VOCs主要贡献源类;高璟赟等[31]的研究发现天津市区春夏季和秋冬季主要VOCs贡献源类分别是机动车排放和液化石油气/天然气;Gu等[32]和罗瑞雪等[33]的研究发现石化工业和溶剂使用均是供暖季和夏季的主要VOCs贡献源类;王文美等[34]的研究对不同O3浓度级别VOCs污染特征及来源分析研究发现, 随着O3浓度级别上升, 机动车排放源、液化石油气和汽油挥发源、石化工业排放源等贡献逐渐增加. 尽管如此, 目前很少有研究针对天津市臭氧污染事件和非臭氧污染时期进行时间精细化的VOCs及O3生成潜势的来源解析研究. 因此, 本文利用高时间分辨率的VOCs在线监测数据, 针对天津市郊2019年夏季臭氧污染事件以及非臭氧污染时期的VOCs及其O3生成潜势进行精细化的来源解析研究, 以期为天津市郊区臭氧污染的有效防控提供一定的基础数据支撑.
1 材料与方法 1.1 观测点位与采样时间监测点位于天津市津南区南开大学大气环境综合观测站(38.99°N, 117.34°E, 图 1), 采样器距离地面大约4~5 m, 周围无明显遮挡物, 站点处于典型的城郊结合区域. 根据空气质量监测数据(图 2), 2019年天津市臭氧体积分数在夏季处于较高水平[23], 且臭氧污染事件在夏季发生频次最高, 故本研究选择夏季(6~8月)作为典型时段进行分析. 本研究的观测时段为2019年6月1日~2019年8月31日, 主要盛行东南风(图 3).

|
图 1 监测点位示意 Fig. 1 Map of monitoring site |

|
图 2 天津市不同季节臭氧体积分数和臭氧污染事件发生频次 Fig. 2 Ozone volume fraction and frequency of ozone pollution events in different seasons in Tianjin |

|
图 3 夏季不同时期风玫瑰图 Fig. 3 Wind roses in different periods of summer |
本研究采用荷兰Syntech公司生产的GC955系列在线气相色谱仪监测设备, 系统包括GC955-611和GC955-811两台具备单独样品和色谱柱系统的设备, 分别测量高碳(C6~C10)和低碳(C2~C5)挥发性有机化合物. GC955-611将空气样品在常温的Tenax GR上进行预浓缩, 然后将目标化合物在230℃下解吸, 引入气提塔, 然后进入分析柱进行分离, 然后使用PID进行检测. GC955-811将空气样品在-5℃的温度下预先浓缩在Carbosieves SIII上. 然后将富集的化合物通过加热(270℃)进行热脱附, 并吹入分离柱中. 然后通过PID和FID检测目标化合物. 监测期间, 每周使用单点校准, 重复进样5次对仪器进行校准和检定, 通过保留时间定性分析, 峰面积定量分析, 并利用有固定基点的线性回归拟合校准曲线, 相关系数在0.995~0.999之间. 标气由美国光谱特种气体公司(Spectra Gases Inc.)提供, 含有54种(按官能团分为27种烷烃、10种烯烃、乙炔和16种芳香烃)体积分数为1×10⁻⁶的气体, 以氮气为平衡气经DIM200稀释至体积分数5×10⁻⁹后用以仪器校准, 其方法检测限(MDL)为(0.01~0.599)×10-9. 采用美国自动精密工程公司(Automated Precision Inc.)生产的T400分析仪观测O3, 气象数据(太阳总辐射、相对湿度、风速、风向、气温)采用德国LUFF生产的WS600-UMB微型气象站监测, 监测期间的气象参数见表 1所示.
|
|
表 1 监测期间气象参数 Table 1 Meteorological parameters during monitoring period |
1.3 VOCs的臭氧生成潜势
VOCs的臭氧生成潜势(ozone formation potential, OFP)用来描述VOCs的化学反应活性, 本研究采用Carter[36]提出的最大增量反应活性(maximum incremental reactivity, MIR)法进行分析, 计算公式为:
|
(1) |
|
(2) |
式中, OFPi为VOCs物种i的OFP;MIRi为VOCs物种i的MIR系数, 采用文献的MIR数值, 表示VOCs物种i生成O3的潜力. OFP为全部VOCs物种的O3生成潜势.
1.4 正定矩阵因子分解法(PMF)本研究使用目前已被广泛应用于颗粒物和VOCs等污染物源解析研究的EPA PMF v5.0模型进行计算.
|
(3) |
式中, Xij代表第i个样本中第j个物种的浓度, Gki代表第k个来源对第i个样本的贡献, Fkj代表第k个来源中第j个物种的来源概况, Eij代表第i个样本中第j个物种的残差, p表示来源数量.
为评估解决方案的稳定性, 可以使用对象函数Q来检查每种物质的分布, 并通过最小化目标函数Q值推导出因子贡献和概况, 公式为:
|
(4) |
式中, μij代表第i个样本中第j个物种的不确定性, 其可用于加权包括缺失数据、检测限等在内的观察值;n和m分别表示样本数量和物种数量.
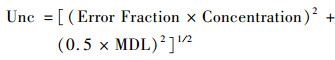
本研究中将缺失值用给定物种的中位数浓度代替, 其不确定性为4倍的中位数. 将小于检测限(MDL)的数据用检出限的一半代替, 其不确定性设置为MDL的5/6;大于检测限的值其不确定度的计算公式为:
|
(5) |
式中, Error Fraction为误差系数, Concentration为污染物浓度, 误差系数设置区间为10% ~50%. 参考文献[37]不确定性系数的确定标准(包括样品采集和分析测量的误差等), 本研究利用VOC物种标气数值(真实值)与标气通入在线监测仪器后实测VOC物种数值的相对误差设定不同VOC物种的误差系数.
1.5 臭氧生成潜势来源解析第一步, 利用PMF计算的各因子贡献浓度乘以各因子谱中各VOC物种含量, 获得不同因子对于VOC物种的贡献浓度.
第二步, 根据因子中VOCs物种贡献浓度, 利用1.3节中臭氧生成潜势公式, 计算得到该因子中VOC物种的臭氧生成潜势, 所有物种臭氧生成潜势加和则代表该因子的臭氧生成潜势. 通过各因子臭氧生成潜势的加和占到环境受体TVOC总臭氧生成潜势的比例(至少大于60%), 评估计算因子臭氧生成潜势的代表性.
第三步, 基于第二步的结果, 获得臭氧污染事件和非臭氧污染时期中臭氧生成潜势的来源解析结果.
2 结果与讨论 2.1 臭氧污染事件和非臭氧污染时期化学组成特征天津市郊夏季环境受体中O3的平均体积分数为(38.41±24.23)×10-9, VOCs的平均体积分数为(24.42±19.94)×10-9. 夏季VOCs中烷烃的体积分数最高(13.21×10⁻⁹), 其次为芳香烃(5.29×10⁻⁹)、烯烃(5.04×10⁻⁹)和乙炔(0.88×10⁻⁹);分别占到VOCs体积分数的54.09%、21.66%、20.63%和3.62%. 相比于罗瑞雪等[33]于2018年夏季的研究, 本研究中VOCs平均体积分数较高, 且芳香烃和烷烃占比增加, 烯烃占比明显降低. 与同期王文美等[34]在天津市区开展的研究相比, 天津市郊VOCs平均体积分数明显高于天津市区. 与其他城市夏季相比, 天津市郊VOCs水平与上海市[38](23.8×10-9)相差不大, 低于南京市[39](52.05×10-9)和济南市[40](29.39×10-9), 高于北京市[41](11.82×10-9). 烷烃中甲基环戊烷物种和乙烷物种的体积分数最高, 分别达到2.64×10⁻⁹和2.48×10⁻⁹, 显著高于其它VOC物种;这可能与夏季石化工业源和天然气(NG)源的影响密切相关[42, 43]. 监测期间, 甲苯/苯(T/B)为1.59, 接近机动车排放标识2[44];异戊烷/正戊烷(i/n)为1.75, 液化石油气(LPG)使用的i/n比为1.5~3.0[45], 车辆排放的i/n比为2.2~3.8[46], 因此天津郊区夏季可能主要受机动车和液化石油气共同影响.
本研究筛选出夏季12次臭氧污染事件见表 2和图 4所示. 可见, 臭氧污染事件发生在7月的次数最多(7次), 8月最少(1次). 臭氧污染事件和非臭氧污染时期体积分数排名前10的VOCs物种见图 5. 臭氧污染事件中的VOCs平均体积分数为27.72×10⁻⁹, 较非臭氧污染时期增加15.69%;其中烷烃、烯烃、芳香烃和乙炔的体积分数分别为16.81×10⁻⁹、5.97×10⁻⁹、3.46×10⁻⁹和1.49×10⁻⁹, 分别占到VOC的60.63%、21.54%、12.47%和5.36%. 相比于非臭氧污染时期烷烃的体积分数和含量显著增加, 达到32.27%;其中丙烷、异丁烷和甲基环戊烷体积分数增加最为明显, 分别达到87.04%、118.76%和29.95%. 研究表明丙烷和异丁烷是液化石油气(LPG)的主要成分[47], 而甲基环戊烷是炼油行业的主要排放物[42], 因此, 天津市郊夏季臭氧污染事件中VOCs体积分数可能受到液化石油气和石化工业源排放影响较为明显. 相比之下, 芳香烃体积分数下降37.66%, 其中苯乙烯和邻-二甲苯物种的下降最为明显, 是焦化行业[48]和化工企业溶剂使用[33]的主要排放物, 可能说明其相应源的影响有所降低或者臭氧污染事件中芳香烃的化学转化消耗较为明显.
|
|
表 2 监测期间12次臭氧污染事件 Table 2 Twelve ozone pollution events during the monitoring period |

|
图 4 监测期间12件臭氧污染事件中O3及TVOCs体积分数时间序列 Fig. 4 Time series of O3 concentration in 12 ozone pollution events during the monitoring period |

|
图 5 非臭氧污染时期和臭氧污染事件体积分数最高的前10的VOC物种 Fig. 5 Top ten VOC species with the highest volume fractions during the non-ozone pollution period and ozone pollution events |
天津市郊夏季环境受体中总VOCs(TVOCs)的臭氧生成潜势(OFP)为87.92×10⁻⁹, 其中烯烃的OFP最高, 达到51.24×10⁻⁹, 对于TVOCs的OFP的贡献达到58.28%. 烯烃中丙烯、反-2-丁烯和异戊二烯的OFP明显高于其它VOC物种, 其OFP分别为18.01×10⁻⁹、9.78×10⁻⁹和8.21×10⁻⁹, 可能说明夏季石化工业和植物排放对于O3生成的贡献较为明显[34]. 芳香烃、烷烃和乙炔的OFP值分别为20.05×10⁻⁹、15.81×10⁻⁹和0.82×10⁻⁹, 对TVOCs臭氧生成潜势的贡献分别为22.80%、17.98%和0.93%. 同期天津市区不同VOCs类别OFP的贡献占比也表现为:烯烃>芳香烃>烷烃>乙炔[34], 与本研究具有一致性.
臭氧污染事件和非臭氧污染时期OFP贡献排名前10的物种见图 6. 臭氧污染事件中OFP为102.68×10⁻⁹, 较非臭氧污染时期增加19.59%, 其中烯烃的臭氧生成潜势最高, 达到57.49%, 这是因为其所含碳双键化学反应活性强[43]. 与夏季一致的是, 烯烃中丙烯、反式-2-丁烯和异戊二烯的臭氧生成潜势显著高于其它烯烃物种, 分别达到22.86×10⁻⁹、15.95×10⁻⁹和8.52×10⁻⁹, 但不同在于其臭氧生成潜势较夏季分别增长26.93%、63.09%和3.78%, 说明臭氧污染事件中石化工业和植物排放不可忽视的作用[34, 49]. 相比于臭氧污染事件, 非臭氧污染时期的OFP为85.86×10⁻⁹, 其中主要臭氧生成潜势贡献物种与臭氧污染事件差距不大.

|
图 6 非臭氧污染时期和臭氧污染事件OFP最高的前10的VOCs物种 Fig. 6 Top ten VOCs species with the highest OFP during the non-ozone pollution period and ozone pollution events |
本研究采用美国EPA PMF v5.0模型进行天津市郊夏季环境受体中VOCs的来源解析研究. 参照相关报道[31, 33, 38], 本研究从监测所得的54种VOC物种中筛选34种纳入PMF模型进行计算, 综合考虑以下具体选择标准:①选取具有较强来源指示性的物种;②选取具有较高体积分数的物种;③选取大气光化学反应活性相对较弱的物种; ④选取具有相对较高臭氧生成潜势的物种. 根据实际排放源的调研以及PMF模型的多次运算调整, 最终选取6个因子作为输入因子数进行模型运算. 本研究计算结果的Qtrue/Qexp为0.95, 同时计算的VOC体积分数和实测的相关性(R2)达到0.74, 说明结果是合理的.
PMF模型识别出的不同因子对不同VOC物种的贡献率如图 7所示. 因子1中对于丙烷、正/异-丁烷和正/异/环-戊烷等低碳烷烃和苯系物贡献率较高, 其中丙烷和正/异-丁烷是LPG的主要组成部分[47], 甲苯和烷基苯等化合物及其衍生物被用作汽油的添加剂, 提高燃料的辛烷值和抗爆性能, 也是优良的汽车尾气示踪剂[50, 51], 因此判定因子1为液化石油气及汽油车尾气. 因子2贡献率较高的物种有乙烷、乙烯和少量苯系物, 其中乙烷是天然气(NG)的重要组分[43], 乙烯是不完全燃烧的示踪剂[33], 因此确定其为天然气及燃烧.正己烷、正庚烷、正癸烷和间/对-二甲苯对于因子3的贡献率较高, 其中正己烷和正庚烷是常见的胶合物成分, 用于制鞋和皮革制品, 是溶剂使用标识物[52], 并且二甲苯也是制造行业常用的各种溶剂的主要成分[53, 54], 因此因子3可认为是溶剂使用. 因子4中异戊二烯贡献率高, 其中异戊二烯是植物排放的标识性物种[49], 且该因子贡献的日变化随光照变化, 因此因子4被识别为植物排放. 因子5中正/异-戊烷、甲基环戊烷、3-甲基戊烷、2, 3-二甲基戊烷、环己烷、反-2-戊烯和苯乙烯的贡献率较高, 其中正/异-戊烷、3-甲基戊烷和反-2-戊烯均是汽油挥发的示踪剂[55], 甲基环戊烷和苯乙烯分别是炼油和焦化行业的主要排放物[42, 48], 因子5判定为石化工业及汽油挥发. 因子6中C7~C10高碳烷烃、乙炔贡献率较大且含有少量低碳烷烃和芳香烃, 其中乙炔主要从内燃机中排放[56], 较重的正烷烃(正壬烷和正癸烷)是柴油废气的特征物[57, 58], 且该因子贡献的日变化呈现典型的早晚高峰特征, 因此判定因子6为柴油车尾气.

|
①乙烷, ②丙烷, ③正丁烷, ④异丁烷, ⑤正戊烷, ⑥异戊烷, ⑦环戊烷, ⑧甲基环戊烷, ⑨2-甲基戊烷, ⑩3-甲基戊烷, ⑪ 2, 3-二甲基戊烷, ⑫ 2, 4-二甲基戊烷, ⑬正己烷, ⑭环己烷, ⑮甲基环己烷, ⑯正庚烷, ⑰ 2-甲基庚烷, ⑱正辛烷, ⑲正壬烷, ⑳正癸烷, ㉑乙烯, ㉒丙烯, ㉓ 1-丁烯, ㉔反-2-丁烯, ㉕反-2-戊烯, ㉖ 1-己烯, ㉗异戊二烯, ㉘乙炔, ㉙苯, ㉚甲苯, ㉛邻-二甲苯, ㉜间/对-二甲苯, ㉝乙苯, ㉞苯乙烯 图 7 天津市夏季PMF计算的VOCs因子谱 Fig. 7 VOCs factor profiles calculated by PMF in Tianjin in summer |
不同时期各源类对环境受体中VOCs贡献的相对比例如图 8所示. 臭氧污染事件中各源类对VOCs的贡献率由高到低依次为石化工业及汽油挥发(29.44%)、柴油车尾气(23.52%)、液化石油气及汽油车尾气(22.00%)、天然气及燃烧(13.41%)、溶剂使用(6.14%)和植物排放(5.49%). 非臭氧污染时期石化工业及汽油挥发仍然是大气中VOCs的最主要来源, 臭氧污染事件中液化石油气及汽油车尾气和柴油车尾气的贡献率分别较非臭氧污染时期增长了4.84%和5.29%. 天津市臭氧事件中和非臭氧污染时期主要盛行东南风(图 3), 石化工业及汽油挥发的贡献占比之所以明显高于其它源类, 可能与监测点位东南方向的天津市滨海石化工业聚集区的影响密切相关.

|
图 8 天津市夏季、非臭氧污染时期和臭氧污染事件VOCs源解析结果 Fig. 8 Source apportionment results of ambient VOCs in the summer, the non-ozone pollution period, and ozone pollution events in Tianjin |
天津市郊非臭氧污染时期和臭氧污染事件中不同VOC源类贡献率的日变化如图 9所示. 可以看出, 石化工业及汽油挥发和植物排放在08:00开始上升, 11:00达到最高, 这可能与期间太阳辐射增强和大气温度不断上升, 导致汽油挥发量和植物排放量显著增加有关[33]. 液化石油气及汽油车尾气与柴油车尾气的贡献均具有明显的早晚高峰特征, 且柴油车尾气的贡献在晚高峰后持续上升, 并在夜间(00:00~06:00)保持较高的贡献水平, 可能与监测点位临近高速(图 1)、大型载货柴油车穿行流量较大有关[59], 这也可能是导致柴油车尾气夜间贡献明显高于液化石油气及汽油车尾气的重要原因.

|
(a)非臭氧污染时期, (b) 臭氧污染事件 图 9 天津市非臭氧污染时期和臭氧污染事件VOCs源贡献率的日变化 Fig. 9 Diurnal variation in VOCs contribution ratio in the non-ozone pollution period and ozone pollution events in Tianjin |
不同臭氧体积分数级别下各源类对VOCs的贡献率如图 10所示. 天津市郊夏季随着臭氧污染级别的增加石油化工及汽油挥发的贡献率明显增加, 天然气及燃烧的贡献率变化不大, 而液化石油气及汽油车尾气和溶剂使用的贡献率有所下降. 石化工业及汽油挥发的贡献率在臭氧污染事件的上升阶段从24.29%增加至29.48%, 而在臭氧污染事件的消散阶段则从49.89%下降至28.50%. 因此, 石化工业及汽油挥发可能是臭氧污染事件发生过程中的主要VOCs贡献源类. 与石化工业及汽油挥发相反的是, 臭氧污染事件中液化石油气及汽油车尾气的贡献率在臭氧污染事件的上升阶段从23.13%下降至16.57%, 而在臭氧污染事件的消散阶段从5.19%上升至26.53%.

|
依据文献[36], 将监测时段内O3小时平均体积分数按照不同级别进行统计: A级(O3 < 75×10-9)、B级(75×10-9 < O3 < 93×10-9)和C级(O3 > 93×10-9), 下同 图 10 天津市夏季、非臭氧污染时期和臭氧污染事件中不同臭氧体积分数级别下VOCs源贡献 Fig. 10 Source contributions of ambient VOCs at different ozone volume fraction levels in the summer, the non-ozone pollution period, and ozone pollution events in Tianjin |
不同VOCs源类对于OFP的贡献率如图 11所示. 本研究计算的不同VOCs源类OFP之和占到环境受体TVOCs总OFP的62%, 说明计算的各源类臭氧生成潜势基本能够表征该源实际的影响。臭氧污染事件中柴油车尾气(36.64%)、石化工业及汽油挥发(31.01%)和植物排放(15.27%)对于OFP的贡献最高, 其次为天然气及燃烧(8.38%)、液化石油气及汽油车尾气(7.91%)和溶剂使用(0.78%). 值得注意的是, 仅占VOCs来源贡献5.49%的植物排放贡献了15.27%的OFP, 而占22.00%的液化石油气及汽油车尾气却仅贡献7.91%的OFP. 与非臭氧污染时期相比, 液化石油气及汽油车尾气和柴油车尾气的贡献率分别增长了1.74%和8.27%, 而天然气及燃烧、溶剂使用、植物排放和石化工业及汽油挥发的贡献率分别下降了2.61%、0.30%、5.48%和1.62%.

|
图 11 天津市夏季、非臭氧污染时期和臭氧污染事件中不同VOC源类对臭氧生成潜势的贡献率 Fig. 11 Source contribution ratio of ambient VOC to ozone formation potential in the summer, the non-ozone pollution period, and ozone pollution events in Tianjin |
不同臭氧体积分数级别下VOCs源类对于OFP的贡献如图 12所示. 随着臭氧污染级别的不断增加, 石化工业及汽油挥发的贡献率基本上表现出增加的趋势, 而植物排放在重度臭氧污染(C级)时期的贡献率显著降低. 植物排放是夏季和非臭氧污染时期OFP贡献最大的源类, 并且其OFP贡献在B级时为最大;可能是因为O3体积分数上升阶段往往伴随着太阳辐射增加(图 4), 因此植物排放的高活性VOC物种异戊二烯排放量增加, 对该时期OFP贡献及占比增大. 除此之外, 石化工业及汽油挥发是臭氧污染事件中OFP贡献较大的源类, 同时该源类的贡献率在臭氧污染事件的上升阶段从27.69%增长至32.25%后又下降至26.78%, 而在臭氧污染事件的消散阶段从49.52%下降至30.17%;因此石化工业及汽油挥发可能是天津市郊臭氧污染事件中的关键人为源类.

|
图 12 天津市夏季、非臭氧污染时期和臭氧污染事件不同臭氧体积分数级别下VOC源类的臭氧生成潜势贡献 Fig. 12 Contributions of VOC sources to ozone formation potential in Tianjin in the summer, the non-ozone pollution period, and ozone pollution events with different ozone volume fraction levels |
(1) 天津市郊夏季VOCs的平均体积分数为(24.42±19.94)×10-9. 臭氧污染事件的VOCs平均体积分数为27.72×10⁻⁹, 较非臭氧污染事件增加15.69%. 烷烃体积分数较非臭氧事件增加32.27%, 而芳香烃体积分数较非臭氧污染事件下降37.66%.
(2) 臭氧污染事件和非臭氧污染时期中烯烃对OFP的贡献均最高. 臭氧污染事件中丙烯、反-2-丁烯、反-2-戊烯和甲基环戊烷的OFP较非臭氧污染时期增长较多, 增长率基本在30%以上.
(3) 夏季VOCs的主要贡献源类是石化工业及汽油挥发(30.76%)、柴油车尾气(19.07%)和液化石油气及汽油车尾气(17.93%). 石化工业及汽油挥发和植物排放贡献受太阳辐射和温度影响明显, 液化石油气及汽油车尾气和柴油车尾气均具有明显的早晚高峰特征.
(4) 臭氧污染事件中对VOCs贡献最高的为石化工业及汽油挥发(29.44%)、柴油车尾气(23.52%)和液化石油气及汽油车尾气(22.00%). 臭氧污染事件中液化石油气及汽油车尾气和柴油车尾气贡献率分别较非臭氧污染时期增长了4.84%和5.29%.
(5) 天津市郊夏季OFP的主要贡献源类是石化工业及汽油挥发(32.37%)、柴油车尾气(29.69%)和植物排放(19.88%). 臭氧污染事件中柴油车尾气(36.64%)、石化工业及汽油挥发(31.01%)和植物排放(15.27%)仍是对于OFP贡献最高的源类, 较非臭氧污染时期贡献率分别增长8.27%、下降1.62%和5.48%.
| [1] | Lyu X P, Wang N, Guo H, et al. Causes of a continuous summertime O3 pollution event in Jinan, a central city in the North China Plain[J]. Atmospheric Chemistry and Physics, 2019, 19(5): 3025-3042. DOI:10.5194/acp-19-3025-2019 |
| [2] | Zhu J X, Cheng H R, Peng J, et al. O3 photochemistry on O3 episode days and non-O3 episode days in Wuhan, Central China[J]. Atmospheric Environment, 2020, 223. DOI:10.1016/j.atmosenv.2019.117236 |
| [3] |
李红, 彭良, 毕方, 等. 我国PM2.5与臭氧污染协同控制策略研究[J]. 环境科学研究, 2019, 32(10): 1763-1778. Li H, Peng L, Bi F, et al. Strategy of coordinated control of PM2.5 and ozone in China[J]. Research of Environmental Sciences, 2019, 32(10): 1763-1778. |
| [4] | Anenberg S C, Miller J, Minjares R, et al. Impacts and mitigation of excess diesel-related NOx emissions in 11 major vehicle markets[J]. Nature, 2017, 545(7655): 467-471. DOI:10.1038/nature22086 |
| [5] | Lim C C, Hayes R B, Ahn J, et al. Long-term exposure to ozone and cause-specific mortality risk in the United States[J]. American Journal of Respiratory and Critical Care Medicine, 2019, 200(8): 1022-1031. DOI:10.1164/rccm.201806-1161OC |
| [6] | Feng Z Z, Kobayashi K, Li P, et al. Impacts of current ozone pollution on wheat yield in China as estimated with observed ozone, meteorology and day of flowering[J]. Atmospheric Environment, 2019, 217. DOI:10.1016/j.atmosenv.2019.116945 |
| [7] | Lapina K, Henze D K, Milford J B, et al. Impacts of foreign, domestic, and state-level emissions on ozone-induced vegetation loss in the United States[J]. Environmental Science & Technology, 2016, 50(2): 806-813. |
| [8] | Unger N, Shindell D T, Koch D M, et al. Cross influences of ozone and sulfate precursor emissions changes on air quality and climate[J]. Proceedings of the National Academy of Sciences of the United States of America, 2006, 103(12): 4377-4380. DOI:10.1073/pnas.0508769103 |
| [9] | Unger N, Bond T C, Wang J S, et al. Attribution of climate forcing to economic sectors[J]. Proceedings of the National Academy of Sciences of the United States of America, 2010, 107(8): 3382-3387. DOI:10.1073/pnas.0906548107 |
| [10] | Alghamdi M A, Khoder M, Abdelmaksoud A S, et al. Seasonal and diurnal variations of BTEX and their potential for ozone formation in the urban background atmosphere of the coastal city Jeddah, Saudi Arabia[J]. Air Quality, Atmosphere & Health, 2014, 7(4): 467-480. |
| [11] |
庄立跃. 中国三大城市群近地面臭氧污染特征及其敏感性研究[D]. 广州: 华南理工大学, 2019. 47-61. Zhuang L Y. Ground level ozone concentration characteristics and formation sensitivity in China's Three Agglomerations[D]. Guangzhou: South China University of Technology, 2019. 47-61. http://cdmd.cnki.com.cn/article/cdmd-10561-1020616890.htm |
| [12] | Li K W, Chen L H, Ying F, et al. Meteorological and chemical impacts on ozone formation: a case study in Hangzhou, China[J]. Atmospheric Research, 2017, 196: 40-52. DOI:10.1016/j.atmosres.2017.06.003 |
| [13] | Feng R, Wang Q, Huang C C, et al. Ethylene, xylene, toluene and hexane are major contributors of atmospheric ozone in Hangzhou, China, prior to the 2022 Asian Games[J]. Environmental Chemistry Letters, 2019, 17(2): 1151-1160. DOI:10.1007/s10311-018-00846-w |
| [14] |
徐晨曦, 陈军辉, 姜涛, 等. 成都市区夏季大气挥发性有机物污染特征及来源解析[J]. 环境科学, 2020, 41(12): 5316-5324. Xu C X, Chen J H, Jiang T, et al. Characteristics and sources of atmospheric volatile organic compounds pollution in summer in Chengdu[J]. Environmental Science, 2020, 41(12): 5316-5324. |
| [15] |
安俊琳, 朱彬, 王红磊, 等. 南京北郊大气VOCs变化特征及来源解析[J]. 环境科学, 2014, 35(12): 4454-4464. An J L, Zhu B, Wang H L, et al. Characteristics and source apportionment of volatile organic compounds (VOCs) in the northern suburb of Nanjing[J]. Environmental Science, 2014, 35(12): 4454-4464. |
| [16] |
古颖纲, 虞小芳, 杨闻达, 等. 广州市天河区2016年雨季挥发性有机物污染特征及来源解析[J]. 环境科学, 2018, 39(6): 2528-2537. Gu Y G, Yu X F, Yang W D, et al. Characteristics and source apportionment of volatile organic compounds in the rainy season of Guangzhou City[J]. Environmental Science, 2018, 39(6): 2528-2537. |
| [17] | Liang B, Yu X, Mi H P, et al. Health risk assessment and source apportionment of VOCs inside new vehicle cabins: a case study from Chongqing, China[J]. Atmospheric Pollution Research, 2019, 10(5): 1677-1684. DOI:10.1016/j.apr.2019.06.008 |
| [18] | Dai H X, Jing S G, Wang H L, et al. VOC characteristics and inhalation health risks in newly renovated residences in Shanghai, China[J]. Science of the Total Environment, 2017, 577: 73-83. DOI:10.1016/j.scitotenv.2016.10.071 |
| [19] |
张栋, 于世杰, 王楠, 等. 郑州市冬季VOCs污染特征、来源及健康风险评估[J]. 环境科学学报, 2020, 40(8): 2935-2943. Zhang D, Yu S J, Wang N, et al. Characteristics, sources and health risk assessment of ambient VOCs in winter of Zhengzhou[J]. Acta Scientiae Circumstantiae, 2020, 40(8): 2935-2943. |
| [20] |
陈浩, 曹磊, 高飞, 等. 西安市南郊夏季臭氧生成潜势与VOCs来源研究[J]. 环境科学与管理, 2021, 46(3): 48-52. Chen H, Cao L, Gao F, et al. Analysis of ozone generation potential and VOCs sources in southern suburb of Xi'an in summer[J]. Environmental Science and Management, 2021, 46(3): 48-52. DOI:10.3969/j.issn.1673-1212.2021.03.013 |
| [21] | Li Q Q, Su G J, Li C Q, et al. An investigation into the role of VOCs in SOA and ozone production in Beijing, China[J]. Science of the Total Environment, 2020, 720. DOI:10.1016/j.scitotenv.2020.137536 |
| [22] | Mozaffar A, Zhang Y L, Fan M Y, et al. Characteristics of summertime ambient VOCs and their contributions to O3 and SOA formation in a suburban area of Nanjing, China[J]. Atmospheric Research, 2020, 240. DOI:10.1016/j.atmosres.2020.104923 |
| [23] |
毛佳. 2013-2018华北地区O3区域污染特征及气象成因分析[D]. 南京: 南京信息工程大学, 2020. 21-48. Mao J. Exploring the regional pollution characteristics and meteorological formation mechanism of O3 in north China during 2013-2018[D]. Nanjing: Nanjing University of Information Science & Technology, 2020. 21-48. |
| [24] | Li Z Y, Ho K F, Yim S H L. Source apportionment of hourly-resolved ambient volatile organic compounds: influence of temporal resolution[J]. Science of the Total Environment, 2020, 725. DOI:10.1016/j.scitotenv.2020.138243 |
| [25] | Wang M, Zeng L M, Lu S H, et al. Development and validation of a cryogen-free automatic gas chromatograph system (GC-MS/FID) for online measurements of volatile organic compounds[J]. Analytical Methods, 2014, 6(23): 9424-9434. DOI:10.1039/C4AY01855A |
| [26] |
徐晨曦, 陈军辉, 韩丽, 等. 成都市2017年夏季大气VOCs污染特征、臭氧生成潜势及来源分析[J]. 环境科学研究, 2019, 32(4): 619-626. Xu C X, Chen J H, Han L, et al. Analyses of pollution characteristics, ozone formation potential and sources of VOCs atmosphere in Chengdu city in summer 2017[J]. Research of Environmental Sciences, 2019, 32(4): 619-626. |
| [27] | Liu Y F, Song M D, Liu X G, et al. Characterization and sources of volatile organic compounds (VOCs) and their related changes during ozone pollution days in 2016 in Beijing, China[J]. Environmental Pollution, 2020, 257. DOI:10.1016/j.envpol.2019.113599 |
| [28] | 中国环境监测总站. 空气质量报告[EB/OL]. http://www.cnemc.cn/jcbg/kqzlzkbg, 2020-09-22. |
| [29] |
余益军, 孟晓艳, 王振, 等. 京津冀地区城市臭氧污染趋势及原因探讨[J]. 环境科学, 2020, 41(1): 106-114. Yu Y J, Meng X Y, Wang Z, et al. Driving factors of the significant increase in surface ozone in the Beijing-Tianjin-Hebei region, China, during 2013-2018[J]. Environmental Science, 2020, 41(1): 106-114. |
| [30] | Liu B S, Liang D N, Yang J M, et al. Characterization and source apportionment of volatile organic compounds based on 1-year of observational data in Tianjin, China[J]. Environmental Pollution, 2016, 218: 757-769. DOI:10.1016/j.envpol.2016.07.072 |
| [31] |
高璟赟, 肖致美, 徐虹, 等. 2019年天津市挥发性有机物污染特征及来源[J]. 环境科学, 2021, 42(1): 55-64. Gao J Y, Xiao Z M, Xu H, et al. Characterization and source apportionment of atmospheric VOCs in Tianjin in 2019[J]. Environmental Science, 2021, 42(1): 55-64. |
| [32] | Gu Y, Liu B S, Li Y F, et al. Multi-scale volatile organic compound (VOC) source apportionment in Tianjin, China, using a receptor model coupled with 1-hr resolution data[J]. Environmental Pollution, 2020, 265. DOI:10.1016/j.envpol.2020.115023 |
| [33] |
罗瑞雪, 刘保双, 梁丹妮, 等. 天津市郊夏季的臭氧变化特征及其前体物VOCs的来源解析[J]. 环境科学, 2021, 42(1): 75-87. Luo R X, Liu B S, Liang D N, et al. Characteristics of ozone and source apportionment of the precursor VOCs in Tianjin suburbs in summer[J]. Environmental Science, 2021, 42(1): 75-87. |
| [34] |
王文美, 高璟赟, 肖致美, 等. 天津市夏季不同臭氧浓度级别VOCs特征及来源[J]. 环境科学, 2021, 42(8): 3585-3594. Wang W M, Gao J Y, Xiao Z M, et al. Characteristics and sources of VOCs at different ozone concentration levels in Tianjin[J]. Environmental Science, 2021, 42(8): 3585-3594. |
| [35] | GB 3095-2012, 环境空气质量标准[S]. |
| [36] | Carter W P L. Development of ozone reactivity scales for volatile organic compounds[J]. Air & Waste, 1994, 44(7): 881-899. |
| [37] | Norris G, Duvall R, Brown S, et al. EPA Positive Matrix Factorization (PMF) 5.0 fundamentals and user guide[M]. Washington: U. S. Environmental Protection Agency, 2014. |
| [38] | Liu Y H, Wang H L, Jing S G, et al. Characteristics and sources of volatile organic compounds (VOCs) in Shanghai during summer: implications of regional transport[J]. Atmospheric Environment, 2019, 215. DOI:10.1016/j.atmosenv.2019.116902 |
| [39] |
杨笑笑, 汤莉莉, 张运江, 等. 南京夏季市区VOCs特征及O3生成潜势的相关性分析[J]. 环境科学, 2016, 37(2): 443-451. Yang X X, Tang L L, Zhang Y J, et al. Correlation analysis between characteristics of VOCs and ozone formation potential in summer in Nanjing urban district[J]. Environmental Science, 2016, 37(2): 443-451. DOI:10.3969/j.issn.1000-6923.2016.02.021 |
| [40] |
高素莲, 闫学军, 刘光辉, 等. 济南市夏季臭氧重污染时段VOCs污染特征及来源解析[J]. 生态环境学报, 2020, 29(9): 1839-1846. Gao S L, Yan X J, Liu G H, et al. Characteristics and source apportionment of ambient VOCs in serious ozone pollution period of summer in Ji'nan[J]. Ecology and Environment Sciences, 2020, 29(9): 1839-1846. |
| [41] |
周莉. 北京及周边地区挥发性有机物的观测与分析[D]. 北京: 中国地质大学(北京), 2016. 25-29. Zhou L. Observation and analysis of volatile organic compounds in Beijing and its surrounding areas[D]. Beijing: China University of Geosciences (Beijing), 2016. 25-29. http://cdmd.cnki.com.cn/Article/CDMD-11415-1017006184.htm |
| [42] | Zhang H, Kong S F, Xing X L, et al. Monitoring of volatile organic compounds (VOCs) from an oil and gas station in northwest China for 1 year[J]. Atmospheric Chemistry and Physics, 2018, 18(7): 4567-4595. DOI:10.5194/acp-18-4567-2018 |
| [43] |
张翼翔, 尹沙沙, 袁明浩, 等. 郑州市春季大气挥发性有机物污染特征及源解析[J]. 环境科学, 2019, 40(10): 4372-4381. Zhang Y X, Yin S S, Yuan M H, et al. Characteristics and source apportionment of ambient VOCs in spring in Zhengzhou[J]. Environmental Science, 2019, 40(10): 4372-4381. |
| [44] | Barletta B, Meinardi S, Simpson I J, et al. Ambient mixing ratios of nonmethane hydrocarbons (NMHCs) in two major urban centers of the Pearl River Delta (PRD) region: Guangzhou and Dongguan[J]. Atmospheric Environment, 2008, 42(18): 4393-4408. DOI:10.1016/j.atmosenv.2008.01.028 |
| [45] | Bari A, Kindzierski W B. Ambient volatile organic compounds (VOCs) in Calgary, Alberta: sources and screening health risk assessment[J]. Science of the Total Environment, 2018, 631-632: 627-640. DOI:10.1016/j.scitotenv.2018.03.023 |
| [46] | Li B W, Ho S S H, Gong S L, et al. Characterization of VOCs and their related atmospheric processes in a central Chinese city during severe ozone pollution periods[J]. Atmospheric Chemistry and Physics, 2019, 19(1): 617-638. DOI:10.5194/acp-19-617-2019 |
| [47] | Cui L, Wang X L, Ho K F, et al. Decrease of VOC emissions from vehicular emissions in Hong Kong from 2003 to 2015:results from a tunnel study[J]. Atmospheric Environment, 2018, 177: 64-74. DOI:10.1016/j.atmosenv.2018.01.020 |
| [48] | Knighton W B, Herndon S C, Wood E C, et al. Detecting fugitive emissions of 1, 3-Butadiene and Styrene from a petrochemical facility: an application of a mobile laboratory and a modified proton transfer reaction mass spectrometer[J]. Industrial & Engineering Chemistry Research, 2012, 51(39): 12706-12711. |
| [49] |
杜桂敏, 张良, 王晓利, 等. 衡水夏季典型时段VOCs污染特征及O3污染过程分析[J]. 中国环境监测, 2020, 36(6): 72-79. Du G M, Zhang L, Wang X L, et al. Analysis of VOCs pollution characteristics and O3 pollution process in the typical summer period of Hengshui[J]. Environmental Monitoring in China, 2020, 36(6): 72-79. |
| [50] | Song Y, Shao M, Liu Y, et al. Source apportionment of ambient volatile organic compounds in Beijing[J]. Environmental Science & Technology, 2007, 41(12): 4348-4353. |
| [51] | Wang H L, Wang Q, Chen J M, et al. Do vehicular emissions dominate the source of C6-C8 aromatics in the megacity Shanghai of eastern China?[J]. Journal of Environmental Sciences, 2015, 27: 290-297. DOI:10.1016/j.jes.2014.05.033 |
| [52] | Guo H, Cheng H R, Ling Z H, et al. Which emission sources are responsible for the volatile organic compounds in the atmosphere of Pearl River Delta?[J]. Journal of Hazardous Materials, 2011, 188(1-3): 116-124. DOI:10.1016/j.jhazmat.2011.01.081 |
| [53] | Ma Z B, Liu C T, Zhang C L, et al. The levels, sources and reactivity of volatile organic compounds in a typical urban area of Northeast China[J]. Journal of Environmental Sciences, 2019, 79: 121-134. DOI:10.1016/j.jes.2018.11.015 |
| [54] | Yan Y L, Peng L, Li R M, et al. Concentration, ozone formation potential and source analysis of volatile organic compounds (VOCs) in a thermal power station centralized area: a study in Shuozhou, China[J]. Environmental Pollution, 2017, 223: 295-304. DOI:10.1016/j.envpol.2017.01.026 |
| [55] | Tsai W Y, Chan L Y, Blake D R, et al. Vehicular fuel composition and atmospheric emissions in South China: Hong Kong, Macau, Guangzhou, and Zhuhai[J]. Atmospheric Chemistry and Physics, 2006, 6(11): 3281-3288. DOI:10.5194/acp-6-3281-2006 |
| [56] | Barletta B, Meinardi S, Rowland F S, et al. Volatile organic compounds in 43 Chinese cities[J]. Atmospheric Environment, 2005, 39(32): 5979-5990. DOI:10.1016/j.atmosenv.2005.06.029 |
| [57] | Yuan Z B, Zhong L J, Lau A K H, et al. Volatile organic compounds in the Pearl River Delta: identification of source regions and recommendations for emission-oriented monitoring strategies[J]. Atmospheric Environment, 2013, 76: 162-172. DOI:10.1016/j.atmosenv.2012.11.034 |
| [58] | Brown S G, Frankel A, Hafner H R. Source apportionment of VOCs in the Los Angeles area using positive matrix factorization[J]. Atmospheric Environment, 2007, 41(2): 227-237. DOI:10.1016/j.atmosenv.2006.08.021 |
| [59] |
严晗. 北京典型道路机动车污染物排放与浓度特征研究[D]. 北京: 清华大学, 2014. 63. Yan H. Characterazing emission and curb concentrations of vehicular pollutants for typical roads in Beijing[D]. Beijing: Tsinghua University, 2014. 63. https://xueshu.baidu.com/usercenter/paper/show?paperid=16509769357d62b6c8ed21fbf39a9fea&site=xueshu_se&hitarticle=1 |