 2021, Vol. 42

2. 中国科学院大学, 北京 100049
 , SONG Kai-fu1,2 , HUANG Qiong1,2 , WANG Tian-yu1,2 , ZHANG Guang-bin1 , MA Jing1 , ZHU Chun-wu1 , XU Hua1
2. University of Chinese Academy of Sciences, Beijing 100049, China
大气CO2浓度升高([CO2]e)不可遏制.其浓度已由工业革命前的278 μmol·mol-1上升至目前的410 μmol·mol-1, 预计至本世纪末将达到537~670 μmol·mol-1[1].稻米是世界上过半人口的主食, 随着人口数量的持续增长, 人类对稻米的需求也将日趋增加[2].[CO2]e能够促进水稻生长, 对水稻产量也具有一定的正效应, 在[CO2]e约200 μmol·mol-1情况下, 水稻产量可增加3%~36%[3~5].未来[CO2]e条件下, 高产水稻品种的种植对未来气候条件下缓解温度升高导致的水稻减产以及保证粮食安全尤为重要.前人利用[CO2]e平台(free-air CO2 enrichment platform, FACE)发现, 按照水稻产量增幅对[CO2]e响应的不同, 可将水稻品种划分为高应答(产量增幅大于30%)和低应答水稻品种(产量增幅约为10%~15%)[4, 6~8].高、低应答水稻对[CO2]e的响应差异可为未来气候条件下水稻品种的筛选提供科学依据.
稻田生态系统是温室气体CH4和N2O的重要人为排放源之一, 分别约占全球农业生产活动总排放量的10%~20%[9]和5%~13%[10~12].自20世纪90年代, 关于[CO2]e对稻田CH4和N2O排放的影响研究备受国内外学者关注[13~16].而目前关于[CO2]e对稻田CH4和N2O排放的影响研究结果并不一致. Wang等[17]的研究表明, [CO2]e能够显著促进稻田CH4和N2O排放, 原因可能是, 一方面, [CO2]e促进水稻光合作用和根系生长, 增加根系分泌物等产CH4底物和水稻分蘖数, 进而促进CH4产生和排放[18]; 另一方面, [CO2]e能够增加稻田土壤硝化和反硝化潜势, 进而增加N2O排放[19].但也有研究表明[14, 20], [CO2]e能够显著抑制稻田CH4和N2O排放, 其原因可能与[CO2]e促进水稻生长的同时, 能够促进O2向下传输, 进而增加稻田CH4的氧化以及促进土壤氮素的吸收, 从而减少产N2O底物有关.在未来[CO2]e条件下, 如何既能满足人类对水稻产量的需求, 又可以减少稻田CH4和N2O排放是当前乃至今后亟需解决的科学问题.针对上述问题, 前人已开展了大量相关研究[17~19, 21~26], 但涉及高应答水稻品种稻田CH4和N2O排放对[CO2]e的响应研究较少.另一方面, 由于FACE试验运行高成本特点, 以往研究仅阐述了短期(小于10 a)[CO2]e的影响, 而对长期(大于10 a)[CO2]e的影响研究鲜见报道[27].因此, 长期[CO2]e对水稻产量以及稻田CH4和N2O排放的影响尚待深入研究.
本研究利用我国第一个且连续运行时间最长的稻田FACE平台, 以高、低应答水稻品种为供试材料, 探究水稻产量以及稻田CH4和N2O排放对长期[CO2]e的响应, 以期为准确评估未来气候变化对水稻生产的影响提供科学依据和数据支撑.
1 材料与方法 1.1 试验设计本试验于2016~2017年稻季在江苏省扬州市江都区稻田FACE平台(119°42′00″E, 32°35′34″N)进行.该地区属于亚热带季风气候, 平均海拔为5 m, 年均气温为15.1℃, 年均降雨量为980 mm.试验地耕作方式2010年前为稻-麦轮作, 2010年后改为水稻-冬闲单季种植. 2016~2017年水稻生长季气温和降雨量如图 1所示.供试土壤类型为下位砂姜土, 有机碳18.4 g·kg-1, 全氮1.45 g·kg-1, 全磷0.63 g·kg-1, 全钾14.0 g·kg-1, 速效磷10.1 mg·kg-1, 速效钾70.5 mg·kg-1, 砂粒(0.02~2.00 mm)578.4 g·kg-1, 粉砂粒(0.002~0.020 mm)285.1 g·kg-1, 黏粒(< 0.002 mm)136.5 g·kg-1, 容重1.16 g·cm-3, 土壤pH 7.2[28].

|
图 1 2016~2017年水稻生长季气温和降雨量的动态变化 Fig. 1 Temporal dynamics of air temperature and precipitation during the rice growing seasons in 2016-2017 |
该平台始建于2004年, 包括3个FACE圈和3个对照圈.FACE圈的[CO2]比对照圈高200 μmol·mol-1, 各圈之间间隔大于90 m, 以减少CO2释放对其他圈的影响.FACE圈的高[CO2]是利用CO2储存罐输送, 并通过固定在八边形上的管道向中心喷射纯CO2气体得以实现.与此同时, 实时监测的计算机网络和圈内的传感器对FACE圈的[CO2]进行控制, 并根据圈内[CO2]、风向、风速以及水稻冠层高度等条件自动调节CO2的释放方向和速度[29].平台CO2熏蒸时间一般为6月下旬至10月下旬, 每日熏蒸时间为日出至日落.
本试验采用裂区设计, 主区为两种[CO2]处理: 对照处理(正常大气[CO2], [CO2]a)和在[CO2]a基础上升高200 μmol·mol-1处理([CO2]e); 副区为两种不同类型的水稻品种: 高应答水稻品种(扬稻6号, S)和低应答水稻品种(武运粳23号, W).水稻移栽密度为24穴·m-2.根据当地农户常规种植方法, 在满足分蘖数量又能保证氮肥供应充足的情况下, 高应答水稻每穴选栽1苗, 而低应答水稻每穴选栽2苗, 秧苗均为1蘖苗.施氮总量为225 kg·hm-2, 比例为基肥40%∶分蘖肥30%∶穗肥30%.磷肥和钾肥作基肥一次性施入, 用量均为90 kg·hm-2.田间管理详见表 1.
|
|
表 1 2016~2017年水稻生长季田间管理措施 Table 1 Management of the paddy fields during the rice growing seasons in 2016-2017 |
1.2 样品采集分析
CH4和N2O气样样品采集采用静态透明箱法, 箱体材质为有机玻璃.采样箱分延长箱和顶箱两部分, 高度均为0.60 m, 底面积为0.35 m×0.35 m.延长箱顶部设有水封凹槽, 用于水稻生长后期加层, 深度为0.04 m.采样前将箱体罩在预先埋入各圈的底座(0.35 m×0.35 m×0.15 m)上, 底座顶端与圈内土壤表面齐平.整个水稻生长季, 在底座旁架设不锈钢桥以减少采样过程对试验的扰动.待静态箱密封后, 用两通针将箱内气体导入21 mL真空玻璃瓶中, 间隔12 min采样1次, 共采样4次.采样结束后, 尽快将静态箱移出各圈, 使采样箱对各圈的影响最小化.水稻成熟期之前采样间隔为3~7 d, 之后的间隔为10~12 d, 采样时间为08:00~11:00.采气同时, 记录箱温和表面水层深度用于计算CH4和N2O的排放通量.
气体样品的CH4和N2O浓度利用带氢火焰离子化检测器(FID)和63Ni电子捕获检测器(ECD)的安捷伦气相色谱(Agilent 7890B, 美国)测定.色谱柱箱内温度60℃, 检测器温度300℃, 尾吹气流量5 mL·min-1.测定CH4时, 空气流量400 mL·min-1, H2燃气流量45 mL·min-1, 载气为N2; 测定N2O时, 载气为95%Ar+5%CH4的混合气体.CH4和N2O标准气体由中国计量科学研究院提供.
对于稻田N2O排放而言, 由于样品处理不及时, 导致2016年稻田N2O排放通量并未检测.
水稻收获时, 通过选取有代表性的植株16穴测定产量.
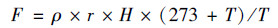
1.3 数据处理CH4和N2O排放通量计算公式[30]为:
|
(1) |
式中, F为CH4和N2O排放通量[mg·(m2·h)-1和μg·(m2·h)-1]; ρ为标准状态下CH4和N2O的密度, 分别取值0.714 kg·m-3和1.25 kg·m-3; r为单位时间箱内CH4和N2O浓度的变化量[μL·(L·d)-1]; H为箱体内部有效高度(m); T为密闭箱内温度(℃).
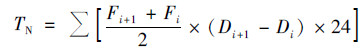
CH4和N2O排放总量通过每次观测值按时间间隔加权平均得到, 通过如下公式计算:
|
(2) |
式中, TN为CH4和N2O排放总量[10-2 kg·m-2和10-5 kg·hm-2]; Fi和Fi+1分别为第i和第i+1次采样时CH4和N2O的平均排放通量[mg·(m2·h)-1和μg·(m2·h)-1]; Di和Di+1分别为第i和第i+1次采样时间(d).
数据处理及分析利用Microsoft Excel 2007、Origin 8.5和SPSS 20.0完成.
2 结果与分析 2.1 水稻产量各处理水稻产量如图 2.在[CO2]e条件下, S和W处理水稻产量在9.20~12.01 t·hm-2之间, 而在[CO2]a条件下, S和W处理水稻产量在7.91~9.29 t·hm-2之间.2016年, 与[CO2]a对比, [CO2]e增加S处理的水稻产量29.35%(P < 0.05), 增加W处理水稻产量14.33%(P > 0.05);2017年, 相比于[CO2]a, [CO2]e增加S处理的水稻产量30.84%(P < 0.05), 增加W处理水稻产量12.45%(P > 0.05).两年平均而言, 相比[CO2]a, [CO2]e增加S处理的水稻产量30.04%(P < 0.05), 增加W处理水稻产量13.41%(P > 0.05).

|
不同小写字母表示各处理之间差异显著(P < 0.05) 图 2 2016~2017年各处理水稻产量对长期[CO2]e的响应 Fig. 2 Response of the grain yield of different treatments to [CO2]e during the rice growing seasons in 2016-2017 |
由图 3可知: 2016~2017年水稻生长季, 无论在[CO2]a还是[CO2]e条件下, S和W处理CH4排放通量的变化规律基本保持一致, 均表现为前期淹水排放不断增加, 中期烤田后排放开始降低, 至成熟后的排水落干时期逐渐降低并维持在较低水平.各处理CH4排放峰值出现在中期烤田之前.2016年, 各处理稻田CH4排放通量峰值均出现在移栽后的第37 d, [CO2]a-S和[CO2]e-S处理的峰值分别为31.03 mg·(m2·h)-1和18.13 mg·(m2·h)-1; 而[CO2]a-W处理和[CO2]e-W处理的峰值分别为27.73 mg·(m2·h)-1和18.44 mg·(m2·h)-1 [图 3(a)].2017年, 各处理稻田CH4排放通量峰值均出现在移栽后的第41 d, [CO2]a-S和[CO2]e-S处理的峰值分别为30.27 mg·(m2·h)-1和23.95 mg·(m2·h)-1; 而[CO2]a-W处理和[CO2]e-W处理的峰值分别为41.76 mg·(m2·h)-1和32.98 mg·(m2·h)-1 [图 3(b)].对比[CO2]a, [CO2]e降低S和W处理稻田CH4排放通量(图 3).

|
图 3 2016~2017年水稻生长季各处理稻田CH4排放通量 Fig. 3 CH4 fluxes of different treatments during the rice growing seasons in 2016-2017 |
2016~2017年水稻生长季, 各处理稻季CH4排放总量如表 2所示.[CO2]a和[CO2]e条件下, 各处理稻田CH4排放总量的范围分别为228.33~351.18 kg·hm-2和105.78~312.46 kg·hm-2; 与对应的[CO2]a处理相比, [CO2]e-S和[CO2]e-W处理在2016年分别降低稻田CH4排放总量59%(P < 0.05)和54%(P < 0.05), 在2017年分别降低21%(P > 0.05)和11%(P > 0.05).对比[CO2]a, [CO2]e条件下S处理降低稻田CH4排放的幅度大于W处理(表 2).
|
|
表 2 长期[CO2]e条件下稻田CH4和N2O排放总量1) Table 2 Total CH4 and N2O emissions from rice paddy field under the long-term [CO2]e condition |
2.3 稻田N2O排放
2017年各处理稻田N2O排放通量如图 4所示.前期持续淹水条件下, 各处理稻田N2O排放通量处于较低水平, 至中期烤田的41 d内稳定在0~44.35 μg·(m2·h)-1.中期烤田时, 各处理稻田N2O排放通量快速上升, 于移栽后第46 d达到峰值.[CO2]a-S和[CO2]e-S处理的峰值分别为596.59 μg·(m2·h)-1和121.94 μg·(m2·h)-1; 而[CO2]a-W处理和[CO2]e-W处理的峰值分别为226.28 μg·(m2·h)-1和54.49 μg·(m2·h)-1.复水后的干湿交替时期至成熟后的排水落干时期各处理稻田N2O排放通量快速降低并维持在较低水平.各处理N2O排放主要集中在中期烤田期间.对比[CO2]a, [CO2]e明显降低S和W处理稻田N2O排放通量; 并且, 无论在[CO2]a还是[CO2]e条件下, S处理稻田N2O排放均低于W处理(图 4).

|
图 4 2017年水稻生长季各处理稻田N2O排放通量 Fig. 4 N2O fluxes of different treatments during the rice growing seasons in 2017 |
由表 2可知: 2017年水稻生长季, [CO2]a条件下, S和W处理稻田N2O排放总量分别为0.92 kg·hm-2和0.42 kg·hm-2; 而在[CO2]e条件下, S和W处理稻田N2O排放总量分别为0.28 kg·hm-2和0.25 kg·hm-2.与相应的[CO2]a处理对比, [CO2]e-S和[CO2]e-W处理分别降低稻田N2O排放总量70%(P < 0.05)和40%(P < 0.05).对比[CO2]a, [CO2]e条件下S处理降低稻田N2O排放的幅度大于W处理(表 2).
2.4 水稻产量、CH4和N2O排放与[CO2]e年限的关系结合本试验FACE平台以往有关水稻产量的研究结果[4, 5, 7, 31~36]可得到[CO2]e条件下水稻产量增幅与[CO2]e年限的关系(图 5).相对于[CO2]a, [CO2]e条件下水稻产量增幅为-1%~46%, 且其随[CO2]e年限的增加显著降低(P < 0.001).这表明, 无论水稻品种为高应答水稻品种还是低应答水稻品种, 长期[CO2]e具有减少水稻产量增幅的效应.

|
虚线表示95%置信区间,下同 图 5 江都FACE平台水稻产量增幅与[CO2]e年限的关系 Fig. 5 Relationship between grain yield and the duration of [CO2]e at the Jiangdu FACE platform |
结合中国和日本FACE平台以往有关CH4[25~27, 37~41]和N2O[20, 42]排放的研究结果发现: 相比于[CO2]a, [CO2]e条件下, 稻田CH4排放的增幅范围为-59%~273%, 且其与[CO2]e年限呈显著负相关关系[P < 0.01, 图 6(a)], 这表明随着[CO2]e年限的增加, [CO2]e对稻田CH4排放的促进作用不断减弱.与[CO2]a对比, [CO2]e条件下, 稻田N2O排放的增幅范围为-73%~34%, 但由于缺少[CO2]e年限6~12 a的观测, 稻田N2O排放的增幅与[CO2]e年限并无显著相关关系[图 6(b)].

|
图 6 中国和日本FACE平台CH4和N2O排放的增幅与[CO2]e年限的关系 Fig. 6 Relationship between CH4 and N2O emissions and the duration of [CO2]e at the Chinese and Japanese FACE platform |
2016~2017年水稻生长季, 对比[CO2]a, [CO2]e增加S处理水稻产量30%(29%~31%), 增加W处理水稻产量13%(12%~14%), 这表明, 水稻产量对[CO2]e的响应能力在S和W之间存在显著差异(图 2).有研究表明[6, 8, 43], 早期FACE试验的供试水稻品种多为低应答水稻品种, [CO2]e能够促进低应答水稻品种增产4%~21%, 但这远低于生长箱试验和模型预测的水稻增产平均幅度[44].中国FACE后期发现了增产幅度对[CO2]e响应超过30%的高应答水稻品种[4, 7], 这对于水稻丰产和粮食安全具有重要意义.然而, 随着[CO2]e年限的增加, 水稻产量的平均增幅不断降低(图 5), 这表明长期[CO2]e减缓了水稻产量的增加趋势.长期[CO2]e条件下, 尽管有人为氮源的不断投入, 但由于厌氧氨氧化和铁还原的作用, 导致大量氨氮损失[45], 这势必会影响水稻植株的生长和水稻产量.王从[46]的研究结果发现, 水稻在[CO2]e条件下的生长过程、产量以及产量构成均受到可获取氮源数量的影响; 同时, 当水稻植株可获取氮源数量降低时, 水稻生理指标, 如光饱和点光合速率和叶面积指数均有显著下降.另一方面, 尽管[CO2]e增加了水稻产量, 但长期[CO2]e条件为水稻产量提升所带来的优势, 伴随着大气温度的不断上升被逐渐削弱[45].长期[CO2]e条件下, 高应答水稻品种S增产幅度高于低应答水稻品种W, 可视为优先选择种植的水稻品种进行推广.然而, 有研究表明[47], 高应答水稻品种稻米品质明显低于低应答水稻.因此, 在未来气候条件下, 如何培育新品种、协调增产以及提高稻米品质是未来关于粮食安全的重要科学问题.
3.2 长期[CO2]e对稻田CH4排放的影响本研究表明, 对比[CO2]a, 长期[CO2]e降低高、低应答水稻S和W处理稻田CH4排放11%~59%(图 3和表 2), 这与以往绝大多数研究结果相反[15, 17, 18, 22, 26, 38].有研究表明, [CO2]e促进稻田CH4排放, 例如, Liu等[23]和van Groenigen等[48]通过Meta-analysis发现[CO2]e显著增加稻田CH4排放34%~43%, 其原因可能是[CO2]e促进了水稻植株生长和光合作用, 从而增加了水稻根系分泌物等产CH4底物, 进而促进稻田CH4排放.然而, 这些研究主要针对短期(年限小于5 a)[CO2]e效应, 对于长期(年限大于10 a)[CO2]e响应研究涉及较少[图 6(a)]. Tokida等[27]利用[CO2]e年限大于10 a的日本稻田FACE平台认为, [CO2]e并未显著促进稻田CH4排放, 这说明长期[CO2]e对稻田CH4排放的正效应可能随着[CO2]e年限的增加而减弱.本研究通过汇总以往稻田FACE研究结果发现, 长期和短期[CO2]e对稻田CH4排放的影响存在一定差异; 而且, 随着[CO2]e年限增加, [CO2]e对稻田CH4排放的促进作用不断减弱, 甚至出现抑制作用[图 6(a)].这可能是由于长期[CO2]e条件下, 水稻生物量的增幅逐渐减低, 尽管长期[CO2]e能够增加土壤有机碳含量, 但适宜的水稻品种能够增加有机碳固存, 进而减少土壤碳损失[49], 导致可利用的产CH4底物降低, 从而减缓了稻田CH4排放.另一方面, 长期[CO2]e能够增加甲烷氧化菌群落丰度, 降低产甲烷菌群落丰度, 这也可能是长期[CO2]e减少稻田CH4排放的原因[50].此外, 土壤碳氮比是[CO2]e条件下稻田CH4排放的重要因素, 并且稻田CH4排放随着土壤碳氮比的增加显著减少[46].长期[CO2]e条件下, 土壤氮含量的减少导致土壤碳氮比的增加, 进而减少稻田CH4排放[25, 46, 51].本试验中, 长期[CO2]e条件下, 对比W处理, S处理可减少更多的稻田CH4排放(表 2), 这可能与高应答水稻品种水稻植株具有更多的生物量[52], 从而具有更强的根系泌氧能力有关[5].
3.3 长期[CO2]e对稻田N2O排放的影响无论[CO2]a还是[CO2]e条件下, 稻田N2O排放主要集中在中期烤田期间(图 4), 此时稻田氧化还原电位由还原态向氧化态转变, 适宜土壤N2O产生[42].本试验表明, 长期[CO2]e降低高、低应答水稻品种稻田N2O排放40%~70%(表 2), 主要是由于降低了中期烤田时期稻田N2O排放通量(图 4), 其原因可能是此时水稻植株快速生长, 土壤氮素被水稻植株吸收导致土壤中产N2O底物减少, 从而减少稻田N2O排放.另一方面, 长期[CO2]e条件下, 土壤氮矿化速率增加[53], 土壤产N2O底物供应减少, 最终也可能导致稻田N2O排放的减少.长期[CO2]e条件下, 对比W处理, S处理减少稻田N2O排放幅度更为显著(表 2), 这表明高应答水稻品种氮素利用能力更强, 导致土壤无机氮含量降低, 进而减少了稻田N2O排放.本研究发现, 长、短期[CO2]e对稻田N2O排放并无明显差异[图 6(b)].Yao等[20]的研究认为, 稻田N2O排放对[CO2]e的响应受到土壤中氮盈余的直接影响.短期[CO2]e条件下, 高氮投入的稻田N2O排放显著增加, 这与稻田反硝化作用增强有关[17].
4 结论(1) 长期[CO2]e增加高、低应答水稻产量, 其中高应答水稻产量达显著水平.长期[CO2]e减少高、低应答水稻稻田CH4排放, 其中2016年达显著水平.长期[CO2]e显著减少高、低应答水稻稻田N2O排放.
(2) 水稻产量、稻田CH4排放对长期[CO2]e的响应受[CO2]e年限影响.随着[CO2]e年限的增加, 水稻产量和稻田CH4排放的增幅显著下降, 而稻田N2O排放则无明显变化.
(3) 对比低应答水稻品种, 高应答水稻品种具有更好的“增产减排”效果.未来气候条件下, 可优先选择种植高应答水稻品种.
| [1] | Kuzyakov Y, Horwath W R, Dorodnikov M, et al. Review and synthesis of the effects of elevated atmospheric CO2 on soil processes: No changes in pools, but increased fluxes and accelerated cycles[J]. Soil Biology and Biochemistry, 2019, 128: 66-78. DOI:10.1016/j.soilbio.2018.10.005 |
| [2] | Alexandratos N, Bruinsma J. World agriculture towards 2030/2050:the 2012 revision[M]. Rome: Food and Agriculture Organization, 2012. |
| [3] | Hasegawa T, Sakai H, Tokida T, et al. Rice cultivar responses to elevated CO2 at two free-air CO2 enrichment(FACE)sites in Japan[J]. Functional Plant Biology, 2013, 40(2): 148-159. DOI:10.1071/FP12357 |
| [4] | Liu H J, Yang L X, Wang Y L, et al. Yield formation of CO2-enriched hybrid rice cultivar Shanyou 63 under fully open-air field conditions[J]. Field Crops Research, 2008, 108(1): 93-100. DOI:10.1016/j.fcr.2008.03.007 |
| [5] | Zhu C W, Zhu J G, Cao J, et al. Biochemical and molecular characteristics of leaf photosynthesis and relative seed yield of two contrasting rice cultivars in response to elevated[CO2][J]. Journal of Experimental Botany, 2014, 65(20): 6049-6056. DOI:10.1093/jxb/eru344 |
| [6] | Kim H Y, Lieffering M, Kobayashi K, et al. Effects of free-air CO2 enrichment and nitrogen supply on the yield of temperate paddy rice crops[J]. Field Crops Research, 2003, 83(3): 261-270. DOI:10.1016/S0378-4290(03)00076-5 |
| [7] | Yang L X, Liu H J, Wang Y X, et al. Yield formation of CO2-enriched inter-subspecific hybrid rice cultivar Liangyoupeijiu under fully open-air field condition in a warm sub-tropical climate[J]. Agriculture, Ecosystems & Environment, 2009, 129(1-3): 193-200. |
| [8] | Yang L X, Wang Y L, Dong G C, et al. The impact of free-air CO2 enrichment(FACE)and nitrogen supply on grain quality of rice[J]. Field Crops Research, 2007, 102(2): 128-140. DOI:10.1016/j.fcr.2007.03.006 |
| [9] | Saunois M, Stavert A R, Poulter B, et al. The global methane budget 2000-2017[J]. Earth System Science Data, 2020, 12(3): 1561-1623. DOI:10.5194/essd-12-1561-2020 |
| [10] | Bouwman A F, Boumans L J M, Batjes N H. Emissions of N2O and NO from fertilized fields: summary of available measurement data[J]. Global Biogeochemical Cycles, 2002, 16(4): 1058. DOI:10.1029/2001gb001811 |
| [11] | Davidson E A. The contribution of manure and fertilizer nitrogen to atmospheric nitrous oxide since 1860[J]. Nature Geoscience, 2009, 2(9): 659-662. DOI:10.1038/ngeo608 |
| [12] | Wang Q H, Zhou F, Shang Z Y, et al. Data-driven estimates of global nitrous oxide emissions from croplands[J]. National Science Review, 2020, 7(2): 441-452. DOI:10.1093/nsr/nwz087 |
| [13] | Allen L H, Albercht S L J, Colon W, et al. Effects of carbon dioxide and temperature on methane emission of rice[J]. International Rice Research Newsletter, 1994, 19(3): 43. |
| [14] | Schrope M K, Chanton J P, Allen L H, et al. Effect of CO2 enrichment and elevated temperature on methane emissions from rice, Oryza sativa[J]. Global Change Biology, 1999, 5(5): 587-599. DOI:10.1111/j.1365-2486.1999.00252.x |
| [15] | Ziska L H, Moya T B, Wassmann R, et al. Long-term growth at elevated carbon dioxide stimulates methane emission in tropical paddy rice[J]. Global Change Biology, 1998, 4(6): 657-665. DOI:10.1046/j.1365-2486.1998.00186.x |
| [16] | 王大力. 大气CO2浓度升高对全球CH4排放的影响[J]. 科学通报, 1999, 44(1): 1-6. |
| [17] | Wang B, Li J L, Wan Y F, et al. Responses of yield, CH4 and N2O emissions to elevated atmospheric temperature and CO2 concentration in a double rice cropping system[J]. European Journal of Agronomy, 2018, 96: 60-69. DOI:10.1016/j.eja.2018.01.014 |
| [18] | Inubushi K, Cheng W G, Aonuma S, et al. Effects of free-air CO2 enrichment(FACE)on CH4 emission from a rice paddy field[J]. Global Change Biology, 2003, 9(10): 1458-1464. DOI:10.1046/j.1365-2486.2003.00665.x |
| [19] | Bhattacharyya P, Roy K S, Neogi S, et al. Impact of elevated CO2 and temperature on soil C and N dynamics in relation to CH4 and N2O emissions from tropical flooded rice(Oryza sativa L.)[J]. Science of the Total Environment, 2013, 461-462: 601-611. DOI:10.1016/j.scitotenv.2013.05.035 |
| [20] | Yao Z S, Wang R, Zheng X H, et al. Elevated atmospheric CO2 reduces yield-scaled N2O fluxes from subtropical rice systems: six site-years field experiments[J]. Global Change Biology, 2021, 27(2): 327-339. DOI:10.1111/gcb.15410 |
| [21] | Allen L H, Kimball B A, Bunce J A, et al. Fluctuations of CO2 in Free-Air CO2 Enrichment(FACE)depress plant photosynthesis, growth, and yield[J]. Agricultural and Forest Meteorology, 2020, 284. DOI:10.1016/j.agrformet.2020.107899 |
| [22] | Cheng W G, Yagi K, Sakai H, et al. Effects of elevated atmospheric CO2 concentrations on CH4 and N2O emission from rice soil: an experiment in controlled-environment chambers[J]. Biogeochemistry, 2006, 77(3): 351-373. DOI:10.1007/s10533-005-1534-2 |
| [23] | Liu S W, Ji C, Wang C, et al. Climatic role of terrestrial ecosystem under elevated CO2: a bottom-up greenhouse gases budget[J]. Ecology Letters, 2018, 21(7): 1108-1118. DOI:10.1111/ele.13078 |
| [24] | Qian H Y, Huang S, Chen J, et al. Lower-than-expected CH4 emissions from rice paddies with rising CO2 concentrations[J]. Global Change Biology, 2020, 26(4): 2368-2376. DOI:10.1111/gcb.14984 |
| [25] | Xie B H, Zhou Z X, Mei B L, et al. Influences of free-air CO2 enrichment(FACE), nitrogen fertilizer and crop residue incorporation on CH4 emissions from irrigated rice fields[J]. Nutrient Cycling in Agroecosystems, 2012, 93(3): 373-385. DOI:10.1007/s10705-012-9523-z |
| [26] | Zheng X H, Zhou Z X, Wang Y S, et al. Nitrogen-regulated effects of free-air CO2 enrichment on methane emissions from paddy rice fields[J]. Global Change Biology, 2006, 12(9): 1717-1732. DOI:10.1111/j.1365-2486.2006.01199.x |
| [27] | Tokida T, Fumoto T, Cheng W, et al. Effects of free-air CO2 enrichment(FACE)and soil warming on CH4 emission from a rice paddy field: impact assessment and stoichiometric evaluation[J]. Biogeosciences, 2010, 7(9): 2639-2653. DOI:10.5194/bg-7-2639-2010 |
| [28] |
周娟, 舒小伟, 赖上坤, 等. 不同类型水稻品种产量和氮素吸收利用对大气CO2浓度升高响应的差异[J]. 中国水稻科学, 2020, 34(6): 561-573. Zhou J, Shu X W, Lai S K, et al. Differences in response of grain yield, nitrogen absorption and utilization to elevated CO2 concentration in different rice varieties[J]. Chinese Journal of Rice Science, 2020, 34(6): 561-573. |
| [29] |
袁嫚嫚, 朱建国, 刘钢, 等. 不同天气水稻光合日变化对大气CO2浓度和温度升高的响应——FACE研究[J]. 生态学报, 2018, 38(6): 1897-1907. Yuan M M, Zhu J G, Liu G, et al. Response of diurnal variation in photosynthesis to elevated atmospheric CO2 concentration and temperature of rice between cloudy and sunny days: a free air CO2 enrichment study[J]. Acta Ecologica Sinica, 2018, 38(6): 1897-1907. |
| [30] |
蔡祖聪, 徐华, 马静. 稻田生态系统CH4和N2O排放[M]. 合肥: 中国科学技术大学出版社, 2009. Cai Z C, Xu H, Ma J. Methane and nitrous oxide emissions from rice-based ecosystems[M]. Hefei: University of Science and Technology of China Press, 2009. |
| [31] | Chen C, Jiang Q, Ziska L H, et al. Seed vigor of contrasting rice cultivars in response to elevated carbon dioxide[J]. Field Crops Research, 2015, 178: 63-68. DOI:10.1016/j.fcr.2015.03.023 |
| [32] | Fan G Z, Cai Q S, Li X C, et al. Yield components and its conformation responded to elevated atmospheric CO2 in three rice(Oryza sativa L.)generations[J]. African Journal of Biotechnology, 2010, 9(14): 2118-2124. |
| [33] | Li C H, Zhu J G, Sha L N, et al. Rice(Oryza sativa L.)growth and nitrogen distribution under elevated CO2 concentration and air temperature[J]. Ecological Research, 2017, 32(3): 405-411. DOI:10.1007/s11284-017-1450-7 |
| [34] | Wang W L, Cai C, He J, et al. Yield, dry matter distribution and photosynthetic characteristics of rice under elevated CO2 and increased temperature conditions[J]. Field Crops Research, 2020, 248. DOI:10.1016/j.fcr.2019.107605 |
| [35] | Zhu C W, Xu X, Wang D, et al. An indica rice genotype showed a similar yield enhancement to that of hybrid rice under free air carbon dioxide enrichment[J]. Scientific Reports, 2015, 5(1). DOI:10.1038/srep12719 |
| [36] |
赖上坤, 周三妮, 顾伟锋, 等. 二氧化碳、施氮量和移栽密度对汕优63产量形成的影响——FACE研究[J]. 农业环境科学学报, 2014, 33(5): 836-843. Lai S K, Zhou S N, Gu W F, et al. Effects of CO2 concentration, nitrogen supply and transplanting density on yield formation of hybrid rice Shanyou 63:A FACE study[J]. Journal of Agro-Environment Science, 2014, 33(5): 836-843. |
| [37] | Fumoto T, Hasegawa T, Cheng W G, et al. Application of a process-based biogeochemistry model, DNDC-Rice, to a rice field under free-air CO2 enrichment(FACE)[J]. Journal of Agricultural Meteorology, 2013, 69(3): 173-190. DOI:10.2480/agrmet.69.3.11 |
| [38] | Wang C, Jin Y G, Ji C, et al. An additive effect of elevated atmospheric CO2 and rising temperature on methane emissions related to methanogenic community in rice paddies[J]. Agriculture, Ecosystems & Environment, 2018, 257: 165-174. |
| [39] | Xu Z J, Zheng X H, Wang Y S, et al. Effects of elevated CO2 and N fertilization on CH4 emissions from paddy rice fields[J]. Global Biogeochemical Cycles, 2004, 18(3). DOI:10.1029/2004gb002233 |
| [40] |
马红亮, 朱建国, 谢祖彬, 等. 自由大气CO2浓度升高对稻田CH4排放的影响研究[J]. 农业环境科学学报, 2010, 29(6): 1217-1224. Ma H L, Zhu J G, Xie Z B, et al. The effects of elevated atmospheric[CO2] on emission of CH4 from rice paddy field[J]. Journal of Agro-Environment Science, 2010, 29(6): 1217-1224. |
| [41] |
周超, 刘树伟, 张令, 等. 温度和CO2浓度升高对稻田CH4排放的影响: T-FACE平台观测研究[J]. 农业环境科学学报, 2013, 32(10): 2077-2083. Zhou C, Liu S W, Zhang L, et al. Effect of elevated CO2 and temperature on CH4 emissions from rice paddy fields: a T-FACE experiment[J]. Journal of Agro-Environment Science, 2013, 32(10): 2077-2083. DOI:10.11654/jaes.2013.10.026 |
| [42] |
王从, 李舒清, 刘树伟, 等. 大气CO2浓度和温度升高对稻麦轮作生态系统N2O排放的影响[J]. 中国农业科学, 2018, 51(13): 2535-2550. Wang C, Li S Q, Liu S W, et al. Response of N2O emissions to elevated atmospheric CO2 concentration and temperature in rice-wheat rotation agroecosystem[J]. Scientia Agricultura Sinica, 2018, 51(13): 2535-2550. |
| [43] | Yang L X, Huang J Y, Yang H J, et al. Seasonal changes in the effects of free-air CO2 enrichment(FACE)on dry matter production and distribution of rice(Oryza sativa L.)[J]. Field Crops Research, 2006, 98(1): 12-19. DOI:10.1016/j.fcr.2005.11.003 |
| [44] | Long S P, Ainsworth E A, Leakey A D B, et al. Food for thought: lower-than-expected crop yield stimulation with rising CO2 concentrations[J]. Science, 2006, 312(5782): 1918-1921. DOI:10.1126/science.1114722 |
| [45] | Xu C C, Zhang K H, Zhu W Y, et al. Large losses of ammonium-nitrogen from a rice ecosystem under elevated CO2[J]. Science Advances, 2020, 6(42). DOI:10.1126/sciadv.abb7433 |
| [46] |
王从. 稻麦轮作生态系统温室气体排放对大气CO2浓度和温度升高的响应研究[D]. 南京: 南京农业大学, 2017. Wang C. Effects of elevated CO2 and temperature on greenhouse gases(CH4 and N2O)emission from rice-wheat rotation systems[D]. Nanjing: Nanjing Agricultural University, 2017. |
| [47] | Zhu C W, Kobayashi K, Loladze I, et al. Carbon dioxide(CO2)levels this century will alter the protein, micronutrients, and vitamin content of rice grains with potential health consequences for the poorest rice-dependent countries[J]. Science Advances, 2018, 4(5). DOI:10.1126/sciadv.aaq1012 |
| [48] | van Groenigen K J, Osenberg C W, Hungate B A. Increased soil emissions of potent greenhouse gases under increased atmospheric CO2[J]. Nature, 2011, 475(7355): 214-216. DOI:10.1038/nature10176 |
| [49] | Hu Z K, Chen X Y, Yao J N, et al. Plant-mediated effects of elevated CO2 and rice cultivars on soil carbon dynamics in a paddy soil[J]. New Phytologist, 2020, 225(6): 2368-2379. DOI:10.1111/nph.16298 |
| [50] |
于海洋, 王天宇, 黄琼, 等. 长期大气CO2浓度升高对稻田CH4排放的影响[J]. 土壤学报, 2021. Yu H Y, Wang T Y, Huang Q, et al. Effect of long-term elevated CO2 concentration on CH4 emissions from rice paddy fields[J]. Acta Pedologica Sinica, 2021. DOI:10.11766/trxb202009110515 |
| [51] |
户少武, 张欣, 景立权, 等. 高浓度CO2对稻穗不同位置籽粒结实和米质性状的影响[J]. 应用生态学报, 2019, 30(11): 3725-3734. Hu S W, Zhang X, Jing L Q, et al. Effects of elevated CO2 concentration on grain filling capacity and quality of rice grains located at different positions on a panicle[J]. Chinese Journal of Applied Ecology, 2019, 30(11): 3725-3734. |
| [52] | Jiang Y, van Groenigen K J, Huang S, et al. Higher yields and lower methane emissions with new rice cultivars[J]. Global Change Biology, 2017, 23(11): 4728-4738. DOI:10.1111/gcb.13737 |
| [53] | Wu Q C, Zhang C Z, Liang X Q, et al. Elevated CO2 improved soil nitrogen mineralization capacity of rice paddy[J]. Science of the Total Environment, 2020, 710. DOI:10.1016/j.scitotenv.2019.136438 |