 2021, Vol. 42

2. 天津市环境气象中心, 天津 300074;
3. 天津市河东区生态环境监测中心, 天津 300170
 , XIAO Zhi-mei1 , YANG Ning1 , CAI Zi-ying2 , YAN Bin-feng3 , YUAN Jie1 , BAI Yu1 , ZHENG Nai-yuan1 , TANG Miao1
2. Tianjin Environmental Meteorological Center, Tianjin 300074, China;
3. Tianjin Hedong Eco-Environmental Monitoring Center, Tianjin 300170, China
重污染是影响城市环境空气质量达标的主要因素, 严重影响了人们正常的生产生活, 引起社会各界的广泛关注.当重污染天气发生时, 细颗粒物浓度呈增长态势[1~3], 除对人体健康具有很大影响外[4~6], 还会造成能见度的降低[7, 8].近年来, 重污染天气成因[9~14]、重污染天气下PM2.5的化学组分特征[15~18]和来源[19~24]、春节假期期间烟花爆竹燃放对重污染天气的影响[25~30]、重污染天气下大气气溶胶消光特性[31~41]等得到了广泛研究.以上研究表明本地污染源排放、静稳高湿的不利气象条件和区域传输等是造成冬季重污染过程的重要因素; 重污染天气发生时, NO3-(13.8% ~36.7%)、OM(9.4% ~26.8%)、SO42-(9.7% ~23.0%)、NH4+(10.3% ~20.8%)和EC(1.6% ~5.9%)是PM2.5中的主要组分, 二次粒子(36.0% ~58.0%)、机动车(6.9% ~26.0%)和燃煤及工业(8.0% ~48.1%)等为PM2.5的主要来源; PM2.5中主要组分对大气消光也有重要影响.以往对重污染天气下大气气溶胶消光特性的研究通常只针对单次重污染过程, 且忽略了污染源排放与气溶胶光学特性之间的关系, 而了解冬季多次重污染过程气溶胶消光特性及其来源的共性和差异, 对于有针对性地改善大气能见度和减少大气光学污染具有十分重要的意义.
天津是京津冀区域核心城市之一, 位于京津冀区域的中北部, 是环渤海地区的经济中心, 是京津冀区域典型工业城市, PM2.5污染较重[42], 选取天津市为研究城市开展分析, 对进一步了解我国北方城市重污染天气气溶胶消光特性具有典型意义.本文通过对2020年1~2月天津市3次重污染天气展开系统观测(为便于分析比较, 将1月16~18日重污染天气称为重污染过程Ⅰ, 1月26~28日称为重污染过程Ⅱ, 2月9~10日重度污染天气称为重污染过程Ⅲ), 从颗粒物的散射与吸收对消光的贡献等分析了大气气溶胶的消光特性, 给出了重污染天气下大气气溶胶消光的来源, 探讨了多次重污染过程气溶胶消光特性及其来源的共性和差异, 以期为更好解决城市大气环境问题提供依据.
1 材料与方法 1.1 观测场地观测场地位于天津市南开区天津市生态环境监测中心4楼楼顶, 距地面约15 m, 为天津市生态环境监测中心超级站.采样点周边为居住区和学校, 北面300 m左右为主要交通线复康路, 监测时间为2020年1月1日至2月15日. 监测点位分布见图 1.

|
图 1 观测点位示意 Fig. 1 Location of the sampling station |
超级站监测的各项指标、仪器型号及方法原理如表 1所示, 详细介绍见文献[43~46].为保证数据的可靠性与连续性, 在观测期间定期对各仪器设备进行检查维护.颗粒物监测仪每月更换采样滤膜, 对采样流量进行校准; 每季度进行压力传感器和温度传感器校验; 每半年进行比例系数(K0)校验, 质量控制均严格按照文献[47]要求进行.离子分析仪定期检查采样主流量(3 L ·min-1), 每月配制标准溶液(标准溶液均为优级纯), 绘制标准曲线, 相关系数除NH4+外, 均大于99.9%(NH4+相关系数大于99.5%).碳分析仪每天用定量的甲烷作为内标物自动进行内标检查, 每月用标准蔗糖溶液进行外标校正, 并定期检查系统采样流量(8 L ·min-1).浊度计每日定时自动进行零点检查, 每周进行人工全校准或跨校准检测, 跨校准采用厂家推荐的R-134标准气体, 测量时相对湿度保持在60%以下, 由加热进气管控制.黑碳仪定期更换纸带并检查系统采样流量(5 L ·min-1).
|
|
表 1 监测项目及仪器1) Table 1 Online observation factors and instruments |
气象观测数据来自中国气象局天津大气边界层观测站(台站编号为54517).污染物浓度与气象观测数据分析时均以小时为时间分辨率.
1.3 研究方法 1.3.1 气溶胶消光系数计算消光系数的获取有直接观测和IMPROVE法则计算两种方法[48].前者主要基于观测仪器, 后者则综合大气中各种参与消光的组分的作用, 计算消光系数, 可直观反映各组分与消光系数之间的关系.
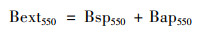
1.3.1.1 基于观测的消光系数气溶胶对太阳辐射的作用主要包括吸收和散射.因人类视觉最敏感的波长为550 nm, 故将散射系数和黑炭(black carbon, BC)浓度均转化至550 nm波长处的相应值.消光系数可以通过式(1)得到[49]:
|
(1) |
式中, Bext550为550 nm处气溶胶的消光系数(Mm-1), Bsp550为550 nm处的散射系数(Mm-1), Bap550为550 nm处的吸收系数(Mm-1).
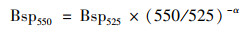
其中, Bsp550可由525 nm的散射系数进行转换, 表达式为:
|
(2) |
式中, Bsp525为525 nm处的散射系数(Mm-1), α为散射转化的Angstrom波长指数, 为1.3.
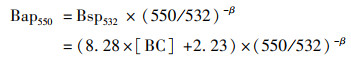
Bap550可由880 nm处BC浓度进行转换, 首先, 将880 nm处的BC浓度转化为532 nm处的气溶胶吸收系数[50](Mm-1), 再做波长订正到550 nm[51], 表达式为:
|
(3) |
式中, [BC]为880 nm处的BC浓度(μg ·m-3), 8.28为532 nm处通过色谱和光谱对比得到的换算因子[52], β为吸收转化的Angstrom波长指数, 为1.
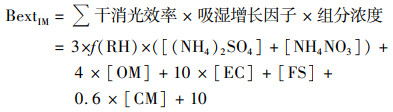
1.3.1.2 基于气溶胶组分的消光系数美国IMPROVE法则[53]的经验公式[式(4)]常被用来计算大气气溶胶的消光系数, 表达式为:
|
(4) |
式中, [(NH4)2SO4]=1.375×[SO42-]; [NH4NO3]=1.29×[NO3-]; [OM]=1.4×[OC]; [CM]=[PM10]-[PM2.5]; [FS]=2.2[Al]+2.49[Si]+1.94[Ti]+1.63[Ca]+2.42[Fe], f(RH)为吸湿增长因子, 不同湿度吸湿增长因子不同, 见表 2. [SO42-]、[NO3-]、[OC]、[EC]、[PM2.5]和[PM10]分别表示各自质量浓度(μg ·m-3); 10表示瑞利散射系数; 因重金属元素的监测数据缺乏, 本文气溶胶消光系数计算中, 没有包括[FS]项.
|
|
表 2 不同相对湿度条件下f(RH)值[49] Table 2 Statistical summary of mean f(RH) values in selected relative humidity ranges |
1.3.2 消光系数的解析方法
基于PMF和IMPROVE法则相结合的方法对气溶胶消光系数的来源进行解析, 该方法已经用于相关研究中[54, 55].首先, 利用PMF模型对PM2.5的来源进行解析, 以最小二乘法的方式来确定主要污染源及其贡献[56, 57].PMF模型为:

|
(5) |
式中, X为受体点位样品的各组分质量浓度矩阵, G为源贡献矩阵, F为源成分谱矩阵, E为残差.
然后, 基于PM2.5组分监测数据和上式得到因子谱, 计算各源类对各化学组分的贡献, 如式(6):
|
(6) |
式中, ai, j表示j源对i组分的贡献浓度(μg ·m-3), Fi, j表示j源对i组分的贡献比(%), Si表示组分i的浓度.
最后, 结合(4)式计算各源类贡献的消光系数Bextj, 则j源对消光系数的贡献比为:
|
(7) |
式中, ηj表示源对消光系数的相对贡献, Bextj表示根据j源的消光系数.
1.3.3 后轨迹模拟利用基于GIS的TrajStat软件[58](www.meteothinker.com)对观测期间天津市(39.10°N, 117.16°E)的气团传输轨迹进行48 h后轨迹模拟, 同时将空间相似度高的轨迹进行聚类分析.用于轨迹计算的气象场资料为美国国家海洋和大气管理局(NOAA)的全球同化系统(GDAS, Global Data Assimilation System)数据, 空间分辨率为1°, 数据资料获取网址为ftp://arlftp.arlhq.noaa.gov/archives/gdas1.模拟高度为500 m, 开始时间为每日00:00(UTC时间为前日16:00), 轨迹间隔2 h.
2 结果与讨论 2.1 气溶胶的光学特性3次重污染过程PM2.5平均浓度分别为(229±52)、(219±48)和(161±25)μg ·m-3, 与重污染过程Ⅰ和重污染过程Ⅱ相比, 重污染过程Ⅲ污染物浓度和污染程度均明显降低, 分别下降29.7%和26.5%, 这可能与重污染过程Ⅲ期间工厂延迟复工、疫情防控下交通出行减少导致的污染物排放强度降低有关. 3次重污染过程NO3-、SO42-、NH4+、OC、EC、Cl-和K+均为PM2.5中主要组分, 但呈现不同的特征(图 2):重污染过程Ⅰ, 二次无机离子(SO42-、NO3-和NH4+)平均浓度为133.9μg ·m-3, 远高于重污染过程Ⅱ的96.4μg ·m-3和重污染过程Ⅲ的87.3μg ·m-3, 特别是NO3-平均浓度, 分别是重污染过程Ⅱ和重污染过程Ⅲ的1.4倍和1.9倍, 这主要是因为重污染过程Ⅰ期间移动源、工业企业排放正常, 污染排放强度较大; 重污染过程Ⅱ中OC、K+和Cl-的浓度明显升高, 平均浓度分别为22.5、9.5和8.9μg ·m-3, 为重污染过程Ⅰ的1.7、4.0和1.6倍, 为重污染过程Ⅲ的1.7、2.1和1.6倍, 主要受春节期间烟花爆竹燃放影响; 重污染过程Ⅲ中各组分浓度均低于重污染过程Ⅰ和重污染过程Ⅱ.

|
图 2 3次重污染过程PM2.5中化学组分浓度及占比 Fig. 2 Chemical component concentrations and their mass ratios to PM2.5 during three heavy pollution episodes |
从PM2.5中化学组分占比看(图 2), 重污染过程Ⅰ和重污染过程Ⅲ中二次无机离子在PM2.5中占比较高, 分别为53.8%和51.9%, 远高于重污染过程Ⅱ的41.3%; 重污染过程Ⅰ中NO3-在PM2.5中的占比为25.0%, 远高于重污染过程Ⅱ和重污染过程Ⅲ的18.6%和19.3%; 重污染过程Ⅱ中OC、K+和Cl-在PM2.5中占比分别为9.7%、4.1%和3.8%, 为重污染过程Ⅰ的1.8、4.1和1.7倍, 为重污染过程Ⅲ的1.2、1.5和1.2倍; 重污染过程Ⅲ中SO42-和NH4+在PM2.5中的占比升高, 分别为18.8%和13.8%, 为重污染过程Ⅰ的1.2和1.1倍, 为重污染过程Ⅱ的1.4倍和1.4倍.
观测期间, 3次重污染过程散射系数(Bsp550)和吸收系数(Bap550)与PM2.5的变化趋势较一致, 相关系数分别为0.896、0.763、0.865和0.662、0.679、0.557, Bsp550与PM2.5的相关性更高. 3次重污染过程的Bsp550和Bap550分别为(1 055.65±250.17)、(1 054.26±263.22)、(704.44±109.89)Mm-1和(52.96±13.15)、(39.72±8.21)、(34.50±8.53)Mm-1(图 3), 气溶胶的散射效应大于吸收效应, 这与文献[31~33, 37, 40]的结果相一致.重污染过程Ⅰ和重污染过程Ⅱ的Bsp550和Bap550较高, 这主要与该两次重污染过程PM2.5浓度较高有关, 大气颗粒物浓度升高使光的散射和吸收增强.

|
图 3 3次重污染过程气溶胶散射系数和吸收系数 Fig. 3 Aerosol scattering and absorption coefficients during three heavy pollution episodes |
与国内其他城市相比, 天津市冬季重污染过程散射系数高于广州市[32]、南京市[33]以及天津市秋季重污染过程[34], 低于杭州市[35]和西安市[37]; 吸收系数高于南京市和天津市秋季重污染过程, 低于广州市和西安市.散射系数和吸收系数的地区差异性可能归因于各地污染源排放类型不同, 颗粒物化学组成也不同.
3次重污染过程平均消光系数Bext550和BextIM分别为(1 108.61±261.17)、(1 093.99±270.73)、(739.95±116.81)Mm-1和(722.90±141.87)、(591.61±123.32)、(468.21±58.40)Mm-1(图 4).两种方法得到的消光系数相关性较高, 3次重污染过程相关系数R2分别为0.989、0.698和0.785(图 4), 表明这两种方法均较为可靠.通过IMPROVE法则计算得到的消光系数小于观测得到的消光系数, 但两者随时间变化的趋势一致.造成结果偏低的原因可能为IMPROVE计算消光系数时土壤粒子数据的缺乏[式(4)中[FS]项], 此部分对消光系数的贡献未计算.

|
图 4 BextIM与Bext550的线性关系 Fig. 4 Linear relationship between BextIM and Bext550 |
由式(4)可知, 颗粒物组分浓度和相对湿度是影响气溶胶消光系数的两个重要因素. 3次重污染过程的平均相对湿度分别为65%、70%和68%, 差异较小.因此, 通过IMPROVE法计算的消光系数差异主要与PM2.5组分浓度有关, 各组分中, 起散射作用的主要组分是二次无机离子(secondary inorganic aerosol, SNA, SO42-、NO3-、NH4+的统称)和OC等, 起吸收作用的主要组分是EC等[59].重污染过程Ⅰ中, SNA的浓度分别为重污染过程Ⅱ和重污染过程Ⅲ的1.4和1.5倍; 重污染过程Ⅱ中, OC的浓度为重污染过程Ⅲ的1.7倍; 高PM2.5组分浓度导致了较高的消光系数.
2.2 颗粒物组分对消光系数的贡献和气溶胶消光的来源解析颗粒物组分构成的不同将导致其对消光系数的贡献不同.通过式(4)计算3次重污染过程PM2.5各组分对消光系数的相对贡献, 占比见图 5.重污染过程Ⅰ和重污染过程Ⅱ按顺序为硝酸盐(Nit, 48.8%和41.4%)>硫酸盐(Sul, 35.3%和31.1%)>OM(9.9%和21.8%)>EC(5.9%和5.6%)>粗粒子(CM, 0.0%和0.1%), 重污染过程Ⅲ按顺序为Sul(40.7%)>Nit(38.9%)>OM(15.6%)>EC(4.8%)>CM(0.0%). CM对消光系数贡献占比仅为0.0% ~0.1%, 这表明气溶胶消光中PM2.5起主要作用.PM2.5中, Nit、Sul和OM为最主要消光成分, 3次重污染过程三者总占比均超过90%. 3次重污染过程PM2.5组分对消光系数的贡献发生明显变化, 重污染过程Ⅰ, Nit对消光系数的贡献最高, 较重污染过程Ⅱ和重污染过程Ⅲ分别高17.9%和25.4%, 彼时移动源和工业企业排放正常, 这些源排放了较多的硝酸盐; 重污染过程Ⅱ中, OM对消光系数的贡献明显较高, 较重污染过程Ⅰ上升57.6%, 这主要受春节期间烟花爆竹燃放影响, 排放了较多的OC; 重污染过程Ⅲ中, Nit对消光系数的贡献降低, 较重污染过程Ⅰ和重污染过程Ⅱ分别下降20.3%和6.0%, Sul对消光系数的贡献升高, 较重污染过程Ⅰ和重污染过程Ⅱ分别上升15.3%和30.9%, 这可能与疫情防控下交通出行大量减少, 而燃煤源的排放相对较稳定有关.

|
图 5 3次重污染过程颗粒物组分对消光系数的贡献 Fig. 5 Contribution of components to the extinction coefficient during three heavy pollution episodes |
采用PMF模型解析得到的3次重污染过程各污染源因子谱见文献[19~20].根据式(6)和式(7)计算各类源对PM2.5消光系数的贡献, 占比见图 6.二次离子是大气消光的主要来源, 占比为37.1% ~42.0%; 燃煤和工业及机动车对消光系数贡献较接近, 分别为22.9% ~24.2%和23.9% ~27.2%; 扬尘源对消光系数的贡献为5.0% ~6.4%; 烟花爆竹及生物质燃烧排放的贡献为3.9% ~6.2%. 3次重污染过程PM2.5消光系数的来源发生明显变化, 与重污染过程Ⅰ相比, 重污染过程Ⅱ烟花爆竹及生物质燃烧排放对消光系数的贡献明显较高, 上升59.0%, 这可能与春节期间较多的烟花爆竹燃放有关; 重污染过程Ⅲ机动车对消光系数的贡献明显降低, 较重污染过程Ⅰ和重污染过程Ⅱ分别下降9.1%和12.1%, 这可能与疫情防控下交通出行大量减少有关.燃煤和工业对消光系数的贡献在3次重污染过程中较接近, 这主要是因为天津市本地高污染行业(包括钢铁、炼焦、玻璃、石化和制药等)存在大量不可中断工序, 在春节假期和疫情防控期间仍需要持续生产, 工业污染排放差异较小, 产业结构和能源结构的调整仍需作为天津市大气污染防治工作的主要方向.

|
图 6 3次重污染过程各源类对消光系数的贡献 Fig. 6 Contribution of various sources to the extinction coefficient during three heavy pollution episodes |
本研究利用48 h后轨迹模拟分析实验观测期间500 m高度处气团运输轨迹, 如图 7.将气团传输轨迹通过聚类分析得到3~4组主要传输轨迹.小尺度和短距离气团传输为主要传输类型[图 7中重污染过程Ⅰ(1)和重污染过程Ⅱ(1)、(2)], 来自河北, 因其移动速度慢, 不利于污染物扩散, 是造成重污染现象的原因之一; 重污染过程Ⅰ(2)、(3)、重污染过程Ⅱ(3)、(4)和重污染过程Ⅲ(1)等轨迹反映了中小尺度以及中短距离气团传输, 主要从内蒙古中部经山西、河北移动至天津; 重污染过程Ⅲ(2)、(3)代表大尺度、长距离的气团传输轨迹, 来自外蒙古经内蒙古、山西、河北移动至天津, 其前期移动较快, 进入山西后移动减慢.从3次污染过程的差异看, 重污染过程Ⅰ的气团经过天津西北部和西部的河北省部分区域和北京, 彼时交通出行正常, 其会携带较多的硝酸盐, 同时传输的NOx在天津本地进行二次转化, 也是加剧天津本地硝酸盐污染的原因之一; 重污染过程Ⅱ的(1)、(2)和(4)均经过天津东北部河北省部分区域, 一方面, 春节期间部分农村地区仍存在燃放烟花爆竹问题, 另一方面, 辽东半岛除夕到初一燃放的烟花爆竹污染气团经河北省东北部输送至天津, 加剧了天津本地污染; 重污染过程Ⅲ的气团均经过天津西南部的河北省部分区域, 受疫情延迟复工影响, 区域污染物排放强度相对较轻.总之, 重污染过程期间天津市的气团传输轨迹主要以短距离和中短距离为主, 这种气团传输类型风速较低, 不利于扩散, 污染物浓度增加[60], 气团运输经过区域的污染排放对观测城市的气溶胶消光特性及来源产生重要影响.

|
图 7 3次重污染过程500 m处48 h后向轨迹 Fig. 7 The 48 h backward trajectory map during three heavy pollution episodes at 500 m heights |
(1) 3次重污染过程PM2.5平均浓度分别为(229±52)、(219±48)和(161±25)μg ·m-3, NO3-、SO42-、NH4+、OC、EC、Cl-和K+为PM2.5中主要组分. 3次重污染过程平均散射系数(Bsp550)和吸收系数(Bap550)分别为(1 055.65±250.17)、(1 054.26±263.22)、(704.44±109.89)Mm-1和(52.96±13.15)、(39.72±8.21)、(34.50±8.53)Mm-1, 散射效应明显高于吸收效应, 高Bsp550和Bap550值主要与PM2.5浓度较高有关.
(2) 重污染天气下PM2.5中硝酸盐(Nit, 38.9% ~48.8%)、硫酸盐(Sul, 31.1% ~40.7%)和OM(9.9% ~21.8%)为最主要消光成分.PM2.5组分对消光系数的贡献与污染源排放密切相关, 重污染过程Ⅰ, 移动源和工业企业正常排放, Nit对消光系数的贡献最高, 较重污染过程Ⅱ和重污染过程Ⅲ分别高17.9%和25.4%; 重污染过程Ⅱ, 受春节期间烟花爆竹燃放影响, OM对消光系数的贡献较重污染过程Ⅰ上升57.6%; 重污染过程Ⅲ, 受交通出行减少但燃煤源排放相对稳定影响, Nit对消光系数的贡献降低, Sul对消光系数的贡献升高.
(3) 重污染天气PM2.5的消光系数主要来源为二次离子(37.1% ~42.0%)、燃煤和工业(22.9% ~24.2%)、机动车(23.9% ~27.2%)、扬尘源(5.0% ~6.4%)和烟花爆竹及生物质燃烧排放(3.9% ~6.2%).与重污染过程Ⅰ相比, 重污染过程Ⅱ烟花爆竹及生物质燃烧排放对消光系数的贡献上升59.0%; 重污染过程Ⅲ机动车对消光系数的贡献较重污染过程Ⅰ和重污染过程Ⅱ分别下降9.1%和12.1%; 燃煤和工业对消光系数的贡献在3次重污染过程中较接近(22.9%、24.0%和24.2%), 产业结构和能源结构的调整仍需作为天津市大气污染防治工作的主要方向.
(4) 后轨迹分析表明重污染期间天津市主要以来自河北的小尺度、短距离以及内蒙古中部的中尺度、中短距离气团传输轨迹为主, 这类气团风速较低, 不利于扩散, 加重了污染, 气团传输经过区域的污染排放对观测城市的气溶胶消光特性及来源产生重要影响.
| [1] | Xie Y Y, Ye X N, Ma Z, et al. Insight into winter haze formation mechanisms based on aerosol hygroscopicity and effective density measurements[J]. Atmospheric Chemistry and Physics, 2017, 17(11): 7277-7290. DOI:10.5194/acp-17-7277-2017 |
| [2] | Zhong J T, Zhang X Y, Dong Y S, et al. Feedback effects of boundary-layer meteorological factors on cumulative explosive growth of PM2.5 during winter heavy pollution episodes in Beijing from 2013 to 2016[J]. Atmospheric Chemistry and Physics, 2018, 18(1): 247-258. DOI:10.5194/acp-18-247-2018 |
| [3] | Sun W W, Wang D F, Yao L, et al. Chemistry-triggered events of PM2.5 explosive growth during late autumn and winter in Shanghai, China[J]. Environmental Pollution, 2019, 254. DOI:10.1016/j.envpol.2019.07.032 |
| [4] | Pope Ⅲ C A, Docker D W. Health effects of fine particulate air pollution: lines that connect[J]. Journal of the Air & Waste Management Association, 2006, 56(6): 709-742. |
| [5] | Guo T J, Wang Y Y, Zhang H G, et al. The association between ambient PM2.5 exposure and the risk of preterm birth in China: a retrospective cohort study[J]. Science of the Total Environment, 2018, 633: 1453-1459. DOI:10.1016/j.scitotenv.2018.03.328 |
| [6] | Fan F Y, Lei Y L, Li L. Health damage assessment of particulate matter pollution in Jing-Jin-Ji region of China[J]. Environmental Science and Pollution Research, 2019, 26(8): 7883-7895. DOI:10.1007/s11356-018-04116-8 |
| [7] | Wang X Y, Zhang R H, Yu W. The effects of PM2.5 concentrations and relative humidity on atmospheric visibility in Beijing[J]. Journal of Geophysical Research: Atmospheres, 2019, 124(4): 2235-2259. DOI:10.1029/2018JD029269 |
| [8] | 吴兑, 邓雪娇, 毕雪岩, 等. 细粒子污染形成灰霾天气导致广州地区能见度下降[J]. 热带气象学报, 2007, 23(1): 1-6. DOI:10.3969/j.issn.1004-4965.2007.01.001 |
| [9] |
程念亮, 李云婷, 张大伟, 等. 2014年10月北京市4次典型空气重污染过程成因分析[J]. 环境科学研究, 2015, 28(2): 163-170. Cheng N L, Li Y T, Zhang D W, et al. Analysis about the characteristics and formation mechanisms of serious pollution events in October 2014 in Beijing[J]. Research of Environmental Sciences, 2015, 28(2): 163-170. |
| [10] |
吕喆, 魏巍, 周颖, 等. 2015~2016年北京市3次空气重污染红色预警PM2.5成因分析及效果评估[J]. 环境科学, 2019, 40(1): 1-10. Lü Z, Wei W, Zhou Y, et al. Cause and effect evaluation of PM2.5 during three red alerts in Beijing from 2015 to 2016[J]. Environmental Science, 2019, 40(1): 1-10. |
| [11] |
张敬巧, 吴亚君, 张萌, 等. 聊城冬季一重污染过程PM2.5污染特征及成因分析[J]. 环境科学, 2018, 39(9): 4026-4033. Zhang J Q, Wu Y J, Zhang M, et al. PM2.5 pollution characterization and cause analysis of a winter heavy pollution event, Liaocheng city[J]. Environmental Science, 2018, 39(9): 4026-4033. |
| [12] |
刘可可, 张红, 刘桂建. 合肥市PM2.5和PM10中元素组成特征及重污染成因分析[J]. 环境科学, 2019, 40(8): 3415-3420. Liu K K, Zhang H, Liu G J. Elemental composition characteristics of PM2.5 and PM10, and heavy pollution analysis in Hefei[J]. Environmental Science, 2019, 40(8): 3415-3420. |
| [13] |
逯世泽, 史旭荣, 薛文博, 等. 新冠肺炎疫情期间气象条件和排放变化对PM2.5的影响[J]. 环境科学, 2021, 42(7): 3099-3106. Lu S Z, Shi X R, Xue W B, et al. Impacts of meteorology and emission variations on PM2.5 concentration throughout the country during the 2020 epidemic period[J]. Environmental Science, 2021, 42(7): 3099-3106. |
| [14] | Lv Z F, Wang X T, Deng F Y, et al. Source-receptor relationship revealed by the halted traffic and aggravated haze in Beijing during the COVID-19 lockdown[J]. Environmental Science & Technology, 2020, 54(24): 15660-15670. |
| [15] |
徐虹, 肖致美, 陈魁, 等. 天津市2017年重污染过程二次无机化学污染特征分析[J]. 环境科学, 2019, 40(6): 2519-2525. Xu H, Xiao Z M, Chen K, et al. Secondary inorganic pollution characteristics during heavy pollution episodes of 2017 in Tianjin[J]. Environmental Science, 2019, 40(6): 2519-2525. |
| [16] |
姚青, 刘子锐, 韩素芹, 等. 天津冬季一次重污染过程颗粒物中水溶性离子粒径分布特征[J]. 环境科学, 2017, 38(12): 4958-4967. Yao Q, Liu Z R, Han S Q, et al. Characteristics of the size distribution of water-soluble ions during a heavy pollution episode in the winter in Tianjin[J]. Environmental Science, 2017, 38(12): 4958-4967. |
| [17] |
王申博, 范相阁, 和兵, 等. 河南省春节和疫情影响情景下PM2.5组分特征[J]. 中国环境科学, 2020, 40(12): 5115-5123. Wang S B, Fan X G, He B, et al. Chemical composition characteristics of PM2.5 in Henan Province during the Spring Festival and COVID-19 outbreak[J]. China Environmental Science, 2020, 40(12): 5115-5123. DOI:10.3969/j.issn.1000-6923.2020.12.002 |
| [18] | Chang Y H, Huang R J, Ge X L, et al. Puzzling haze events in China during the coronavirus (COVID-19) shutdown[J]. Geophysical Research Letters, 2020, 47(12). DOI:10.1029/2020GL088533 |
| [19] |
肖致美, 徐虹, 蔡子颖, 等. 2020年天津市两次重污染天气污染特征分析[J]. 环境科学, 2020, 41(9): 3879-3888. Xiao Z M, Xu H, Cai Z Y, et al. Characterization of two heavy pollution episodes in Tianjin in 2020[J]. Environmental Science, 2020, 41(9): 3879-3888. DOI:10.3969/j.issn.1000-6923.2020.09.020 |
| [20] |
肖致美, 蔡子颖, 李鹏, 等. 2020年春节期间天津市重污染天气污染特征分析[J]. 环境科学学报, 2020, 40(12): 4442-4452. Xiao Z M, Cai Z Y, Li P, et al. Characterization of heavy air pollution events during the 2020 Spring Festival in Tianjin[J]. Acta Scientiae Circumstantiae, 2020, 40(12): 4442-4452. |
| [21] |
周静博, 段菁春, 王建国, 等. 2019年元旦前后石家庄市重污染过程PM2.5污染特征及来源解析[J]. 环境科学, 2020, 41(1): 39-49. Zhou J B, Duan J C, Wang J G, et al. Analysis of pollution characteristics and sources of PM2.5 during heavy pollution in Shijiazhuang city around New Year's Day 2019[J]. Environmental Science, 2020, 41(1): 39-49. |
| [22] |
刘倬诚, 牛月圆, 吴婧, 等. 山地型城市冬季大气重污染过程特征及成因分析[J]. 环境科学, 2021, 42(3): 1036-1314. Liu Z C, Niu Y Y, Wu J, et al. Characteristics and cause analysis of heavy air pollution in a mountainous city during winter[J]. Environmental Science, 2021, 42(3): 1036-1314. |
| [23] |
王彤, 华阳, 许庆成, 等. 京津冀郊区站点秋冬季大气PM2.5来源解析[J]. 环境科学, 2019, 40(3): 1035-1042. Wang T, Hua Y, Xu Q C, et al. Source apportionment of PM2.5 in suburban area of Beijing-Tianjin-Hebei Region in autumn and winter[J]. Environmental Science, 2019, 40(3): 1035-1042. |
| [24] | Dai Q L, Liu B S, Bi X H, et al. Dispersion normalized PMF provides insights into the significant changes in source contributions to PM2.5 after the COVID-19 outbreak[J]. Environmental Science & Technology, 2020, 54(16): 9917-9927. |
| [25] |
杨志文, 吴琳, 元洁, 等. 2015年春节期间天津烟花爆竹燃放对空气质量的影响[J]. 中国环境科学, 2017, 37(1): 69-75. Yang Z W, Wu L, Yuan J, et al. Effect of fireworks on the air quality during the Spring Festival of 2015 in Tianjin City[J]. China Environmental Science, 2017, 37(1): 69-75. |
| [26] |
谢瑞加, 侯红霞, 陈永山. 烟花爆竹集中燃放的大气细颗粒物(PM2.5)成分图谱[J]. 环境科学, 2018, 39(4): 1484-1492. Xie R J, Hou H X, Chen Y S. Analysis of the composition of atmospheric fine particles (PM2.5) produced by burning fireworks[J]. Environmental Science, 2018, 39(4): 1484-1492. |
| [27] |
徐文帅, 吴晓晨, 陈蕊, 等. 春节期间烟花爆竹燃放对海口市空气质量的影响[J]. 中国环境监测, 2020, 36(5): 104-111. Xu W S, Wu X C, Chen R, et al. Influence of burning fireworks on air quality during the Spring Festival in Haikou city[J]. Environmental Monitoring in China, 2020, 36(5): 104-111. |
| [28] |
吕文丽, 张凯, 曹晴, 等. 烟花爆竹燃放对大气污染物及PM2.5组分影响[J]. 中国环境科学, 2020, 40(8): 3303-3311. Lü W L, Zhang K, Cao Q, et al. Impacts of fireworks burning on atmospheric pollutants and water-soluble inorganic ions in PM2.5[J]. China Environmental Science, 2020, 40(8): 3303-3311. DOI:10.3969/j.issn.1000-6923.2020.08.007 |
| [29] |
曹馨元, 何月欣, 陈卫卫, 等. 烟花爆竹禁燃对春节期间东北地区空气质量影响评估[J]. 中国环境监测, 2018, 34(4): 77-84. Cao X Y, He Y X, Chen W W, et al. Effects of fireworks forbidden on air quality during the Spring Festival in northeast China[J]. Environmental Monitoring in China, 2018, 34(4): 77-84. |
| [30] | Sun Y L, Lei L, Zhou W, et al. A chemical cocktail during the COVID-19 outbreak in Beijing, China: insights from six-year aerosol particle composition measurements during the Chinese New Year holiday[J]. Science of the Total Environment, 2020, 742. DOI:10.1016/j.scitotenv.2020.140739 |
| [31] | Wang Y H, Liu Z R, Zhang J K, et al. Aerosol physicochemical properties and implications for visibility during an intense haze episode during winter in Beijing[J]. Atmospheric Chemistry and Physics, 2015, 15(6): 3205-3215. DOI:10.5194/acp-15-3205-2015 |
| [32] |
刘文彬, 王宇骏, 黄祖照, 等. 广州市冬季灰霾天气过程消光特性研究[J]. 生态环境学报, 2016, 25(11): 1755-1759. Liu W B, Wang Y J, Huang Z Z, et al. Research of extinction characteristics during haze events in winter of Guangzhou[J]. Ecology and Environmental Sciences, 2016, 25(11): 1755-1759. |
| [33] |
何镓祺, 于兴娜, 朱彬, 等. 南京冬季气溶胶消光特性及霾天气低能见度特征[J]. 中国环境科学, 2016, 36(6): 1645-1653. He J Q, Yu X N, Zhu B, et al. Characteristics of aerosol extinction and low visibility in haze weather in winter of Nanjing[J]. China Environmental Science, 2016, 36(6): 1645-1653. DOI:10.3969/j.issn.1000-6923.2016.06.008 |
| [34] |
张文辉, 丁净, 李立伟, 等. 基于气溶胶光学特性的颗粒物来源分析[J]. 环境科学研究, 2019, 32(11): 1826-1833. Zhang W H, Ding J, Li L W, et al. Source analysis of particulate matter based on aerosol optical properties[J]. Research of Environmental Sciences, 2019, 32(11): 1826-1833. |
| [35] |
徐昶, 叶辉, 沈建东, 等. 杭州大气颗粒物散射消光特性及霾天气污染特征[J]. 环境科学, 2014, 35(12): 4422-4430. Xu C, Ye H, Shen J D, et al. Light scattering extinction properties of atmospheric particle and pollution characteristics in hazy weather in Hangzhou[J]. Environmental Science, 2014, 35(12): 4422-4430. |
| [36] |
刘召策, 袁琦, 胡伟, 等. 邯郸市冬季一次霾过程中细颗粒物化学组分的污染特征及消光贡献[J]. 地球化学, 2020, 49(3): 298-305. Liu Z C, Yuan Q, Hu W, et al. Pollution characteristics and extinction contribution of chemical composition in fine particulate matter during a winter haze episode in Handan[J]. Geochimica, 2020, 49(3): 298-305. |
| [37] | Zhou Y Q, Wang Q Y, Zhang X, et al. Exploring the impact of chemical composition on aerosol light extinction during winter in a heavily polluted urban area of China[J]. Journal of Environmental Management, 2019, 247: 766-775. DOI:10.1016/j.jenvman.2019.06.100 |
| [38] | Liu A K, Wang H L, Cui Y, et al. Characteristics of aerosol during a severe haze-fog episode in the Yangtze River Delta: particle size distribution, chemical composition, and optical properties[J]. Atmosphere, 2020, 11(1). DOI:10.3390/atmos11010056 |
| [39] | Cheng Z, Wang S X, Qiao L P, et al. Insights into extinction evolution during extreme low visibility events: case study of Shanghai, China[J]. Science of the Total Environment, 2018, 618: 793-803. DOI:10.1016/j.scitotenv.2017.08.202 |
| [40] | Lan Z J, Zhang B, Huang X F, et al. Source apportionment of PM2.5 light extinction in an urban atmosphere in China[J]. Journal of Environmental Sciences, 2018, 63: 277-284. DOI:10.1016/j.jes.2017.07.016 |
| [41] |
周变红, 曹夏, 张容端, 等. 宝鸡高新区冬季大气消光系数及其组成特征[J]. 大气与环境光学学报, 2020, 15(3): 196-206. Zhou B H, Cao X, Zhang R D, et al. Characteristics of atmospheric extinction coefficient and its components in Baoji High-Tech Zone in winter[J]. Journal of Atmospheric and Environmental Optics, 2020, 15(3): 196-206. |
| [42] | 中华人民共和国生态环境部. 2017中国生态环境状况公报[EB/OL]. http://www.mee.gov.cn/hjzl/sthjzk/zghjzkgb/201805/P020180531534645032372.pdf, 2021-01-22. |
| [43] | Liu B S, Yang J M, Yuan J, et al. Source apportionment of atmospheric pollutants based on the online data by using PMF and ME2 models at a megacity, China[J]. Atmospheric Research, 2017, 185: 22-31. DOI:10.1016/j.atmosres.2016.10.023 |
| [44] |
元洁, 刘保双, 程渊, 等. 2017年1月天津市区PM2.5化学组分特征及高时间分辨率来源解析研究[J]. 环境科学学报, 2018, 38(3): 1090-1101. Yuan J, Liu B S, Cheng Y, et al. Study on characteristics of PM2.5 and chemical components and source apportionment of high temporal resolution in January 2017 in Tianjin urban area[J]. Acta Scientiae Circumstantiae, 2018, 38(3): 1090-1101. |
| [45] |
丁净. 大气重污染过程中空气湿度对气溶胶理化性质及辐射效应的影响[D]. 天津: 南开大学, 2020. Ding J. Impact of air humidity on aerosol physicochemical properties and radiative effects in atmospheric haze episodes[D]. Tianjin: Nankai University, 2020. |
| [46] | Liu B S, Bi X H, Feng Y C, et al. Fine carbonaceous aerosol characteristics at a megacity during the Chinese Spring Festival as given by OC/EC online measurements[J]. Atmospheric Research, 2016, 181: 20-28. DOI:10.1016/j.atmosres.2016.06.007 |
| [47] | HJ 817-2018, 环境空气颗粒物(PM2.5和PM10)连续自动监测系统运行和质控技术规范[S]. |
| [48] |
刘敬乐, 姚青, 蔡子颖, 等. 基于太阳光度计的天津城区气溶胶光学特性[J]. 中国环境科学, 2017, 37(11): 4013-4021. Liu J L, Yao Q, Cai Z Y, et al. Analysis on aerosol optical characteristics with sun photometer in Tianjin[J]. China Environmental Science, 2017, 37(11): 4013-4021. DOI:10.3969/j.issn.1000-6923.2017.11.002 |
| [49] | Seinfeld J H, Pandis S N. Atmospheric chemistry and physics: from air pollution to climate change[M]. New York: John Wiley & Sons Inc., 1998: 1128-1133. |
| [50] |
吴兑, 毛节泰, 邓雪娇, 等. 珠江三角洲黑碳气溶胶及其辐射特性的观测研究[J]. 中国科学D辑: 地球科学, 2009, 52(11): 1542-1553. Wu D, Mao J T, Deng X J, et al. Black carbon aerosols and their radiative properties in the Pearl River Delta region[J]. Science in China Series D: Earth Sciences, 2009, 52(8): 1152-1163. |
| [51] | Bergstrom R W, Russell P B, Hignett P. Wavelength dependence of the absorption of black carbon particles: predictions and results from the TARFOX experiment and implications for the aerosol single scattering albedo[J]. Journal of the Atmospheric Sciences, 2002, 59(3): 567-577. DOI:10.1175/1520-0469(2002)059<0567:WDOTAO>2.0.CO;2 |
| [52] | Yan P, Tang J, Huang J, et al. The measurement of aerosol optical properties at a rural site in Northern China[J]. Atmospheric Chemistry and Physics, 2008, 8(8): 2229-2242. DOI:10.5194/acp-8-2229-2008 |
| [53] | Pitchford M, Maim W, Schichtel B, et al. Revised algorithm for estimating light extinction from IMPROVE particle speciation data[J]. Journal of the Air & Waste Management Association, 2007, 57(11): 1326-1336. |
| [54] |
李倩, 吴琳, 张进生, 等. 廊坊市夏季大气气溶胶消光特性及其来源[J]. 中国环境科学, 2019, 39(6): 2249-2257. Li Q, Wu L, Zhang J S, et al. Extinction characteristics of aerosol and the contribution of pollution source to light extinction in Langfang[J]. China Environmental Science, 2019, 39(6): 2249-2257. DOI:10.3969/j.issn.1000-6923.2019.06.002 |
| [55] |
李宽. 武汉城区灰霾污染特征及大气消光性研究[D]. 武汉: 武汉理工大学, 2018. Li K. Study on the characteristics of haze pollution and atmospheric extinction in urban Wuhan[D]. Wuhan: Wuhan University of Technology, 2018. |
| [56] | Norris G, Duvall R, Brown S, et al. EPA Positive Matrix Factorization (PMF) 5.0 fundamentals and user guide[R]. Washington, DC: U.S. Environmental Protection Agency, 2014. |
| [57] | Paatero P. Least squares formulation of robust non-negative factor analysis[J]. Chemometrics and Intelligent Laboratory Systems, 1997, 37(1): 23-35. DOI:10.1016/S0169-7439(96)00044-5 |
| [58] | Wang Y Q, Zhang X Y, Draxler R R. TrajStat: GIS-based software that uses various trajectory statistical analysis methods to identify potential sources from long-term air pollution measurement data[J]. Environmental Modelling & Software, 2009, 24(8): 938-939. |
| [59] |
黄广寒. 上海近地面大气颗粒物的化学组成与光学特性[D]. 上海: 复旦大学, 2013. Huang G H. Chemical composition and optical properties of surface atmospheric particles in Shanghai[D]. Shanghai: Fudan University, 2013. |
| [60] | Liu B S, Cheng Y, Zhou M, et al. Effectiveness evaluation of temporary emission control action in 2016 in winter in Shijiazhuang, China[J]. Atmospheric Chemistry and Physics, 2018, 18(10): 7019-7039. DOI:10.5194/acp-18-7019-2018 |