 2020, Vol. 41

2. 中国科学院城市环境研究所, 厦门 361021;
3. 中国科学院宁波城市环境观测研究站, 宁波 315800;
4. 上海师范大学环境与地理科学学院, 上海 200234
 , WANG Wen-dong2,3 , LIU Dong2,3 , LI Gang2,3
 , YU Hong-mei1 , HUANG Sha4 , XU Yao-yang2,3
2. Institute of Urban Environment, Chinese Academy of Sciences, Xiamen 361021, China;
3. Ningbo Research Center for Urban Environment, Chinese Academy of Sciences, Ningbo 315800, China;
4. School of Environment and Geographical Sciences, Shanghai Normal University, Shanghai 200234 China
在流域生态研究中, 重金属是指不可降解且有毒性的物质, 具有隐蔽性强, 危害时间持久, 消除难度大的特点[1].水体中重金属按照赋存形态可以分成溶解态和颗粒态(悬浮态和沉积态)[2], 而溶解态既是重金属在水体中的主要迁移形式, 又会对下游的生态系统产生重要的影响[3], 因此了解水体中溶解态重金属的环境行为能更好地认识水体中重金属的环境效应.
在持续的人为压力下流域内重金属浓度高于背景值且污染来源复杂[4~7], 不同的土地利用类型与流域内水质和水量之间存在着密切关系[8, 9].近年来, 国内外学者对不同流域内重金属风险[10~15]、污染特征[16, 17]、积累效应[18, 19]和来源解析[20~22], 不同土地利用类型下重金属的时空分布[23~27]、迁移转化与驱动机制[28, 29], 水生态过程的演化机制与模型[30], 景观生态效应与流域内重金属的关系[31, 32]等方面进行了大量的研究.证明了流域内重金属存在不同程度风险、点源面源共同作用、生物富集和人为源为主导的现象; 土地利用类型的变化是流域重金属时空分布、迁移转化的主导因素之一; 降水、气候和水文特征驱动着重金属的动态变化; 流域重金属受平均斑块规模、破碎化程度、聚集化程度和景观形状复杂度影响.但以海湾流域为视角, 流域内土地利用对重金属的来源解析与风险评价仍然较少, 且现有的研究分析仍以湖泊和江河为主[33, 34], 方法主要为相关性分析.
近年来, 以象山港为依托的农业、工业和旅游业得到迅速发展, 港区内土地利用格局发生改变[35].这些变化对象山港地区的自然地球化学以及化学元素的迁移转化产生了巨大的影响[36].城镇化改变土地利用格局[37]加剧海湾景观演变的复杂性, 景观格局变化引起的海侵海退致使成土母质的化学元素不断迁移释放到水体中; 不透水面的变化对径流产生影响, 降低水体自净能力, 并将不透水面表面的颗粒冲刷到流域内的水生系统中, 最终影响流域的化学循环[38]; 工业活动产生的废水废气废渣, 农业耕作中大量施用的农药化肥, 旅游业经营中产生的重金属污染物慢慢渗入环境介质中, 通过渗透、径流和搬运等多种方式危及流域内地表水环境[39].
港区各流域内的河流集饮水、灌溉、养殖、航运、调节气候和维持生态平衡的作用为一身[38], 对象山港具有极其重要的地位.象山港的丰水期较长为4~10月[40], 且在丰水期内流域内养殖、林业、工业和旅游等经济活动活跃.本文以宁波象山港入海口为研究对象, 在象山港丰水期对流域污染河流8种溶解态重金属Cr、Mn、Fe、Cu、Zn、As、Cd和Pb的污染现状开展了调查与分析, 通过单因子污染指数(Pi)、内梅罗综合污染指数(Pn)和重金属污染指数(HPI)评价方法对象山港流域内溶解态重金属风险进行评估, 结合每个流域的土地利用方式进行水体中溶解态重金属的来源解析, 区分流域内重金属的来源, 恶化程度, 有利于准确判定污染源头对污染进行及时修复, 保护流域内生态环境并使其得到良性发展.
1 材料与方法 1.1 流域特征和采样点布置象山港地处浙江北部, 北部毗邻杭州湾, 东侧紧靠舟山群岛, 南部邻近三门湾, 是一个由东北向西南深入内陆的条带状半封闭式深水避风港湾(29°24′~29°46′ N, 121°25′~122°00′ E, 图 1).海岸线曲折[41], 全长291 km; 海域辽阔, 海域面积约为920.87 km2.象山港流域内河流具有河网密、源头近、流程短和流量小的特点[42], 港湾内以发展临港经济为主, 人类活动对港湾内河流影响巨大[43].象山港流域地形特征与其他港湾性流域相似[44], 主要由低山、山前岗和平原组成, 发育众多河流.

|
图 1 象山港流域采样点分布及土地利用方式 Fig. 1 Distribution of sampling points and land-use pattern in the Xiangshan Bay watershed |
本文研究的象山港流域, 是以象山港周边的北仑、鄞州、奉化、宁海和象山这5个县区的23个乡镇内地表水最终汇入港湾的陆域部分.它具有典型港湾地区特点, 发育众多河流, 据实地统计有52条入海河流[45].流域气候类型属于亚热带季风气候, 温暖湿润, 无霜期年平均约248 d, 年平均气温为16~17℃, 年平均降水量1 400 mm以上.流域内具有丰富的林业资源、海水养殖资源、生态环境资源、旅游休闲资源和港口资源, 是宁波市重要的经济增长地区[44].近年来象山港产业结构转型迅速, 打造生态型港区, 大力发展旅游业, 规划五处休闲度假旅游区.
本次采样时间为2018年9月中旬, 持续时间为1个月.根据象山港的水位特征, 在象山港丰水期时, 陆相一侧进行广谱式采样, 采集港内所有入湾河流.如果遭遇下雨, 在雨停后2 d继续采样, 减少降水对样品的干扰.本次采样根据广谱式采样原则, 用采水器采集流域内河流50 cm处表层水[43].根据现场考察情况, 因施工干扰和河流断流等原因删除个别采样点, 最终在象山港流域内共采集到52个样品.采样瓶采用聚乙烯塑料瓶用10%硝酸浸泡24 h, 样品采集完成后立即用硝酸酸化至pH < 2, 返回实验室后用0.45 μm醋酸纤维滤膜过滤, 存放于4℃冰箱冷藏, 在两周之内完成测量.
1.2 样品测定样品采用的是ICP-MS电感耦合等离子体质谱仪进行测定, 为满足上机要求, 按照2‰的盐度, 对样品进行分别稀释. 8种重金属的检出限分别为:Cr 0.020 μg·L-1、Mn 0.002μg·L-1、Fe 0.322μg·L-1、Cu 0.009μg·L-1、Zn 0.069μg·L-1、As 0.004μg·L-1、Cd 0.003μg·L-1和Pb 0.002μg·L-1.标准物质采用的是国标标准物质研究中心生产的GSB 04-1767-2004多元素标准溶液.
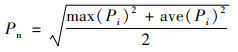
1.3 分析与评价方法 1.3.1 单因子污染指数法和综合污染指数法对象山港流域河流水体中单一重金属污染水平和综合重金属污染水平进行评价[46], 相关标准见表 1, 计算公式如下:
|
|
表 1 单因子污染指数和综合污染指数的评价标准 Table 1 Standards for single factor pollution index (Pi) and composite pollution index (Pn) |

|
(1) |
|
(2) |
式中, Pi为水体中重金属的单因子污染指数(single factor pollution index); ci为象山港流域内河流重金属的实测浓度; Si为重金属的评价标准值; Pn为象山港流域内水体重金属综合污染指(composite pollution index).
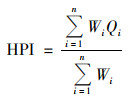
1.3.2 重金属污染指数对流域内各个重金属产生的水质污染影响进行综合评价, 相关参数毒理学及健康依据文献[47], HPI(heavy metal pollution index)模型计算公式如下:
|
(3) |
式中, Qi是第i个参数的子索引, Wi是第i个参数的单位权重, n是考虑参数的个数.
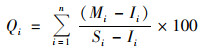
参数的子索引Qi计算公式如下:
|
(4) |
式中, Mi是第i个参数的重金属测量浓度, Ii是i个参数的理想值, Si是第i个参数的标准值.Prasad等[47]推荐可允许的临界污染指数值为100.
采用《地表水环境质量标准》(GB 3838-2002)中Ⅰ类水的水质标准限值作为流域水体中的评价标准, 地表水环境质量标准基本项目中未涵盖的重金属(Fe和Mn)参考集中式生活饮用水地表水源地标准限值[48].
1.3.3 数据分析处理本文研究利用SPSS 25.0和EXCEL 2019对数据进行处理和描述性统计; 用ArcGIS 10.5对2017年象山港流域内土地利用方式进行分析-提取-裁剪-叠加-合并绘制象山港内每个流域的土地利用方式; 利用Origin2018和Canoco 5等软件进行数据的分析.
2 结果与分析 2.1 象山港流域水体中重金属的浓度变化特征象山港流域8种溶解态重金属浓度含量特征统计分析结果见图 2和表 2. Cr、Mn、Fe、Cu、Zn、As、Cd和Pb的平均含量分别为1.03、28.77、29.54、2.79、14.27、2.02、0.14和0.52μg·L-1, 存在Fe>Mn>Zn>Cu>As>Cr>Pb>Cd的关系.象山港流域内溶解态重金属浓度低于国家Ⅰ类水的标准, 水质较好, 不存在重金属环境恶化情况和污染现象.但与其他标准相比浓度较高, 研究区域内Mn、Cu、Zn、Cd和Pb的平均含量分别为标准背景值的5.75、1.85、1.42、1.93和2.6倍; Cr、Mn、Fe、Cu、As、Cd和Pb的平均含量分别为白溪水库的6.89、27.67、4.67、2.95、11.21、13.52和4.00倍.Cr、Fe和As平均含量与标准背景值大致相当, Zn平均含量略低于白溪水库.变异系数(CV)是衡量数据的离散程度.从统计结果来看, 变异系数呈现Mn>Cr>Cu>Cd>Pb>As>Zn>Fe的关系, 其中Cr、Mn和Cu变异系数分别达到了1.23、1.92和1.16, 均为强变异, 表明象山港流域水中Cr、Mn和Cu浓度在空间的变化较大, 受影响的敏感程度较大.

|
图 2 象山港流域不同区县的重金属浓度情况 Fig. 2 Heavy metal concentrations in different districts in the Xiangshan Bay watershed |
|
|
表 2 象山港流域重金属含量的描述性统计1)(n=52) Table 2 Descriptive statistics of heavy metal content in the Xiangshan Bay watershed (n=52) |
2.2 象山港流域重金属的空间变化特征
象山港流域重金属浓度的空间变化见图 3, Cr、Mn和Cu在空间上分布规律相似, 绝大多数点位浓度较低, 但个别点位在空间上浓度变化较大, 高值出现在宁海县和象山县东北部, 需要结合流域土地利用方式做进一步分析.Pb与Cd的空间分布规律相似, 绝大多数点位浓度较低, 其中浓度高值点位出现在奉化区、鄞州区西北部和象山县北部, 这可能与象山港中部和北部主要是养殖区和农业区, 水体环境受到人为干扰等因素影响.Zn呈西南向东北递减的趋势, 整体无超标现象, 但在东北低值区出现高值点, 这与当地的工业点源污染有关.Fe在空间上分布较为分散无明显规律, 绝大多数点位都位于4.79~39.34μg·L-1之间, 远低于国家水质标准.其中X23宁海县铁江超国家三类水标准1.94倍, 达到了583.97μg·L-1, 超过流域内平均水平25倍, 出现了异常变化, 可能与宁海县铁江沿岸污染企业的工业排放有关系.As在空间上呈现中心向四周递减的趋势, 整体无超标现象.

|
图内数值单位为μg·L-1 图 3 象山港流域重金属浓度的空间变化 Fig. 3 Spatial variation of heavy metal concentration in the Xiangshan Bay watershed |
为综合全面评价象山港流域内重金属的风险状况, 本文采用3种评价方法:①单因子指数法(Pi), 算法简单明了, 能够反映出单个因子的污染状况. ②内梅罗综合指数法(Pn), 考虑各污染物平均污染水平和最大污染状况. ③重金属污染指数法(HPI), 对各个重金属产生的水质污染影响进行综合评价, 充分考虑每个重金属的毒理学及健康依据.
对象山港流域8种重金属Cr、Mn、Fe、Cu、Zn、As、Cd和Pb计算单因子污染指数, 内梅罗综合污染指数和重金属污染指数(HPI).如图 4所示, 可以发现除Mn和Fe外, 其他元素单因子污染指数远低于1, 处于清洁水平.有研究通过主成分分析(principal component analysis, PCA)、失效分析(failure analysis, FA)和相关性进行分析, 发现长江流域内的Mn主要受自然源影响[50], 结合前文Cr、Mn和Cu空间分布规律相似可以推断象山港的Cu和Mn来自自然源的释放.而从内梅罗综合指数计算得到图 5, 除X12、X22、X26和X52点外其他河流流域均处于无污染水平, 港内环境风险低.值得注意的是, 有研究指出象山港内软体动物和甲壳动物重金属超标, 需要防范港区内重金属在生物体内的富集现象.如表 3所示, 通过重金属污染指数(HPI)计算得到流域内重金属污染水平远低于临界污染指数100.说明流域内重金属风险水平低.但是需要注意的是, 有研究表明港区内沉积物重金属污染达到中等水平[51], 需要警惕港区内沉积物中重金属的释放.

|
图 4 象山港流域重金属的单因子污染指数 Fig. 4 Single factor pollution index of heavy metals in the Xiangshan Bay watershed |

|
图 5 象山港流域内梅罗综合污染指数分布状况 Fig. 5 Distribution of Nemero comprehensive pollution index in the Xiangshan Bay watershed |
|
|
表 3 象山港流域重金属污染指数(HPI)1) Table 3 Heavy metal pollution index of the Xiangshan Bay watershed |
3 讨论 3.1 重金属相关性
Pearson相关性是分析不同重金属之间同源性分析的常用手段, 重金属之间的相关性可以反映象山港流域内不同入海口重金属的来源和迁移特征, 相关性高的重金属之间具有相似的污染源或类似的迁移特征[52].利用统计软件SPSS 25.0进行Pearson相关性分析, 通过表 4发现Cd与Pb、Cu与Mn之间分别存在显著正相关(P < 0.05), 结合上文Pb与Cd, Cr、Mn与Cu的空间分布规律相似, 可以推测Cd与Pb、Cu与Mn可能来自于同样的污染源[53].Cd与Cr存在显著正相关(P < 0.05), Cu与Zn存在极显著正相关(P < 0.01), 但在空间分布规律上并不相似, 因此可以推测Cd与Cr、Cu与Zn之间可能在迁移转化之间相互作用.同时, 8种重金属不存在显著负相关, 说明这8种重金属不存在明显的竞争作用.
|
|
表 4 象山港流域入海河流重金属浓度相关性分析矩阵1) Table 4 Correlation matrix of heavy metal concentrations in the Xiangshan River watershed |
3.2 重金属污染源分析
流域内的土地利用方式的空间变化是导致流域内重金属浓度分布的最主要原因.通过ArcGIS 10.5提取DEM(数字高程模型), 对每条河流的流域进行划分, 结合2017年象山港土地利用方式, 通过分析-提取-裁剪, 得出每个流域内土地利用方式数据, 再通过Canoco5软件将流域内入海河流的重金属浓度作为生物因子, 流域内的土地利用方式作为环境因子(不同土地利用方式是用每种土地利用方式在该流域的面积占比代表)进行冗余分析(redundancy analysis, RDA), 结果见图 6.

|
图 6 象山港流域重金属浓度与土地利用方式的冗余分析(RDA) Fig. 6 Redundancy analysis of heavy metal concentration and land-use pattern in the Xiangshan Bay watershed |
RDA冗余分析9个环境因子变量可解释总变异的79.01%, 其中RDA 1解释了总变异的66.34%, RDA 2解释了总变异的12.67%.重金属Pb和Mn这两个变量的箭头长度长于平均贡献率, 说明这两种重金属对象山港流域内的重金属浓度水平起着重要作用.同时, 森林用地、养殖用地和农业用地与重金属Pb和Zn之间箭头的交角很小, 接近于0, 说明这3种土地利用方式与重金属Pb和Zn相关性最高, 并且养殖和农业对Pb的解释率最高, 因此农业的面源污染是导致水体中溶解态重金属Pb偏高的最主要原因.根据前文分析, 象山港流域内的海水养殖以及茶园与果园的农业种植是导致Pb偏高的人为源.海水养殖所添加的饲料[54], 农业耕作所施用的肥料农药所含的Pb元素随地表径流进入流域内的水体中[55]; 在水体中饲料和化肥的有机质具有大量吸附Pb离子的官能团, 促进水体中有机结合态Pb的形成[56]; 海水环境中的陪伴阴离子(Cl-、SO42-和H2PO4-)释放沉积物中Pb并增加Pb在水中的溶解度[57], 在这3个方面的共同作用下象山港流域内水体中Pb含量升高.
Mn与旅游用地和未利用地这两个变量之间的交角小, 且箭头长度长于平均贡献率, 因此可以推断旅游用地和未利用地是流域内的Mn迁移的重要驱动因素.结合象山港流域内的土地利用类型, 未利用地为空闲地和盐碱地.旅游用地跟未利用地开发程度较小, 人类活动对其的改造程度较低, 较大程度保持了当地原始的自然风貌, 因此可以推断流域内的地质背景是Mn分布的主要原因.降水带来的径流、渗透和搬运以及潮汐对沉积物的规律性扰动是土壤中Mn向水中重金属释放的主要途径[58]. pH、温度和溶解性有机质是影响Mn释放的主要因素, 而象山港内低pH、高温和高溶解性有机质的自然环境推动了Mn的释放[59].因此自然源是港区内重金属Mn偏高的主要原因.
Cu、Fe和As交角接近为0, 呈高度正相关, 说明建设用地和交通用地对Cu、Fe和As的贡献率高并且相关性很强, 而前文中Cu在空间上变化较大, Fe和As空间变化复杂, 符合建设用地和交通用地的重金属污染特征.通过象山港污染源的实地走访调查发现流域内企业无直排现象; 港区以港口为枢纽的交通体系较为发达; 建设用地傍水而建较为分散.而Cu、Fe和As较国家水质标准而言总体浓度水平较低, 且Cu、Fe和As箭头较短对前两轴贡献并不大, 因此推断建设和交通用地所致的重金属随大气干湿沉降进入流域水体, 造成水体中Cu、Fe和As出现污染情况.这两类人类活动并未对流域内的重金属浓度水平造成较大影响.
重金属Cr与采矿用地呈正相关但相关性较高.一方面象山港内的海侵海退的水动力条件以及低山平原的地形条件使得土壤中掩埋的铬渣随着浸出液以Cr6+的形式[60]流入到水体中, 另一方面象山港流域采矿用地在各个区县呈点状分布, 临港工业所需要的铬矿在水运过程中进入水体.因此推断象山港流域内Cr的主要来源是采矿等工业活动[61], 受人为活动影响较大.
结合前文Pearson相关性分析得出, Cu、Mn和Zn这3类重金属的来源是象山港内较小受到的人类活动影响, 因此可以推断这与象山港内的地质背景、象山港打造五处休闲度假旅游区有较大关系.而Cd、Cr和Pb这3类主要来自当地的农业活动所造成的面源污染.
在流域内, As、Pb、Zn和Cd均有高值和低值出现, 总体浓度水平较低, 但分布情况复杂, 区域之间污染状况不同.北仑区的As、Pb、Zn和Cd的分布状况相似, 说明南北两侧As、Pb、Zn和Cd的高值出现是因为相同的污染源, 通过前期对象山港流域的实地调查可以推断可能来自于工业的点源污染.而在象山港的中部(奉化区和宁海县北部), 大片区域中Cd和Pb出现相似的分布特征, 可能来源于当地农业的面源污染[62].结合当地的土地利用类型, 可能是来源于当地海水养殖中饲料的大量使用[63].
4 结论(1) 8种重金属平均浓度的大小顺序为:Fe>Mn>Zn>Cu>As>Cr>Pb>Cd, 对照《地表水环境质量标准(GB 3838-2002)》中的Ⅰ类限值, 除Mn、Fe超过《集中式生活饮用水地表水源地标准》限值, 其他港区内重金属浓度水平较低, 6种重金属均未超标.与宁波市白溪水库的重金属浓度相比, 有沾污现象出现.象山港内的农业面源污染所带来的Pb浓度增加需要引起注意.
(2) 北仑区和象山县的北部以工业的点源沾污为主, 奉化区和宁海县以农业的面源沾污为主, 个别点位出现Mn和Fe的工业点源污染情况.
(3) 单因子污染指数法、内梅罗综合污染指数法和重金属污染指数法多种评价方法的结果显示, 象山港流域内河流中的重金属污染水平低, 水体环境质量较好, 港内流域生态风险小.
(4) 港区内重金属的来源复杂, 主要分为人为源和自然源.Pb和Cd的主要来源是养殖和农业用地; Mn主要来旅游和未利用地; Fe、Zn和As主要来自建设用地和交通运输用地; Cr主要来自于采矿用地.其中农业是象山港流域内重金属浓度高于背景值的最主要原因, 预防和治理象山港流域重金属污染问题应从流域内的农业面源污染抓起.
| [1] | Yu R L, Hu G R, Wang L J. Speciation and ecological risk of heavy metals in intertidal sediments of Quanzhou Bay, China[J]. Environmental Monitoring and Assessment, 2010, 163(1-4): 241-252. DOI:10.1007/s10661-009-0830-z |
| [2] |
李传琼, 王鹏, 陈波, 等. 鄱阳湖流域赣江水系溶解态金属元素空间分布特征及污染来源[J]. 湖泊科学, 2018, 30(1): 139-149. Li C Q, Wang P, Chen B, et al. Spatial distribution and pollution source of dissolved metals in the Ganjiang River of Lake Poyang Basin[J]. Journal of Lake Sciences, 2018, 30(1): 139-149. |
| [3] |
叶艾玲, 程明超, 张璐, 等. 太原市夏季降水中溶解态重金属特征及来源[J]. 环境科学, 2018, 39(7): 3075-3081. Ye A L, Cheng M C, Zhang L, et al. Characteristics and sources of dissolved heavy metals in summer precipitation of Taiyuan City, China[J]. Environmental Science, 2018, 39(7): 3075-3081. |
| [4] | Cao Q Q, Wang H, Li Y R, et al. The national distribution pattern and factors affecting heavy metals in sediments of water systems in China[J]. Soil and Sediment Contamination:An International Journal, 2018, 27(2): 79-97. DOI:10.1080/15320383.2018.1424113 |
| [5] | Lu Q Q, Bian Z F, Tsuchiya N. Hydrotransport-oriented Zn, Cu, and Pb behavior assessment and source identification in the river network of a historically mined Area in the Hokuroku Basin, Northeast Japan[J]. International Journal of Environmental Research and Public Health, 2019, 16(20): 3907. DOI:10.3390/ijerph16203907 |
| [6] | Fang X H, Peng B, Wang X, et al. Distribution, contamination and source identification of heavy metals in bed sediments from the lower reaches of the Xiangjiang River in Hunan province, China[J]. Science of the Total Environment, 2019, 689: 557-570. DOI:10.1016/j.scitotenv.2019.06.330 |
| [7] | Mohammadi M, Darvishan A K, Bahramifar N. Spatial distribution and source identification of heavy metals (As, Cr, Cu and Ni) at sub-watershed scale using geographically weighted regression[J]. International Soil and Water Conservation Research, 2019, 7(3): 308-315. DOI:10.1016/j.iswcr.2019.01.005 |
| [8] | Liu B L, Ma X W, Ai S W, et al. Spatial distribution and source identification of heavy metals in soils under different land uses in a sewage irrigation region, northwest China[J]. Journal of Soils and Sediments, 2016, 16(5): 1547-1556. DOI:10.1007/s11368-016-1351-3 |
| [9] | Das B, Nordin R, Mazumder A. Watershed land use as a determinant of metal concentrations in freshwater systems[J]. Environmental Geochemistry and Health, 2009, 31(6): 595-607. DOI:10.1007/s10653-008-9244-z |
| [10] | Palma P, Ledo L, Alvarenga P. Assessment of trace element pollution and its environmental risk to freshwater sediments influenced by anthropogenic contributions:the case study of Alqueva Reservoir (Guadiana Basin)[J]. CATENA, 2015, 128: 174-184. DOI:10.1016/j.catena.2015.02.002 |
| [11] | Dević G, Sakan S, Dorđević D. Assessment of the environmental significance of nutrients and heavy metal pollution in the river network of Serbia[J]. Environmental Science and Pollution Research, 2016, 23(1): 282-297. DOI:10.1007/s11356-015-5808-5 |
| [12] | Varol M. Assessment of heavy metal contamination in sediments of the Tigris River (Turkey) using pollution indices and multivariate statistical techniques[J]. Journal of Hazardous Materials, 2011, 195: 355-364. DOI:10.1016/j.jhazmat.2011.08.051 |
| [13] | Wang J W, Liu R M, Zhang P P, et al. Spatial variation, environmental assessment and source identification of heavy metals in sediments of the Yangtze River Estuary[J]. Marine Pollution Bulletin, 2014, 87(1-2): 364-373. DOI:10.1016/j.marpolbul.2014.07.048 |
| [14] | Wang T, Yan J J, Ma J L, et al. A fuzzy comprehensive assessment and hierarchical management system for urban lake health:A case study on the lakes in Wuhan city, Hubei province, China[J]. International Journal of Environmental Research and Public Health, 2018, 15(12): 2617. DOI:10.3390/ijerph15122617 |
| [15] |
杨海君, 许云海, 刘亚宾, 等. 湘江流域衡阳水口山段水环境健康风险评估[J]. 环境化学, 2018, 37(9): 2060-2070. Yang H J, Xu Y H, Liu Y B, et al. Environmental health risk assessment of Shuikou Mountain Section of Hengyang in Xiangjiang River Basin[J]. Environmental Chemistry, 2018, 37(9): 2060-2070. |
| [16] | Giri S, Singh A K. Risk assessment, statistical source identification and seasonal fluctuation of dissolved metals in the Subarnarekha River, India[J]. Journal of Hazardous Materials, 2014, 265: 305-314. DOI:10.1016/j.jhazmat.2013.09.067 |
| [17] | Wang X L, Zhang L, Zhao Z H, et al. Heavy metal pollution in reservoirs in the hilly area of southern China:Distribution, source apportionment and health risk assessment[J]. Science of the Total Environment, 2018, 634: 158-169. DOI:10.1016/j.scitotenv.2018.03.340 |
| [18] | Vareda J P, Valente A J M, Durães L. Assessment of heavy metal pollution from anthropogenic activities and remediation strategies:a review[J]. Journal of Environmental Management, 2019, 246: 101-118. DOI:10.1016/j.jenvman.2019.05.126 |
| [19] | Perić M S, Kepčija R M, Miliša M, et al. Benthos-drift relationships as proxies for the detection of the most suitable bioindicator taxa in flowing waters-a pilot-study within a Mediterranean karst river[J]. Ecotoxicology and Environmental Safety, 2018, 163: 125-135. DOI:10.1016/j.ecoenv.2018.07.068 |
| [20] |
于元赫, 吕建树, 王亚梦. 黄河下游典型区域土壤重金属来源解析及空间分布[J]. 环境科学, 2018, 39(6): 2865-2874. Yu Y H, Lü J S, Wang Y M, et al. Source identification and spatial distribution of heavy metals in soils in typical areas around the lower Yellow River[J]. Environmental Science, 2018, 39(6): 2865-2874. |
| [21] | Liu S L, Pan G H, Zhang Y Q, et al. Risk assessment of soil heavy metals associated with land use variations in the riparian zones of a typical urban river gradient[J]. Ecotoxicology and Environmental Safety, 2019, 181: 435-444. DOI:10.1016/j.ecoenv.2019.04.060 |
| [22] | Yuan G L, Liu C, Chen L, et al. Inputting history of heavy metals into the inland lake recorded in sediment profiles:Poyang Lake in China[J]. Journal of Hazardous Materials, 2011, 185(1): 336-345. DOI:10.1016/j.jhazmat.2010.09.039 |
| [23] | Saran L M, Pissarra T C T, Silveira G A, et al. Land use impact on potentially toxic metals concentration on surface water and resistant microorganisms in watersheds[J]. Ecotoxicology and Environmental Safety, 2018, 166: 366-374. DOI:10.1016/j.ecoenv.2018.09.093 |
| [24] | El-Tohamy W S, Abdel-Baki S N, Abdel-Aziz N E, et al. Evaluation of spatial and temporal variations of surface water quality in the Nile River Damietta Branch[J]. Ecological Chemistry and Engineering S, 2018, 25(4): 569-580. DOI:10.1515/eces-2018-0038 |
| [25] | Wang X Y, Zhao L L, Xu H Z, et al. Spatial and seasonal characteristics of dissolved heavy metals in the surface seawater of the Yellow River Estuary, China[J]. Marine Pollution Bulletin, 2018, 137: 465-473. DOI:10.1016/j.marpolbul.2018.10.052 |
| [26] | Zhang J B, Zhou F X, Chen C L, et al. Spatial distribution and correlation characteristics of heavy metals in the seawater, suspended particulate matter and sediments in Zhanjiang Bay, China[J]. PLoS One, 2018, 13(8): e0201414. DOI:10.1371/journal.pone.0201414 |
| [27] | Bo W J, Wang X K, Zhang Q Q, et al. Influence of land use and point source pollution on water quality in a developed region:A case study in Shunde, China[J]. International Journal of Environmental Research and Public Health, 2018, 15(1): 51. DOI:10.3390/ijerph15010051 |
| [28] | Xu Q Q, Zhang C, Liang L, et al. Transport dynamics of mercury in rainfall-runoff after summer drought in a small agricultural watershed in the Three Gorges Reservoir region[J]. Bulletin of Environmental Contamination and Toxicology, 2019, 102(5): 679-685. DOI:10.1007/s00128-019-02600-6 |
| [29] | Kotková K, Nováková T, Tůmová Š, et al. Migration of risk elements within the floodplain of the Litavka River, the Czech Republic[J]. Geomorphology, 2019, 329: 46-57. DOI:10.1016/j.geomorph.2018.12.010 |
| [30] | Zhang L X, Zhao B, Xu G, et al. Characterizing fluvial heavy metal pollutions under different rainfall conditions:Implication for aquatic environment protection[J]. Science of the Total Environment, 2018, 635: 1495-1506. DOI:10.1016/j.scitotenv.2018.04.211 |
| [31] |
舒心, 李艳, 李锋, 等. 土壤重金属累积对土地利用与景观格局的响应[J]. 环境科学, 2019, 40(5): 2471-2482. Shu X, Li Y, Li F, et al. Impacts of land use and landscape patterns on heavy metal accumulation in soil[J]. Environmental Science, 2019, 40(5): 2471-2482. |
| [32] | Fernandes A C P, Fernandes L F S, Cortes R M V, et al. The role of landscape configuration, season, and distance from contaminant sources on the degradation of stream water quality in urban catchments[J]. Water, 2019, 11(10): 2025. DOI:10.3390/w11102025 |
| [33] | Gholizadeh M H, Melesse A M, Reddi L. Water quality assessment and apportionment of pollution sources using APCS-MLR and PMF receptor modeling techniques in three major rivers of South Florida[J]. Science of the Total Environment, 2016, 566-567: 1552-1567. DOI:10.1016/j.scitotenv.2016.06.046 |
| [34] | Simeonov V, Stratis J A, Samara C, et al. Assessment of the surface water quality in Northern Greece[J]. Water Research, 2003, 37(17): 4119-4124. DOI:10.1016/S0043-1354(03)00398-1 |
| [35] | Feng B X, Li J L, He G L, et al. Research on changes of coastal land use intensity in bay area during past 30 years-A case study of Xiangshan Bay[J]. Marine Science Bulletin, 2018, 20(2): 28-43. |
| [36] | Liu Q, Xu X Q, Zeng J N, et al. Heavy metal concentrations in commercial marine organisms from Xiangshan Bay, China, and the potential health risks[J]. Marine Pollution Bulletin, 2019, 141: 215-226. DOI:10.1016/j.marpolbul.2019.02.058 |
| [37] | Grimm N B, Foster D, Groffman P, et al. The Changing landscape:ecosystem responses to urbanization and pollution across climatic and societal gradients[J]. Frontiers in Ecology and the Environment, 2008, 6(5): 264-272. DOI:10.1890/070147 |
| [38] | Gessner M O, Hinkelmann R, Nützmann G, et al. Urban water interfaces[J]. Journal of Hydrology, 2014, 514: 226-232. DOI:10.1016/j.jhydrol.2014.04.021 |
| [39] | Zhao B F, Wang X M, Jin H B, et al. Spatiotemporal variation and potential risks of seven heavy metals in seawater, sediment, and seafood in Xiangshan Bay, China (2011-2016)[J]. Chemosphere, 2018, 212: 1163-1171. DOI:10.1016/j.chemosphere.2018.09.020 |
| [40] |
曹欣中, 唐龙妹, 张月秀. 象山港水文特征及纳污能力的分析[J]. 东海海洋, 1995(1): 10-19. Cao X Z, Tang L M, Zhang Y X. Analyses of the hydrography features and the ability for containing contaminator for port Xiangshan[J]. Donghai Marine Science, 1995(1): 10-19. |
| [41] |
袁麒翔, 李加林, 徐谅慧, 等. 象山港流域河流形态特征定量分析[J]. 海洋学研究, 2014, 32(3): 50-57. Yuan Q X, Li J L, Xu L H, et al. Quantitative analysis of river morphological features in Xiangshan Bay Basin[J]. Journal of Marine Sciences, 2014, 32(3): 50-57. DOI:10.3969/j.issn.1001-909X.2014.03.007 |
| [42] | Ye C, Xu Q J, Kong H N, et al. Eutrophication conditions and ecological status in typical bays of Lake Taihu in China[J]. Environmental Monitoring and Assessment, 2007, 135(1-3): 217-225. DOI:10.1007/s10661-007-9644-z |
| [43] | Zeng X X, Liu Y G, You S H, et al. Spatial distribution, health risk assessment and statistical source identification of the trace elements in surface water from the Xiangjiang River, China[J]. Environmental Science and Pollution Research, 2015, 22(12): 9400-9412. DOI:10.1007/s11356-014-4064-4 |
| [44] | Li J L, Liu Y C, Pu R L, et al. Coastline and landscape changes in bay areas caused by human activities:A comparative analysis of Xiangshan Bay, China and Tampa Bay, USA[J]. Journal of Geographical Sciences, 2018, 28(8): 1127-1151. DOI:10.1007/s11442-018-1546-1 |
| [45] |
黄秀清, 陈琴, 姚炎明, 等. 港湾海洋环境监测站位布设方法研究——以象山港为例[J]. 海洋学报, 2015, 37(1): 158-170. Huang X Q, Chen Q, Yao Y M, et al. The setting method of harbour marine environment monitoring station-A case study in Xiangshan Bay[J]. Haiyang Xuebao, 2015, 37(1): 158-170. DOI:10.3969/j.issn.0253-4193.2015.01.016 |
| [46] |
孙清展, 臧淑英. 水体重金属污染评价方法对比研究——以扎龙湿地湖水为例[J]. 农业环境科学学报, 2012, 31(11): 2242-2248. Sun Q Z, Zang S Y. Pollution evaluation and forecast of heavy mental in lake of Zhalong Wetland, China[J]. Journal of Agro-Environment Science, 2012, 31(11): 2242-2248. |
| [47] | Prasad B, Bose J. Evaluation of the heavy metal pollution index for surface and spring water near a limestone mining area of the lower Himalayas[J]. Environmental Geology, 2001, 41(1-2): 183-188. DOI:10.1007/s002540100380 |
| [48] |
马明真, 高扬, 宋贤威, 等. 鄱阳湖地区多尺度流域水体重金属输送特征及其污染风险评价[J]. 生态学报, 2019, 39(17): 6404-6415. Ma M Z, Gao Y, Song X W, et al. Transport characteristics and risk assessment of heavy metals in multi-scale watersheds in the Poyang Lake area, China[J]. Acta Ecologica Sinica, 2019, 39(17): 6404-6415. |
| [49] |
李健, 曾北危, 姚岳云, 等. 洞庭湖水系水体环境背景值调查研究[J]. 环境科学, 1986, 7(4): 62-68, 104. Li J, Zeng B W, Yao Y Y, et al. Studies on environmental background levels in water of Dongting Lake system[J]. Environment Science, 1986, 7(4): 62-68, 104. |
| [50] | Li S Y, Zhang Q F. Spatial characterization of dissolved trace elements and heavy metals in the upper Han River (China) using multivariate statistical techniques[J]. Journal of Hazardous Materials, 2010, 176(1-3): 579-588. DOI:10.1016/j.jhazmat.2009.11.069 |
| [51] | 李冬玲.象山港海域水质与沉积物主要污染因子及污染源分析[A].见: 浙江省地理学会2016年学术年会暨浙江省第三届地理名师名校长联盟高峰论坛: 论文摘要集[C].金华: 浙江省地理学会, 2016. |
| [52] |
吕伟伟, 姚昕, 张保华, 等. 基于地统计学分析的太湖颗粒态和溶解态氮、磷营养盐时空分布特征及来源分析[J]. 环境科学, 2019, 40(2): 590-602. Lü W W, Yao X, Zhang B H, et al. Temporal-spatial distribution of nitrogen and phosphorus nutrients in lake Taihu based on geostatistical analysis[J]. Environmental Science, 2019, 40(2): 590-602. |
| [53] | Zhang Y N, Chu C L, Li T, et al. A water quality management strategy for regionally protected water through health risk assessment and spatial distribution of heavy metal pollution in 3 marine reserves[J]. Science of the Total Environment, 2017, 599-600: 721-731. DOI:10.1016/j.scitotenv.2017.04.232 |
| [54] | Kang J H, Lee S W, Cho K H, et al. Linking land-use type and stream water quality using spatial data of fecal indicator bacteria and heavy metals in the Yeongsan river basin[J]. Water Research, 2010, 44(14): 4143-4157. DOI:10.1016/j.watres.2010.05.009 |
| [55] | 廖建波.流域复合环境系统中重金属的归趋与综合风险评价[D].广州: 华南理工大学, 2016. 111-116. |
| [56] | Liao J B, Chen J, Ru X, et al. Heavy metals in river surface sediments affected with multiple pollution sources, South China:distribution, enrichment and source apportionment[J]. Journal of Geochemical Exploration, 2017, 176: 9-19. DOI:10.1016/j.gexplo.2016.08.013 |
| [57] | Wang C, Wang J H, Zhao Y P, et al. The vertical migration and speciation of the Pb in the paddy soil:a case study of the Yangtze River Delta, China[J]. Environmental Research, 2019, 179: 108741. DOI:10.1016/j.envres.2019.108741 |
| [58] | Springborn M, Singer M B, Dunne T. Sediment-adsorbed total mercury flux through yolo bypass, the primary floodway and wetland in the Sacramento Valley, California[J]. Science of the Total Environment, 2011, 412-413: 203-213. DOI:10.1016/j.scitotenv.2011.10.004 |
| [59] | 陈蕾.水库沉积物-水界面锰迁移与转化行为研究[D].青岛: 中国海洋大学, 2015. 106-129. |
| [60] | Sarangi A, Krishnan C. Comparison of in vitro Cr(Ⅵ) reduction by CFEs of chromate resistant bacteria isolated from chromate contaminated soil[J]. Bioresource Technology, 2008, 99(10): 4130-4137. DOI:10.1016/j.biortech.2007.08.059 |
| [61] | Aykol A, Budakoglu M, Kumral M, et al. Heavy metal pollution and acid drainage from the abandoned Balya Pb-Zn sulfide Mine, NW Anatolia, Turkey[J]. Environmental Geology, 2003, 45(2): 198-208. DOI:10.1007/s00254-003-0866-2 |
| [62] | Murray K S, Rogers D T, Kaufman M M. Heavy metals in an urban watershed in southeastern Michigan[J]. Journal of Environmental Quality, 2004, 33(1): 163-172. |
| [63] |
张伟杰, 殷淑华, 徐东昱, 等. 三峡库区沉积物中镍污染特征评价[J]. 环境科学, 2018, 39(12): 5464-5472. Zhang W J, Yin S H, Xu D Y, et al. Pollution characteristic of Ni in sediments in the Three Gorges Reservoir[J]. Environmental Science, 2018, 39(12): 5464-5472. |