 2020, Vol. 41

2. 中国地质大学(武汉), 生物地质与环境地质国家重点实验室, 武汉 430074
 , KONG Shao-fei1
 , YAN Qin1 , ZHENG Shu-rui1 , ZHENG Huang1 , ZENG Xin1 , YAO Li-quan1 , WU Jian1 , ZHANG Ying1 , WU Fang-qi1 , CHENG Yi1 , QIN Si1 , LIU Xi1 , YAN Ying-ying1 , QI Shi-hua1,2
2. State Key Laboratory of Biogeology and Environmental Geology, China University of Geosciences, Wuhan 430074, China
挥发性有机物(volatile organic compounds, VOCs)对大气复合污染的形成具有重要作用, 是形成PM2.5和O3的重要前体物质[1, 2], 也可导致大气氧化性增强[3~5].多种VOCs组分是有毒有害物质, 能够直接或间接影响人体健康[6~8].如苯、甲苯和对-二甲苯会导致严重的神经或心脏疾病[9], 已被世界卫生组织国际癌症研究机构列为致癌物质.
Xu等[10]结合探空观测数据、化学传输模型和拉格朗日扩散模型, 证明了生物质燃烧是影响中国东部长三角地区O3污染的重要来源[11~13].钟方潜等[14]通过WRF-Chem模拟发现, 秸秆焚烧释放的大量VOCs导致了O3浓度上升.也有研究表明, 野火排放的VOCs含有非常高比例的含氧VOCs, 影响光化学反应[15].因此, 研究生物质燃烧的VOCs排放特征对于理解其大气化学过程和环境、健康效应具有重要意义.
当前全球约有30亿人仍在使用低效且高污染的炉具燃烧固体燃料以获取能源[16].在低效炉灶中燃烧木材和稻草等生物质燃料产生多种有害污染物, 包括颗粒物、甲烷、一氧化碳、多环芳烃和挥发性有机化合物[17].近年来生物质燃烧排放VOCs的组成特征受到广泛关注[18, 19].源解析结果显示, 生物质燃烧是VOCs的重要排放源, 约占VOCs的9.5%~17.7%[20~23].在源解析过程中, 实测的VOCs源成分谱仍很缺乏, 亟需开展深入研究.
前人对于生物质燃烧VOCs排放特征进行了初步研究.主要研究对象多集中于玉米秸秆[18]、稻草[24]和小麦秸秆[21]等燃料燃烧排放烟气的挥发性有机物组成; 还有部分研究关注高粱秸秆[24]、甘蔗叶[19]、花生壳[18]、大豆秆[18]和油菜秆[18]等烟气排放特征.但是当前研究对农村仍普遍使用的经济作物秸秆燃烧排放VOCs的研究仍略显不足.对于薪柴类生物质, 大多数研究仅对木柴[18, 21, 25]燃烧进行挥发性有机物成分特征研究.有研究表明, 松木、橡木和桉树燃烧排放VOCs中最丰富的物种是乙烯, 其次是乙烷和乙炔; 苯是主要的芳香化合物[25], 栗树枝的含氧有机物所占质量分数(52.7%)远高于桃树枝(15.3%)和松木(16.5%)[26].不同类型的薪柴燃烧具有不同的挥发性有机物成分谱, 因此需要考虑不同类型薪柴燃烧排放挥发性有机物的差异.
生物质燃烧排放产生的挥发性有机物中, 苯、1, 3-丁二烯、乙烯、乙炔、丙烷和丙烯等是中国生物质燃烧排放的非甲烷总烃的主要成分[27, 28].Wang等[24]对稻草、玉米秸秆、小麦秸秆和高粱秸秆燃烧后的烟气进行分析, 发现羰基化合物占总VOCs的33.0%.Zhang等[19]的研究发现稻草和甘蔗叶燃烧产生的VOCs中, 丙酮和乙醛是主要含氧VOCs物种.Liu等[21]的研究发现小麦秸秆、玉米秸秆和木柴燃烧排放的VOC物种中, 氯甲烷是生物质燃烧的典型物种.Wang等[18]通过稀释通道对稻草、小麦秸秆、大豆秆、油菜秆和木柴燃烧进行研究表明, 烯烃和含氧VOCs对臭氧生成潜势的贡献最大.由此可见, 不同类型的生物质燃料燃烧排放VOCs的关键物种组分存在差异, 卤代烃和含氧VOCs需引起更多关注.
综上, 本研究选择典型的经济作物及薪柴, 基于室内模拟燃烧和稀释通道采样系统, 对其排放的102种挥发性有机物的组成特征进行分析, 更新生物质燃烧排放的挥发性有机物成分谱和比值, 以期为受体模型源解析和VOCs组分清单构建提供基础数据支撑.
1 材料与方法 1.1 样品来源本实验过程中, 共选取9种燃料, 包括3种薪柴, 分别为白杨树、杉木和柑橘枝; 6种经济农作物燃料, 分别为黄豆秆、芝麻秆、玉米棒、棉花秆、花生秆和玉米秆, 以上燃料于湖北省若干地市的农户家中收集.燃烧炉为常见的民用炉具, 外径30 cm, 内径12 cm, 高43 cm.
1.2 实验流程本研究采用芬兰DEKATI公司的超细颗粒物稀释系统(Fine Particle Sampler, FPS), 对烟气进行稀释和采样, 稀释通道系统结构见文献[29].模拟农户燃烧方式将燃料(每次实验, 取薪柴类燃料4 kg, 秸秆类燃料约100 g)放入炉具点燃后开始采样, 等燃料燃烧完毕, 采样结束, 采样时长为15~25 min.炉具底部放置一台电子秤, 实时记录燃料质量变化.使用采样枪在距火苗1.5 m处将燃烧排放的烟气抽进稀释系统, 干洁空气被空压机送入稀释舱与烟气进行混合稀释, 稀释倍数为30倍.烟气稀释后, 通过4 L的Tedlar袋对烟气进行采集, 每种燃料燃烧至少3次, 采集3个平行样.采样流量控制为150 mL·min-1, 并于24 h内完成检测分析.为了避免采样袋吸附对后续实验干扰, 所有采样袋均不重复使用.
1.3 样品分析采用US EPA推荐的TO-15方法及PAMS方法对VOCs气体组分进行分析.通过Agilent 7820A/5977E气相色谱/质谱联用法进行分析检测.色谱配备有FID检测器, 定量分析所使用的标气来自于Spectra Gas, 检测C2~C12的102种VOCs组分, 详细组分和对应的检出限见表 1.
|
|
表 1 检测的102种VOCs组分1) Table 1 Detected 102 VOCs species |
样品进入色谱柱前通过冷阱预浓缩仪进行前处理.首先从气袋中抽取300 mL气体进入冷阱, 去除其中的水和CO2, 然后以氦气作为载气将浓缩后的气体送入气相色谱, 通过色谱柱的气体分两路, 一路通过FID检测器, 进行检测分析, 另一路进入MS检测分析.
气相色谱操作条件为:色谱柱BD-624 (60 m×0.25 mm×1.4 μm), 起始温度为35℃, 保持3 min, 然后以6℃·min-1的速率升温到180℃.进样口温度为200℃, 载气流量为1.0 mL·min-1, FID检测器的温度为200℃.质谱条件为:使用EI电离方式, 电子能量为70 eV, 离子源温度为230℃, 四级杆温度为150℃, 辅助加热温度为200℃.目标化合物根据保留时间和质谱来确认, 浓度通过内标法计算.
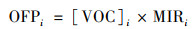
1.4 臭氧生成潜势计算为了评价燃料燃烧排放VOCs生成臭氧的潜势, 采用增量反应活性指标的方法[30].公式如下:
|
式中, OFPi是VOCs物种i的臭氧生成潜势, μg·m-3; MIRi为VOCs物种i在臭氧最大增量反应中的臭氧生成系数, g·g-1; [VOC]i是实际观测中VOCs物种i的浓度, μg·m-3.
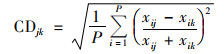
1.5 分歧系数计算不同燃料排放产生的挥发性有机物组分各不相同, 采用分歧系数(CDjk)确定各燃料燃烧排放102种VOCs组分成分谱的相似程度.公式计算如下:
|
式中, P是化学组分的数量; xij是第j种燃料的第i种组分的浓度; j和k是不同的燃料.如果两种燃料的化学组分非常相似, CD值则趋近于0, 否则趋近于1.
2 结果与讨论 2.1 VOCs组成特征根据化学结构, 把VOCs分为7类:烷烃、烯烃、炔烃、卤代烃、芳香烃、含氧VOCs和乙腈. 9种燃料燃烧排放的VOCs物种组成如图 1所示.

|
图 1 民用生物质燃料燃烧VOCs物种组成特征 Fig. 1 VOCs composition characteristics of domestic biomass fuels combustion |
薪柴类燃料燃烧排放的VOCs中, 白杨树和杉木相同VOCs组分所占比例具有一致性, 柑橘枝组分比例差异则与其余两种燃料不同.烯烃质量分数排序为白杨树(37.2%)>杉木(35.4%)>柑橘枝(12.5%), 芳香烃质量分数排序为柑橘枝(53.3%)>白杨树(9.3%)>杉木(6.8%).杉木中炔烃的质量分数最大, 达到4.4%. 3种薪柴(白杨树、杉木、柑橘枝)的含氧VOCs质量分数分别为12.5%、13.3%和10.5%, 卤代烃的质量分数分别为17.7%、24.3%和11.5%.本研究得到的含氧VOCs占比低于工业锅炉木柴燃烧的33.0%[32], 低于荔枝树的52.7%, 但是桃树枝(15.3%)和松木(16.5%)的含氧VOCs质量分数和本研究大致相同[26].
6种经济类燃料燃烧排放的VOCs成分差异明显.玉米秆与花生秆排放VOCs中, 玉米秆芳香烃质量分数(35.1%)小于花生秆(49.6%); 黄豆秆中卤代烃所占比例最大(27.3%), 烷烃、烯烃和含氧VOCs所占比重大小类似, 占比为18.0%~22.2%;芝麻秆、玉米棒和棉花秆的各类VOCs组成具有一致性.花生秆各组分质量分数为:芳香烃(49.6%)>烯烃(15.5%)>烷烃(13.3%)>卤代烃(10.3%)>含氧VOCs(9.4%)>乙腈(1.1%)>炔烃(0.9%).莫梓伟[27]等在研究中提到, 醛酮类组分也是生物质燃料的重要组成部分, 在本研究中, 含氧VOCs所占比例为9.4%~26.5%.
2.2 VOCs成分谱组成及相似性比较如图 2所示, 薪柴类物质燃烧排放的102种VOCs中, 白杨树燃烧排放的烷烃类主要组分为乙烷(11.1%), 烯烃类主要组分为反-2-戊烯(15.4%)和乙烯(8.3%), 主要的卤代烃类物质则为二氯甲烷(11.9%).杉木燃烧排放的VOCs中, 乙烷(5.4%)、乙烯(12.0%)、反-2-戊烯(8.7%)和氟利昂114(8.7%)质量分数较大.甲苯(49.8%)是柑橘枝燃烧排放的VOCs含量最丰富的物种.

|
VOCs组分编号见表 1 图 2 民用生物质燃料燃烧排放VOCs成分谱组成 Fig. 2 Source profile of VOCs from domestic biomass fuel combustion |
6种农业经济类燃料燃烧排放的VOCs各组分中, 玉米棒、棉花秆、芝麻秆和黄豆秆之间的分歧系数均小于0.2(表 2), 具有相似的VOCs源成分组成特征.乙烯是重要的组成部分, 质量分数为11.8%~17.5%, 其次是丙酮(9.2%~14.7%).黄豆秆燃烧排放VOCs中氟利昂114的质量分数为8.8%, 其他经济作物燃烧排放VOCs中氟利昂114质量分数较低.玉米秆和花生秆的VOCs成分谱分歧系数为0.04, 玉米秆和柑橘枝的VOCs成分谱分歧系数为0.09, 花生秆和柑橘枝的VOCs成分谱分歧系数为0.07.因此玉米秆、花生秆和柑橘枝的VOCs源成分谱组成相似, 其中甲苯的质量分数较高, 分别占总VOCs质量的30.3%、44.8%和49.8%, 且含有少量的丙酮(4.7%~6.0%)和反-2-戊烯(5.3%~11.0%).
|
|
表 2 各生物质燃料产生挥发性有机物成分谱的分歧系数 Table 2 Different coefficients of VOCs of burning of different biomass fuels |
乙腈和氯甲烷为生物质燃烧排放的VOCs标识组分[33, 34], 在本研究中所占比重较低, 占总VOCs质量的0.3%~2.6%和0.004%~4.3%.本研究中, 苯和甲苯二者所占比例较大, 占总VOCs质量的1.4%~4.2%和2.0%~49.8%, 与Liu等[21]的研究结果一致.Tsai等[28]的研究表明, 与其他燃料相比, 木柴燃料燃烧产生更多的苯; 致癌物质1, 3-丁二烯在生物质燃烧中也占有一定比例.Wang等[18]的研究表明, 玉米秸秆和花生壳以及白杨树等生物质燃烧过程中, 1, 3-丁二烯占VOCs排放量的0.6%.本研究中, 玉米秆、花生秆和柑橘枝燃烧产生的挥发性有机物中1, 3-丁二烯所占比例较低, 仅为0.02%~0.03%, 白杨树为0.2%, 而杉木、芝麻秆、玉米棒和棉花秆所占比例分别为2.5%、1.5%、3.1%和3.0%.由此可见, 不同的研究, VOCs组分占比存在较大差异, 这与燃料类型、燃烧状态、采样和分析方法都有关系, 需要开展更多的研究, 完善VOCs成分谱数据库.
有研究认为, 苯、乙烯和乙炔主要来自于机动车尾气的排放[35, 36].苯系物也是溶剂使用过程中产生的重要VOCs组分, 占50.0%以上; 含氧VOCs所占的比重达到30.0%以上, 仅次于苯系物[27].制鞋行业由于涂装阶段使用挥发性极强的清漆, 产生的苯和甲苯是主要的芳香烃物质, 分别占芳香烃总量的的55.8%和36.4%[37].但本研究发现, 生物质燃烧同样会产生一定量的苯、甲苯、乙烯和含氧VOCs等挥发性有机物, 意味着在源解析过程中, 如果观测点位周边或观测时段有明显的生物质燃烧有关的排放, 在估算机动车或工业源等对大气环境中挥发性有机物的贡献时, 结果会产生较大偏差或不确定性.
2.3 特征比值一些特定VOCs组分的比值常用来识别VOCs的不同来源[21], 对于生物质燃烧, 常用苯/甲苯比值和乙炔/乙烷比值来识别生物质燃烧源[33].本研究中, 生物质燃烧排放的苯/甲苯比值范围为0.03~2.09, 其中花生秆的苯/甲苯比值为0.03(< 1), 而芝麻秆的苯/甲苯比值为2.09(>1).从表 3可以看出, 甘蔗叶和稻草的苯/甲苯比值均小于1.本研究和文献中报道的生物质燃烧排放苯/甲苯比值范围是0.03~6.48.因此在进行VOCs来源解析时, 单纯使用苯/甲苯比值大于1就认定为受生物质燃烧排放影响[26]是有待商榷的.
|
|
表 3 苯/甲苯与各种研究结果的对比 Table 3 Comparison of benzene/toluene with other studies |
此外, 还有不少的挥发性有机物组分比值常被用于大气中VOCs的来源解析.例如, 用丙烷/苯比率表明汽油排放(比率 < 1)或天然气体或LPG(比率>1)的影响[38]; 使用异戊烷/正戊烷的比值来区分来源:2.20~3.80范围内代表车辆排放, 而较低比例代表(0.56~0.80)煤燃烧的影响[39]; 使用间/对-二甲苯与乙苯的比值和间/对-二甲苯与苯的比值作为光化学年龄的指标, 远距离传输的气团具有较低的比值, 反之来自本地的排放具有较高的比值[40].本研究得到的生物质燃烧排放丙烷/苯、异戊烷/正戊烷、间/对-二甲苯与乙苯的比值和间/对-二甲苯与苯的比值范围分别为0.01~5.77、0.83~35.69、2.09~2.89和0.30~1.36, 这些数据可为重新认识上述比值法定性判断VOCs来源和大气老化过程提供参考.
2.4 臭氧生成潜势分析饱和有机化合物, 如烷烃, 通常比烯烃和芳香族化合物的MIR值低, 而烯烃和芳香族化合物在形成臭氧方面更活跃[28].从图 3可以看出, 烯烃、含氧VOCs和芳香烃对OFP的贡献较大, 分别为30.6%~80.3%、6.5%~21.0%和3.8%~56.5%.从图 4可以看出, 本研究中, 对臭氧生成潜势贡献超过10%的组分有:乙烯、丙烯、反-2-戊烯、顺-2-戊烯、甲苯和丙醛.李兴华等[34]对秸秆和白杨树燃烧产生的VOCs研究发现, 臭氧生成潜势比例较高的物种分别为:醛类、芳香烃和烯烃/炔烃, 这和本文的研究结果具有一致性.

|
图 3 不同燃料燃烧排放挥发性有机物的臭氧生成潜势 Fig. 3 Ozone formation potential of VOCs from combustion of different fuels |

|
图 4 各燃料燃烧排放VOCs对臭氧生成潜势贡献最大的前10种组分 Fig. 4 Top 10 components that contribute the most to the ozone formation potential of VOCs from each fuel combustion |
(1) 不同类型的生物质燃烧排放的VOCs组分存在差异, 白杨树和杉木燃烧排放的烯烃质量分数为37.2%和35.4%, 高于柑橘枝(12.5%).玉米秆芳香烃质量分数(35.1%)小于花生秆(49.6%), 黄豆秆中卤代烃所占比例最大(27.3%).芝麻秆、玉米棒和棉花秆的各类VOCs组成具有一致性.
(2) 乙烷(11.1%), 反-2-戊烯(15.4%)、乙烯(8.3%)和二氯甲烷(11.9%)是白杨树和杉木燃烧排放的主要VOCs组分, 甲苯是柑橘枝燃烧排放的VOCs中含量最丰富的物种.乙烯(11.8%~17.5%)和丙酮(9.2%~14.7%)是秸秆类燃料燃烧的主要VOCs组分.玉米秆、花生秆和柑橘枝具有相似的VOCs源成分谱, 成分谱分歧系数小于0.1.
(3) 本研究和已有报道中的生物质燃烧排放苯/甲苯比值范围是0.030~6.48;在开展源解析研究中, 采用苯/甲苯比值大于1认定为受到生物质燃烧排放影响值得商榷.
(4) 烯烃、含氧VOCs和芳香烃对臭氧生成潜势的贡献较大, 分别为30.6%~80.3%、6.5%~21.0%和3.8%~56.5%.对臭氧生成潜势贡献超过10.0%的组分有:乙烯、丙烯、反-2-戊烯、顺-2-戊烯、甲苯和丙醛.
| [1] | Zhang Y H, Su H, Zhong L J, et al. Regional ozone pollution and observation-based approach for analyzing ozone-precursor relationship during the PRIDE-PRD2004 campaign[J]. Atmospheric Environment, 2008, 42(25): 6203-6218. DOI:10.1016/j.atmosenv.2008.05.002 |
| [2] | Baldasano J M, Delgado R, Calbó J. Applying receptor models to analyze urban/suburban VOCs air quality in Martorell (Spain)[J]. Environmental Science & Technology, 1998, 32(3): 405-412. |
| [3] |
王扶潘, 朱乔, 冯凝, 等. 深圳大气中VOCs的二次有机气溶胶生成潜势[J]. 中国环境科学, 2014, 34(10): 2449-2457. Wang F P, Zhu Q, Feng N, et al. The generation potential of secondary organic aerosol of atmospheric VOCs in Shenzhen[J]. China Environmental Science, 2014, 34(10): 2449-2457. |
| [4] | Nguyen K, Dabdub D. NOx and VOC control and its effects on the formation of aerosols[J]. Aerosol Science and Technology, 2002, 36(5): 560-572. DOI:10.1080/02786820252883801 |
| [5] |
郭松, 胡敏, 尚冬杰, 等. 基于外场观测的大气二次有机气溶胶研究[J]. 化学学报, 2014, 72(2): 145-157. Guo S, Hu M, Shang D J, et al. Research on secondary organic aerosols basing on field measurement[J]. Acta Chimica Sinica, 2014, 72(2): 145-157. |
| [6] | Srivastava A. Source apportionment of ambient VOCs in Mumbai City[J]. Atmospheric Environment, 2004, 38(39): 6829-6843. DOI:10.1016/j.atmosenv.2004.09.009 |
| [7] | Srivastava A, Joseph A E, Patil S, et al. Air toxics in ambient air of Delhi[J]. Atmospheric Environment, 2005, 39(1): 59-71. DOI:10.1016/j.atmosenv.2004.09.053 |
| [8] | Choi E, Choi K, Yi S M. Non-methane hydrocarbons in the atmosphere of a Metropolitan city and a background site in South Korea:sources and health risk potentials[J]. Atmospheric Environment, 2011, 45(40): 7563-7573. DOI:10.1016/j.atmosenv.2010.11.049 |
| [9] | Bari A, Kindzierski W B. Ambient volatile organic compounds (VOCs) in Calgary, Alberta:sources and screening health risk assessment[J]. Science of the Total Environment, 2018, 631-632: 627-640. DOI:10.1016/j.scitotenv.2018.03.023 |
| [10] | Xu Z N, Huang X, Nie W, et al. Impact of biomass burning and vertical mixing of residual-layer aged plumes on ozone in the Yangtze River Delta, China:a tethered-balloon measurement and modeling study of a multiday ozone episode[J]. Journal of Geophysical Research:Atmospheres, 2018, 123(20): 11786-11803. DOI:10.1029/2018JD028994 |
| [11] | Chen J M, Li C L, Ristovski Z, et al. A review of biomass burning:emissions and impacts on air quality, health and climate in China[J]. Science of the Total Environment, 2017, 579: 1000-1034. DOI:10.1016/j.scitotenv.2016.11.025 |
| [12] | Ding A J, Wang T, Fu C B. Transport characteristics and origins of carbon monoxide and ozone in Hong Kong, South China[J]. Journal of Geophysical Research:Atmospheres, 2013, 118(16): 9475-9488. DOI:10.1002/jgrd.50714 |
| [13] | Huang X, Ding A J, Liu L X, et al. Effects of aerosol-radiation interaction on precipitation during biomass-burning season in East China[J]. Atmospheric Chemistry and Physics, 2016, 16(15): 10063-10082. DOI:10.5194/acp-16-10063-2016 |
| [14] |
钟方潜, 苏琪骅, 周任君, 等. 秸秆焚烧对区域城市空气质量影响的模拟分析[J]. 气候与环境研究, 2017, 22(2): 149-161. Zhong F Q, Su Q H, Zhou R J, et al. Impact of crop straw burning on urban air quality based on WRF-Chem simulations[J]. Climatic and Environmental Research, 2017, 22(2): 149-161. |
| [15] | Akagi S K, Yokelson R J, Wiedinmyer C, et al. Emission factors for open and domestic biomass burning for use in atmospheric models[J]. Atmospheric Chemistry and Physics, 2011, 11(9): 4039-4072. DOI:10.5194/acp-11-4039-2011 |
| [16] | World Health Organization (WHO). WHO Guidelines for indoor air quality: household fuel combustion[EB/OL]. https://www.who.int/airpollution/guidelines/household-fuel-combustion/en/, 2014-11-12. |
| [17] | World Health Organization (WHO). Household air pollution: health impacts[EB/OL]. https://www.who.int/airpollution/household/health-impacts/en/, 2014. |
| [18] | Wang Q, Geng C M, Lu S H, et al. Emission factors of gaseous carbonaceous species from residential combustion of coal and crop residue briquettes[J]. Frontiers of Environmental Science & Engineering, 2013, 7(1): 66-76. |
| [19] | Zhang Y S, Shao M, Lin Y, et al. Emission inventory of carbonaceous pollutants from biomass burning in the Pearl River Delta Region, China[J]. Atmospheric Environment, 2013, 76: 189-199. DOI:10.1016/j.atmosenv.2012.05.055 |
| [20] | Wang Q Q, Shao M, Liu Y, et al. Impact of biomass burning on urban air quality estimated by organic tracers:Guangzhou and Beijing as cases[J]. Atmospheric Environment, 2007, 41(37): 8380-8390. DOI:10.1016/j.atmosenv.2007.06.048 |
| [21] | Liu Y, Shao M, Lu S H, et al. Source apportionment of ambient volatile organic compounds in the Pearl River Delta, China:Part II[J]. Atmospheric Environment, 2008, 42(25): 6261-6274. DOI:10.1016/j.atmosenv.2008.02.027 |
| [22] | Yuan B, Liu Y, Shao M, et al. Biomass burning contributions to ambient VOCs species at a receptor site in the Pearl River Delta (PRD), China[J]. Environmental Science & Technology, 2010, 44(12): 4577-4582. |
| [23] | Zheng M, Wang F, Hagler G S W, et al. Sources of excess urban carbonaceous aerosol in the Pearl River Delta Region, China[J]. Atmospheric Environment, 2011, 45(5): 1175-1182. DOI:10.1016/j.atmosenv.2010.09.041 |
| [24] | Wang S X, Wei W, Du L, et al. Characteristics of gaseous pollutants from biofuel-stoves in rural China[J]. Atmospheric Environment, 2009, 43(27): 4148-4154. DOI:10.1016/j.atmosenv.2009.05.040 |
| [25] | Schauer J J, Kleeman M J, Cass G R, et al. Measurement of emissions from air pollution sources. 3. C1-C29 organic compounds from fireplace combustion of wood[J]. Environmental Science & Technology, 2001, 35(9): 1716-1728. |
| [26] |
刘亚男, 钟连红, 闫静, 等. 民用燃料燃烧碳质组分及VOCs排放特征[J]. 中国环境科学, 2019, 39(4): 1412-1418. Liu Y N, Zhong L H, Yan J, et al. Carbon compositions and VOCs emission characteristics of civil combustion fuels[J]. China Environmental Science, 2019, 39(4): 1412-1418. DOI:10.3969/j.issn.1000-6923.2019.04.008 |
| [27] |
莫梓伟, 邵敏, 陆思华. 中国挥发性有机物(VOCs)排放源成分谱研究进展[J]. 环境科学学报, 2014, 34(9): 2179-2189. Mo Z W, Shao M, Lu S H. Review on volatile organic compounds (VOCs) source profiles measured in China[J]. Acta Scientiae Circumstantiae, 2014, 34(9): 2179-2189. |
| [28] | Tsai S M, Zhang J J, Smith K R, et al. Characterization of non-methane hydrocarbons emitted from various cookstoves used in China[J]. Environmental Science & Technology, 2003, 37(13): 2869-2877. |
| [29] |
孔少飞, 白志鹏, 陆炳. 民用燃料燃烧排放PM2.5和PM10中碳组分排放因子对比[J]. 中国环境科学, 2014, 34(11): 2749-2756. Kong S F, Bai Z P, Lu B. Comparative analysis on emission factors of carbonaceous components in PM2.5 and PM10 from domestic fuels combustion[J]. China Environmental Science, 2014, 34(11): 2749-2756. |
| [30] | William P L. Development of ozone reactivity scales for volatile organic compounds[J]. Air & Waste, 1994, 44(7): 881-899. |
| [31] | Venecek M A, Carter W P L, Kleeman M J. Updating the SAPRC maximum incremental reactivity (MIR) scale for the United States from 1988 to 2010[J]. Journal of the Air & Waste Management Association, 2018, 68(12): 1301-1316. |
| [32] | Geng C M, Yang W, Sun X S, et al. Emission factors, ozone and secondary organic aerosol formation potential of volatile organic compounds emitted from industrial biomass boilers[J]. Journal of Environmental Sciences, 2019, 83: 64-72. DOI:10.1016/j.jes.2019.03.012 |
| [33] | Wang T, Guo H, Blake D R, et al. Measurements of trace gases in the inflow of South China sea background air and outflow of regional pollution at Tai O, southern China[J]. Journal of Atmospheric Chemistry, 2005, 52(3): 295-317. DOI:10.1007/s10874-005-2219-x |
| [34] |
李兴华, 王书肖, 郝吉明. 民用生物质燃烧挥发性有机化合物排放特征[J]. 环境科学, 2011, 32(12): 3515-3521. Li X H, Wang S X, Hao J M. Characteristics of volatile organic compounds (VOCs) emitted from biofuel combustion in China[J]. Environmental Science, 2011, 32(12): 3515-3521. |
| [35] |
张桂芹, 姜德超, 李曼, 等. 城市大气挥发性有机物排放源及来源解析[J]. 环境科学与技术, 2014, 37(S2): 195-200. Zhang G Q, Jiang D C, Li M, et al. Emission sources and analytical sources of volatile organic compounds in urban atmospheric[J]. Environmental Science & Technology, 2014, 37(S2): 195-200. |
| [36] |
陆思华, 白郁华, 张广山, 等. 大气中挥发性有机化合物(VOCs)的人为来源研究[J]. 环境科学学报, 2006, 26(5): 757-763. Lu S H, Bai Y H, Zhang G S, et al. Source apportionment of anthropogenic emissions of volatile organic compounds[J]. Acta Scientiae Circumstantiae, 2006, 26(5): 757-763. DOI:10.3321/j.issn:0253-2468.2006.05.010 |
| [37] | Li Q Q, Su G J, Li C Q, et al. Emission profiles, ozone formation potential and health-risk assessment of volatile organic compounds in rubber footwear industries in China[J]. Journal of Hazardous Materials, 2019, 375: 52-60. DOI:10.1016/j.jhazmat.2019.04.064 |
| [38] | Hong Z Y, Li M Z, Wang H, et al. Characteristics of atmospheric volatile organic compounds (VOCs) at a mountainous forest site and two urban sites in the southeast of China[J]. Science of the Total Environment, 2019, 657: 1491-1500. DOI:10.1016/j.scitotenv.2018.12.132 |
| [39] | Russo R S, Zhou Y, White M L, et al. Multi-year (2004-2008) record of nonmethane hydrocarbons and halocarbons in New England:seasonal variations and regional sources[J]. Atmospheric Chemistry and Physics, 2010, 10(10): 4909-4929. DOI:10.5194/acp-10-4909-2010 |
| [40] | Zalel A, Yuval, Broday D M. Revealing source signatures in ambient BTEX concentrations[J]. Environmental Pollution, 2008, 156(2): 553-562. DOI:10.1016/j.envpol.2008.01.016 |
| [41] |
乔月珍, 王红丽, 黄成, 等. 机动车尾气排放VOCs源成分谱及其大气反应活性[J]. 环境科学, 2012, 33(4): 1071-1079. Qiao Y Z, Wang H L, Huang C, et al. Source profile and chemical reactivity of volatile organic compounds from vehicle exhaust[J]. Environmental Science, 2012, 33(4): 1071-1079. |
| [42] | Schauer J J, Kleeman M J, Cass G R, et al. Measurement of emissions from air pollution sources. 5. C1-C32 organic compounds from gasoline-powered motor vehicles[J]. Environmental Science & Technology, 2002, 36(6): 1169-1180. |
| [43] | Sweet C W, Vermette S J. Toxic volatile organic compounds in urban air in Illinois[J]. Environmental Science & Technology, 1992, 26(1): 165-173. |
| [44] | Wang H L, Lou S R, Huang C, et al. Source profiles of volatile organic compounds from biomass burning in Yangtze River Delta, China[J]. Aerosol and Air Quality Research, 2014, 14(3): 818-828. DOI:10.4209/aaqr.2013.05.0174 |