 2019, Vol. 40


2. 同济大学环境科学与工程学院, 上海 200092;
3. 复旦大学环境科学与工程系, 上海市大气颗粒物污染与防治重点实验室, 上海 200438
2. College of Environmental Science and Engineering, Tongji University, Shanghai 200092, China;
3. Shanghai Key Laboratory of Atmospheric Particle Pollution and Prevention(LAP), Department of Environmental Science and Engineering, Fudan University, Shanghai 200438, China
我国城市或区域秋冬季频发的灰霾事件仍然是政府和公众关注的焦点问题[1], 其中, 包括二次有机气溶胶(SOA)在内的颗粒物暴发增长是重要原因之一[2].目前, SOA的生成机理和来源依然存在很大的不确定性, 由模型计算得到的SOA产率远低于实际观测结果[3, 4].传统模型中挥发性有机物(VOCs)是最主要的SOA前体物[5, 6], 但近年的研究表明, 中等挥发性有机化合物(intermediate-volatile organic compounds, IVOCs)也是SOA的重要前体物[7~9]. Robinson等[10]在修正传统模型的同时加入IVOCs等前体物后, 模型预测的低挥发性物质对人为源SOA的贡献由25%增加到85%. Jathar等[11]使用老化反应的VBS-IVOCs模型进行模拟实验, 使SOA产率大幅提升. Zhao等[12]在引入IVOCs模块后, 发现SOA的模型预测值提升到了与实测值相当的水平.
IVOCs是有效饱和浓度c*在103~106 μg·m-3的一类有机物, 挥发性大致与C12~C22正构烷烃相当, 在常温下为气态[9, 10, 13].目前IVOCs的研究多集中在移动源(轻型汽油车、中型/重型柴油车和船舶等)的排放[14~16], 对民用固体燃料(煤和生物质)这类在我国非常重要的排放源的IVOCs实测数据缺乏关注.民用固体燃料在我国北方农村及城郊均被广泛用于烹饪和冬季采暖[17, 18].该排放源排放了大量的细颗粒物(PM2.5)、有机碳(OC)、元素碳(EC)、多环芳烃(PAHs)以及VOCs等多种污染物[19~22], 但IVOCs的排放缺乏实测数据. Czech等[23]通过飞行时间质谱在线观测到IVOCs在生物质燃烧中占比较重. Hodzic等[24]引入S/IVOCs后发现, 模型预测的人为排放源及生物质燃烧的S/IVOCs产生的SOA占总SOA的40%~60%.固体燃料燃烧排放的气相组成取决于燃料类型和燃烧温度等因素[25~28]. Schauer等[29]对美国西部的针叶植物和灌木植物燃烧的研究表明, 温度是生物质燃烧过程中VOCs排放的重要影响因素. Liu等[30]认为随着温度的升高会导致燃煤中PAHs排放的降低. Xu等[31]对煤热解过程的研究发现, VOCs的释放主要受温度的影响.目前, 相关研究主要集中在VOCs的排放及温度条件的影响, 而对不同温度下固体燃料燃烧排放IVOCs的量及组成缺乏研究.
本文以两种不同成熟度的烟煤和两种生物质(稻秆和松木)为研究对象, 结合石英管式炉和烟气稀释系统, 对各燃料在300~900℃范围内7个温度点(以100℃为间隔)燃烧排放的IVOCs进行采集分析, 探讨民用固体燃料燃烧的IVOCs排放因子和组成以及燃烧温度的影响, 以期为明确该排放源的IVOCs排放特征提供基础数据.
1 材料与方法 1.1 样品的采集本实验选取宁夏灵武和江苏徐州两个煤矿产出的地质成熟度不同的两种烟煤以及水稻秸秆和落叶松木两种生物质作为燃料(基本信息见表 1).燃料准备:煤样磨碎至60~100目, 生物质分解为3~5 cm长的小段, 各燃料均烘干(105℃干燥24 h)待用.
|
|
表 1 煤和生物质的工业分析及元素分析结果1) Table 1 Industrial analysis and elemental analysis results for coal and biomass |
本实验在石英管式炉燃烧系统中进行.燃烧系统包括一根垂直石英管(直径60 mm, 长1 100 mm)及管内的可升降样品台、管外缠绕的加热电阻丝及温控部件(可在室温到1 200℃范围内准确控制起始温度, 精度0.5℃)和供气模块(瓶装干洁空气及流量控制).燃烧系统与烟气稀释采样系统(FPS-4000, 芬兰Dekati公司)连接, 稀释冷却后的烟气分为5路, 分别连接各型颗粒物监测/采样仪和IVOCs采样器. IVOCs采样器为便携式多通道IVOCs自动采样器(上海昕霄环境科技有限公司), IVOCs采样管为装填Tenax TA的不锈钢吸附管, 采样流速为500 mL·min-1.采样管在使用前进行活化.采样结束后, 采样管两端立即用密封帽密封, 放在气密性良好的密封袋中保存, 并置于-18℃冰柜中待测.
本实验中, 各燃料的起始燃烧温度控制为300~900℃之间以100℃为间隔的7个温度点.每次燃烧实验前, 先将石英管式炉加热到指定温度, 然后将燃料通过样品升降台提升到燃烧区开始燃烧.稀释系统前后的烟气组分(CO2、CO、SO2、NO和NO2)通过两台烟气分析仪(C600, 意大利Seitron公司)进行在线监测, 实时记录燃烧状态和烟气稀释倍数.当气态污染物(尤其是CO2、CO和SO2)的浓度降至环境水平即认为燃烧过程结束, 以模拟固体燃料的燃烧全过程.每个燃料及温度点的燃烧实验平行2~3次.每批实验均采集空气空白样品以检测燃烧系统和采样管的本底.
1.2 IVOCs定量分析IVOCs检测采用热脱附-气相色谱/质谱联用仪(TD-GC/MSD, TD为GL Sciences OPTIC-4, GC/MSD为Agilent 6890A/5975C).温控程序:IVOCs样品管在TD单元进行热解析(280℃, 3 min)进入色谱柱(HP-5MS, 30m×0.25 μm×0.25 mm), 然后调节GC的升温程序:60℃下保持5 min, 再以6℃·min-1升至300℃, 保持8 min; MSD的扫描方式为全扫, 质量范围为50~400 u.
IVOCs定量参考课题组已建立的方法[32], 总体上将其划分为可单体识别组分和不能识别的复杂混合物(UCM).其中, 可识别组分包括11个正构烷烃(n-C12~n-C22)和11个芳香烃(萘、1-甲基萘、2-甲基萘、2, 6-二甲基萘、苊烯、苊、芴、菲、蒽、荧蒽和芘).定量时, 先将样品的总离子流图按正构烷烃的保留时间依次划分为11个区间, 分别以一个正构烷烃为中心, 以该烷烃的响应值来计算该区间内总体IVOCs的质量; 再结合烷烃的碎片离子峰(C4H9+, m/z=57)和芳烃的分子离子峰及各标样的保留时间, 定量正构烷烃和芳香烃; UCM的质量为每个区间内的总IVOCs质量减去可识别的正构烷烃和芳香烃的量; 由于大部分UCM是以支链和环状烷烃等化合物存在[29], 可进一步将UCM分为未单体识别的支链烷烃(各区间中m/z=57碎片峰的总质量减去正构烷烃)和剩余UCM.
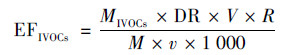
1.3 数据处理IVOCs排放因子, 即单位质量的固体燃料燃烧所排放的IVOCs质量(mg·kg-1), 计算公式如下:
|
(1) |
式中, EFIVOCs为IVOCs的排放因子(mg·kg-1); MIVOCs为采样管中的IVOCs质量(mg); DR为进入稀释系统的烟气流量与稀释空气的比例(即稀释倍数); V为进入稀释系统的烟气流量(L·min-1), R为进入稀释系统的烟气占管式炉总烟气流量的比例, M(kg)为燃烧的燃料质量; v为进入采样管的实际流量(L·min-1).
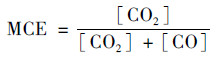
采用校正燃烧效率(modified combustion efficiency, MCE)表征实验过程中各燃料的实际燃烧状况[33, 34], 计算公式如下:
|
(2) |
式中, [CO]和[CO2]分别为烟气中的CO2和CO浓度.通常情况下, MCE大于0.9时, 燃烧过程以完全燃烧为主; MCE小于0.9时, 燃烧过程以不完全燃烧为主[35].
2 结果与讨论 2.1 煤和生物质燃烧的IVOCs排放因子及组成特征通过各燃料在300~900℃的7个温度点的IVOCs排放因子, 计算得到4种燃料的IVOCs平均排放因子(见表 2).其中, 徐州煤的IVOCs排放因子为(205±108) mg·kg-1, 略高于灵武煤[(176±106)mg·kg-1]; 松木的IVOCs排放因子为(606±172) mg·kg-1, 是稻秆[(360±78)mg·kg-1]的1.7倍; 两种生物质的IVOCs平均排放因子[(483±182)mg·kg-1]比烟煤均值[(190±108)mg·kg-1]高2.5倍.结合表 1中各燃料的挥发分含量, 发现IVOCs排放因子与挥发分含量之间呈现较好的正相关关系:徐州煤的挥发分含量(Vdaf=35.5%)高于灵武煤(30.0%), 松木(85.7%)高于稻秆(81.4%), 生物质的挥发分整体上远高于烟煤.因此, 民用固体燃料燃烧源的IVOCs排放因子在较大程度上受燃料的挥发分含量控制.这与该类源的挥发性有机物(VOCs)和颗粒态有机物(如EC、OC、PAHs等)排放因子随燃料的挥发分含量变化的趋势一致[28, 36].值得注意的是, 表 2列出的各燃料的IVOCs排放因子是7个温度点的算术平均, 与实际燃烧排放因子可能存在一定差异, 因为后者通常是不同温度点的加权平均, 受控于实际燃烧条件.
|
|
表 2 各燃料的IVOCs及其组分的平均排放因子1)/mg·kg-1 Table 2 Average emissions factors for IVOCs and their components for each fuel/mg·kg-1 |
IVOCs的组成包括可单体识别的正构烷烃和芳香烃, 以及不可单体识别的支链烷烃和剩余UCM等4个部分, 图 1显示了4种燃料的IVOCs组成情况(各组分的排放因子详见表 2).其中, 两种烟煤和两种生物质之间分别具有较相似的组成比例, 但煤与生物质之间存在显著差异.首先, 剩余UCM均是主导组分, 在两种煤排放的IVOCs中分别占68.1%(灵武煤)和68.3%(徐州煤), 而在两种生物质中分别占83.9%(稻秆)和79.6%(松木), 生物质远高于煤.其次, 燃煤排放的正构烷烃占比(7.0%~7.6%)和支链烷烃占比(14.4%~17.2%)均显著高于生物质燃烧排放的正构烷烃(约0.7%)和支链烷烃(3.9%~8.2%), 但煤的芳香烃(7.5%~9.9%)比生物质(约11.5%)略低.第三, 相比于两种烟煤之间的差异, 松木的支链烷烃占比(8.2%)与稻秆(3.9%)的差异更显著.从表 2可以看出, 松木和稻秆的支链烷烃排放因子分别是(49.7±6.8) mg·kg-1和(14.2±6.0) mg·kg-1, 相差3.5倍; 类似地, 松木的芳香烃比稻秆高1.7倍.这可能与松木更富含木质素有关:纤维素和半纤维素的热解多生成线状烷烃和烯烃, 而木质素热解则易排放环状和含苯环的化合物[37, 38].因此, 除了燃料中挥发分含量的影响之外, 燃料的结构组成也是影响IVOCs排放及组成的重要因素[33, 39].

|
图 1 不同燃料IVOCs组分百分比 Fig. 1 Percentage composition of IVOCs for different fuels |
4种燃料在300~900℃之间7个起始燃烧温度点的IVOCs排放因子见图 2.两种烟煤和两种生物质之间分别呈现较为一致的变化趋势, 但煤与生物质之间差异明显.对于烟煤, 低温条件下(300~600℃)的IVOCs排放因子显著高于高温条件(700~900℃), 且在500℃时达到最高值.徐州煤在300~900℃的IVOCs排放因子的变化范围是(62±26)~(358±51) mg·kg-1, 灵武煤的范围是(63±15)~(340±113) mg·kg-1, 两种煤在500℃比900℃分别高5.8倍和5.4倍.生物质在低温(300~600℃)和高温(700~900℃)分别出现两个峰值, 且两种生物质之间略有差异.稻杆的IVOCs排放因子在300~900℃的变化范围为(271±47)~(477±59) mg·kg-1, 低温时的峰值(400℃, 442 mg·kg-1)是高温时峰值(800℃, 477 mg·kg-1)的0.8倍; 松木的变化范围为(437±234)~(868±462) mg·kg-1, 低温峰值(500℃, 868 mg·kg-1)是高温时峰值(900℃, 564 mg·kg-1)的1.5倍.这些变化将在下文中结合各燃料的实际燃烧效率进行深入讨论和解释.

|
图 2 不同温度下烟煤和生物质燃烧的IVOCs排放因子 Fig. 2 Emissions factors for IVOCs from bituminous and biomass burning at different temperatures |
燃烧温度对煤和生物质的IVOCs组成也表现出显著不同的影响. 图 3分别以灵武煤和松木为例进行比较.首先, 灵武煤的剩余UCM排放因子在500℃时达到最大值[(246±87)mg·kg-1], 900℃时最小[(34±11)mg·kg-1], 相差7.2倍; 剩余UCM占比也是在500℃和900℃时分别达到最大值(72%)和最小值(54%), 相差1.3倍.松木的剩余UCM虽然在500℃时的排放因子最高[(785±470)mg·kg-1], 比最低值[(283±13)mg·kg-1, 800℃]高2.8倍, 但UCM占比在400℃最高, 达92%, 为900℃时最低值(61%)的1.5倍, 可见松木IVOCs中剩余UCM的含量、占比及随温度的变异性均高于烟煤.其次, 虽然灵武煤的正构烷烃占比随温度升高呈现下降趋势, 但其总体占比较小, 松木中正构烷烃占比更小(小于1%), 可以忽略; 另一方面, 支链烷烃的占比随温度的变化趋势比较复杂:在烟煤中, 900℃时占比最高(27%), 是500℃时(11%)的2.4倍, 在松木中, 800℃时占比最高(13%), 是500℃时(4%)的3.1倍.第三, 灵武煤的芳香烃排放因子分别在500℃和800℃达到最大(30.6 mg·kg-1)和最小值(7.8 mg·kg-1), 相差3.5倍, 但两个温度点的占比则从9%上升到14%, 与灵武煤的IVOCs整体排放因子随温度显著下降有关; 松木中芳香烃的变化更为显著:400℃时的排放因子为(8.8±3.3) mg·kg-1, 比900℃[(165±71)mg·kg-1]低18.7倍; 两者的占比(400℃为1%, 900℃为29%)则相差28倍.芳香烃占比随温度升高(尤其是生物质燃烧)的情况值得重视, 因为芳香烃相比于其它组分, 具有更高的SOA转化能力.

|
(a)灵武煤; (b)松木 图 3 不同温度下灵武煤和松木的IVOCs组分占比 Fig. 3 Proportion of IVOCs in LW coal and pine at different temperatures |
为了进一步探讨温度如何影响煤和生物质燃烧的IVOCs排放特征, 根据燃烧过程中记录的CO和CO2浓度, 计算了各燃料的校正燃烧效率(MCE).以MCE=0.9为界限, 发现4种燃料均表现为:在300~600℃以不完全燃烧为主(MCE<0.9), 在700~900℃以完全燃烧为主(MCE>0.9). 表 3对各燃料两个温度段的IVOCs排放因子和组成进行比较.
|
|
表 3 4种燃料分两个温度段的IVOCs平均排放因子及其组成1) Table 3 Average emissions factors and composition of IVOCs for four fuels at two temperature zones |
从表 3可见, 灵武煤在300~600℃和700~900℃这2个温度段的IVOCs平均排放因子分别为(256±83) mg·kg-1和(69±8) mg·kg-1, 徐州煤则分别为(295±111) mg·kg-1和(85±35) mg·kg-1, 两种煤在低温燃烧条件分别是高温时的3.7倍和3.5倍.稻秆的两个温度段IVOCs平均排放因子分别为(339±74) mg·kg-1和(389±93) mg·kg-1, 松木则分别为(698±255) mg·kg-1和(485±118) mg·kg-1, 两种生物质的低温和高温的差异分别是0.9倍和1.4倍, 显著小于烟煤之间的差异, 说明燃烧温度或燃烧效率对煤和生物质排放IVOCs有着不同的影响机制. Zhou等[40]在研究民用燃煤时发现, 燃烧温度低于600℃时, 燃烧效率较低, 大量挥发性有机化合物从燃烧区挥发, 但当燃烧温度高于600℃后燃烧效率迅速提高, 煤的挥发性物质被迅速消耗殆尽, 致使挥发性物质的排放量降低. Cheng等[41]利用热重分析曲线拟合方法, 发现煤中挥发性物质的释放主要发生在300~600℃之间, 其中, 烟煤的拟合最大值出现在485℃.而生物质主要是由纤维素、半纤维素和木质素等交织形成的高聚合物, 它们由于化学结构不同而具有不同的分解温度, 纤维素的降解温度在240~350℃, 木质素则在280~500℃降解[37, 42, 43].辛荣斌等[44]对木屑燃烧的研究表明, 在400℃以下的燃烧反应以纤维素和半纤维素产生的挥发分的燃烧占主导; 400~600℃的燃烧反应主要是木质素发生脱侧链和缩合反应, 也可产生较多的挥发性物质, 更高的温度则易导致芳烃类化合物生成.这些均与本实验的观测结果一致.
IVOCs的组成方面, 从表 3可以看出, 两种烟煤的UCM占比均超过80%, 且随温度或燃烧效率的提升变化不大, 与之对应的是可识别组分(正构烷烃和芳香烃之和)占比均低于20%且较为稳定; 生物质的情况则显著不同, UCM占比随燃烧温度或效率的提升从90%以上大幅下降到80%以下, 而可识别组分占比则增长约4倍.另一方面, 虽然正构及支链烷烃的占比呈现较复杂的变化趋势, 但芳香烃的占比随燃烧温度或效率的提升均表现为明显的上升态势, 尤其是两种生物质, 增长倍数均超过4.5倍, 显著高于烟煤在2倍以内的变化.这些特征与各燃料的内部结构组成及其热稳定性有关:对于烟煤, 由于富含苯环结构, 在低温条件或以不完全燃烧为主的情况下, 芳香烃类化合物主要由煤的热解析造成自由态小分子等挥发性物质的释放及其在较高温度下的聚合, 易促进芳香族化合物的生成; 但当温度升高或燃烧效率显著提升后, 烟气中的芳香族物质将是在煤的小分子合成、大分子骨架裂解以及芳香化合物自身的热分解之间平衡的结果, 致使生成量变化不明显[45~47].而UCM多由含氧化合物和支链及环烷烃组成[29], 在低温时, 煤首先分解具有较低键能的含氧和长链烷基, 生成较多的支链烷烃, 而温度升高后UCM可以吸收更多的能量, 致使短链烷基断裂[48], 造成其生成量的下降.生物质的组成较烟煤简单, 主要由纤维素、半纤维素和木质素组成, 这些物质在温度低时发生热解生成小分子有机化合物, 以UCM为主, 但随着温度或燃烧效率的上升, 小分子有机物芳构化, 导致UCM减少, 但芳香烃大幅上升[44], 以致于在高温条件下整体IVOCs排放因子没有出现类似烟煤的大幅下降趋势, 对于富含木质素的薪柴燃烧尤其明显.因此, 对于IVOCs排放控制而言, 生物质特别是木柴在高温条件下燃烧易排放较高比例的芳香烃的问题值得重视.
3 结论(1) 两种生物质的IVOCs平均排放因子是(483±182) mg·kg-1, 而两种烟煤平均为(190±108) mg·kg-1, 生物质比烟煤高2.5倍; 组成方面, 生物质和煤的IVOCs均以剩余UCM为主, 分别是81.2%±11.1%和68.2%±5.7%, 但生物质排放的正构及支链烷烃占比明显低于烟煤, 芳香烃占比则略高; IVOCs排放因子不仅与燃料中挥发分含量相关, 也与燃料的结构组成有关.
(2) 燃烧温度对IVOCs排放的影响显著, 表现为随着温度升高, 煤与生物质之间IVOCs排放存在明显的差异:对于烟煤, 低温燃烧排放的IVOCs显著高于高温, 在500℃比900℃高5倍以上; 生物质在400~500℃和800~900℃时呈现两个较为接近的峰值; 组成方面, 随着温度上升, 松木的芳香烃占比从1%增加到29%, 剩余UCM从92%降低到61%, 烟煤也有类似的变化趋势, 但幅度较小.
(3) 结合校正燃烧效率(MCE)的计算, 发现4种燃料均表现为在低温时(300~600℃)以不完全燃烧为主(MCE<0.9), 高温时(700~900℃)以完全燃烧为主(MCE>0.9).其中, 烟煤在低温燃烧时的IVOCs平均排放因子是高温时的3.5倍左右, 生物质在两个温度段之间的差异很小; 组成上, 烟煤的UCM或可识别组分占比随温度或燃烧效率的提升较为稳定变化, 但生物质的UCM占比从90%以上大幅下降到80%以下, 可识别组分占比则增长约4倍, 其中芳香烃增长4.5倍以上.这与各燃料的结构组成及其热稳定性差异有关.
| [1] | Hu W, Hu M, Hu W W, et al. Seasonal variations in high time-resolved chemical compositions, sources, and evolution of atmospheric submicron aerosols in the megacity Beijing[J]. Atmospheric Chemistry and Physics, 2017, 17(16): 9979-10000. DOI:10.5194/acp-17-9979-2017 |
| [2] | Huang R J, Zhang Y L, Bozzetti C, et al. High secondary aerosol contribution to particulate pollution during haze events in China[J]. Nature, 2014, 514(7521): 218-222. DOI:10.1038/nature13774 |
| [3] | Vutukuru S, Griffin R J, Dabdub D. Simulation and analysis of secondary organic aerosol dynamics in the South Coast Air Basin of California[J]. Journal of Geophysical Research:Atmospheres, 2006, 111(D10): D10S12. |
| [4] | Ots R, Young D E, Vieno M, et al. Simulating secondary organic aerosol from missing diesel-related intermediate-volatility organic compound emissions during the Clean Air for London (ClearfLo) campaign[J]. Atmospheric Chemistry and Physics, 2016, 16(10): 6453-6473. DOI:10.5194/acp-16-6453-2016 |
| [5] | Johnson D, Utembe S R, Jenkin M E, et al. Simulating regional scale secondary organic aerosol formation during the TORCH 2003 campaign in the southern UK[J]. Atmospheric Chemistry and Physics, 2006, 6(2): 403-418. DOI:10.5194/acp-6-403-2006 |
| [6] | Jimenez J L, Canagaratna M R, Donahue N M, et al. Evolution of organic aerosols in the atmosphere[J]. Science, 2009, 326(5959): 1525-1529. DOI:10.1126/science.1180353 |
| [7] | Presto A A, Miracolo M A, Kroll J H, et al. Intermediate-volatility organic compounds:A potential source of ambient oxidized organic aerosol[J]. Environmental Science & Technology, 2009, 43(13): 4744-4749. |
| [8] | Tkacik D S, Presto A A, Donahue N M, et al. Secondary organic aerosol formation from intermediate-volatility organic compounds:cyclic, linear, and branched alkanes[J]. Environmental Science & Technology, 2012, 46(16): 8773-8781. |
| [9] | Zhao Y L, Hennigan C J, May A A, et al. Intermediate-volatility organic compounds:a large source of secondary organic aerosol[J]. Environmental Science & Technology, 2014, 48(23): 13743-13750. |
| [10] | Robinson A L, Donahue N M, Shrivastava M K, et al. Rethinking organic aerosols:semivolatile emissions and photochemical aging[J]. Science, 2007, 315(5816): 1259-1262. DOI:10.1126/science.1133061 |
| [11] | Jathar S H, Woody M, Pye H O T, et al. Chemical transport model simulations of organic aerosol in southern California:model evaluation and gasoline and diesel source contributions[J]. Atmospheric Chemistry and Physics, 2017, 17(6): 4305-4318. DOI:10.5194/acp-17-4305-2017 |
| [12] | Zhao B, Wang S X, Donahue N M, et al. Quantifying the effect of organic aerosol aging and intermediate-volatility emissions on regional-scale aerosol pollution in China[J]. Scientific Reports, 2016, 6: 28815. DOI:10.1038/srep28815 |
| [13] | Donahue N M, Robinson A L, Stanier C O, et al. Coupled partitioning, dilution, and chemical aging of semivolatile organics[J]. Environmental Science & Technology, 2006, 40(8): 2635-2643. |
| [14] | Cross E S, Sappok A G, Wong V W, et al. Load-dependent emission factors and chemical characteristics of IVOCs from a medium-duty diesel engine[J]. Environmental Science & Technology, 2015, 49(22): 13483-13491. |
| [15] | Zhao Y L, Nguyen N T, Presto A A, et al. Intermediate volatility organic compound emissions from on-road diesel vehicles:chemical composition, emission factors, and estimated secondary organic aerosol production[J]. Environmental Science & Technology, 2015, 49(19): 11516-11526. |
| [16] | Huang C, Hu Q Y, Li Y J, et al. Intermediate volatility organic compound emissions from a large cargo vessel operated under real-world conditions[J]. Environmental Science & Technology, 2018, 52(21): 12934-12942. |
| [17] | He L Y, Lin Y, Huang X F, et al. Characterization of high-resolution aerosol mass spectra of primary organic aerosol emissions from Chinese cooking and biomass burning[J]. Atmospheric Chemistry and Physics, 2010, 10(23): 11535-11543. DOI:10.5194/acp-10-11535-2010 |
| [18] | Duan X L, Jiang Y, Wang B B, et al. Household fuel use for cooking and heating in China:results from the first Chinese environmental exposure-related human activity patterns survey (CEERHAPS)[J]. Applied Energy, 2014, 136: 692-703. DOI:10.1016/j.apenergy.2014.09.066 |
| [19] | Bond T C, Covert D S, Kramlich J C, et al. Primary particle emissions from residential coal burning:optical properties and size distributions[J]. Journal of Geophysical Research:Atmospheres, 2002, 107(D21): 8347. |
| [20] | Shen G F, Tao S, Wei S Y, et al. Field measurement of emission factors of PM, EC, OC, parent, nitro-, and oxy- polycyclic aromatic hydrocarbons for residential briquette, coal cake, and wood in rural Shanxi, China[J]. Environmental Science & Technology, 2013, 47(6): 2998-3005. |
| [21] | Zhang J, Smith K R, Ma Y, et al. Greenhouse gases and other airborne pollutants from household stoves in China:a database for emission factors[J]. Atmospheric Environment, 2000, 34(26): 4537-4549. DOI:10.1016/S1352-2310(99)00450-1 |
| [22] | Lei Y, Zhang Q, He K B, et al. Primary anthropogenic aerosol emission trends for China, 1990-2005[J]. Atmospheric Chemistry and Physics, 2011, 11(3): 931-954. DOI:10.5194/acp-11-931-2011 |
| [23] | Czech H, Sippula O, Kortelainen M, et al. On-line analysis of organic emissions from residential wood combustion with single-photon ionisation time-of-flight mass spectrometry (SPI-TOFMS)[J]. Fuel, 2016, 177: 334-342. DOI:10.1016/j.fuel.2016.03.036 |
| [24] | Hodzic A, Jimenez J L, Madronich S, et al. Modeling organic aerosols in a megacity:potential contribution of semi-volatile and intermediate volatility primary organic compounds to secondary organic aerosol formation[J]. Atmospheric Chemistry and Physics, 2010, 10(12): 5491-5514. DOI:10.5194/acp-10-5491-2010 |
| [25] | Thomas S, Wornat M J. Polycyclic aromatic hydrocarbons from the co-pyrolysis of catechol and 1, 3-butadiene[J]. Proceedings of the Combustion Institute, 2009, 32(1): 615-622. DOI:10.1016/j.proci.2008.05.043 |
| [26] | Shen G F, Chen Y C, Xue C Y, et al. Pollutant emissions from improved coal- and wood-fuelled cookstoves in rural households[J]. Environmental Science & Technology, 2015, 49(11): 6590-6598. |
| [27] | Atiku F A, Mitchell E J S, Lea-Langton A R, et al. The impact of fuel properties on the composition of soot produced by the combustion of residential solid fuels in a domestic stove[J]. Fuel Processing Technology, 2016, 151: 117-125. DOI:10.1016/j.fuproc.2016.05.032 |
| [28] | Li Q, Jiang J K, Zhang Q, et al. Influences of coal size, volatile matter content, and additive on primary particulate matter emissions from household stove combustion[J]. Fuel, 2016, 182: 780-787. DOI:10.1016/j.fuel.2016.06.059 |
| [29] | Schauer J J, Kleeman M J, Cass G R, et al. Measurement of emissions from air pollution sources. 3. C1?C29 organic compounds from fireplace combustion of wood[J]. Environmental Science & Technology, 2001, 35(9): 1716-1728. |
| [30] | Liu S Q, Wang C H, Zhang S J, et al. Formation and distribution of polycyclic aromatic hydrocarbons (PAHs) derived from coal seam combustion:a case study of the Ulanqab lignite from Inner Mongolia, northern China[J]. International Journal of Coal Geology, 2012, 90-91: 126-134. DOI:10.1016/j.coal.2011.11.005 |
| [31] | Xu J Y, Zhuo J K, Zhu Y N, et al. Analysis of volatile organic pyrolysis products of bituminous and anthracite coals with single-photon ionization time-of-flight mass spectrometry and gas chromatography/mass spectrometry[J]. Energy & Fuels, 2017, 31(1): 730-737. |
| [32] |
王攀攀, 李英杰, 张帆, 等. 上海洋山港环境空气IVOCs的浓度、组成和G20期间变化特征[J]. 地球化学, 2018, 47(3): 313-321. Wang P P, Li Y J, Zhang F, et al. Concentration, composition and variation of ambient IVOCs in Shanghai Port during the G20 summit[J]. Geochimica, 2018, 47(3): 313-321. |
| [33] | Roden C A, Bond T C, Conway S, et al. Emission factors and real-time optical properties of particles emitted from traditional wood burning cookstoves[J]. Environmental Science & Technology, 2006, 40(21): 6750-6757. |
| [34] | Shen G F, Yang Y F, Wang W, et al. Emission factors of particulate matter and elemental carbon for crop residues and coals burned in typical household stoves in China[J]. Environmental Science & Technology, 2010, 44(18): 7157-7162. |
| [35] | Urbanski S P. Combustion efficiency and emission factors for wildfire-season fires in mixed conifer forests of the northern Rocky Mountains, US[J]. Atmospheric Chemistry and Physics, 2013, 13(14): 7241-7262. DOI:10.5194/acp-13-7241-2013 |
| [36] | Wang Q, Geng C M, Lu S H, et al. Emission factors of gaseous carbonaceous species from residential combustion of coal and crop residue briquettes[J]. Frontiers of Environmental Science & Engineering, 2013, 7(1): 66-76. |
| [37] |
周顺, 徐迎波, 王程辉, 等. 比较研究纤维素、果胶和淀粉的燃烧行为和机理[J]. 中国烟草学报, 2011, 17(5): 1-9. Zhou S, Xu Y B, Wang X H, et al. A comparative study of the combustion behavior and mechanism of cellulose, pectin and starch[J]. Acta Tabacaria Sinica, 2011, 17(5): 1-9. DOI:10.3969/j.issn.1004-5708.2011.05.001 |
| [38] | Evtyugina M, Alves C, Calvo A, et al. VOC emissions from residential combustion of Southern and mid-European woods[J]. Atmospheric Environment, 2014, 83: 90-98. DOI:10.1016/j.atmosenv.2013.10.050 |
| [39] | Greenberg J P, Friedli H, Guenther A B, et al. Volatile organic emissions from the distillation and pyrolysis of vegetation[J]. Atmospheric Chemistry and Physics, 2006, 6(1): 81-91. |
| [40] | Zhou W, Jiang J K, Duan L, et al. Evolution of submicrometer organic aerosols during a complete residential coal combustion process[J]. Environmental Science & Technology, 2016, 50(14): 7861-7869. |
| [41] | Cheng J, Zhang Y S, Wang T, et al. Thermogravimetric-Fourier transform infrared spectroscopy-gas chromatography/mass spectrometry study of volatile organic compounds from coal pyrolysis[J]. Energy & Fuels, 2017, 31(7): 7042-7051. |
| [42] | Lv G J, Wu S B. Analytical pyrolysis studies of corn stalk and its three main components by TG-MS and Py-GC/MS[J]. Journal of Analytical and Applied Pyrolysis, 2012, 97: 11-18. DOI:10.1016/j.jaap.2012.04.010 |
| [43] | Lingens A, Windeisen E, Wegener G. Investigating the combustion behaviour of various wood species via their fire gases[J]. Wood Science and Technology, 2005, 39(1): 49-60. DOI:10.1007/s00226-004-0271-3 |
| [44] | 辛荣斌.生物质燃烧过程中挥发性有机物释放特性研究[D].昆明: 昆明理工大学, 2017. |
| [45] | Dong J, Li F, Xie K C. Study on the source of polycyclic aromatic hydrocarbons (PAHs) during coal pyrolysis by PY-GC-MS[J]. Journal of Hazardous Materials, 2012, 243: 80-85. DOI:10.1016/j.jhazmat.2012.09.073 |
| [46] | Wornat M J, Ledesma E B, Marsh N D. Polycyclic aromatic hydrocarbons from the pyrolysis of catechol (ortho-dihydroxybenzene), a model fuel representative of entities in tobacco, coal, and lignin[J]. Fuel, 2001, 80(12): 1711-1726. DOI:10.1016/S0016-2361(01)00057-6 |
| [47] | Poddar N B, Thomas S, Wornat M J. Polycyclic aromatic hydrocarbons from the co-pyrolysis of 1, 3-butadiene and propyne[J]. Proceedings of the Combustion Institute, 2013, 34(1): 1775-1783. DOI:10.1016/j.proci.2012.05.013 |
| [48] | He K, Zhang S C, Mi J K, et al. The evolution of chemical groups and isotopic fractionation at different maturation stages during lignite pyrolysis[J]. Fuel, 2018, 211: 492-506. DOI:10.1016/j.fuel.2017.09.085 |