 2019, Vol. 40


随着我国工业的快速发展和城市化进程的加快, 作为主要能源的化石燃料被大量使用, 在其燃烧过程中产生的SO2、NOx、颗粒物和挥发性有机物(volatile organic compounds, VOCs)等是造成我国城市环境空气污染的重要污染物[1].近年来, 随着脱硫和除尘等一系列严格治理措施的实施, SO2和颗粒物污染得到了有效的控制, 然而对NOx和VOCs的排放控制相对滞后, 国内很多地区以高浓度臭氧(O3)或细颗粒物(PM2.5)为特征的复合型污染问题逐步加剧[2, 3]. VOCs是对流层O3和二次有机气溶胶(secondary organic aerosols, SOA)的重要前体物[4, 5], 目前国内研究者普遍关注交通尾气、生物质燃烧、石油化工过程等VOCs排放源的影响[6~10], 对化石燃料燃烧排放的挥发性有机物对环境影响的研究相对较少.我国已建立的全国人为源排放清单中化石燃料燃烧源占比可达12%[11], Wang等[12]对北京地区VOCs组分研究表明, 北京市冬季化石燃料燃烧源对大气中VOCs贡献可达26%~39%, 仅次于移动源.朔州市的VOCs源解析结果显示, 煤炭燃烧是其大气中VOCs的主要来源[13], 同时相关研究也显示化石燃料燃烧源排放的VOCs具有较强的O3和SOA生成能力[14, 15].
近几年来兰州市环境空气中O3和PM2.5污染逐渐加剧, 其作为我国西北重工业城市, 化石燃料燃烧排放的影响不容忽视[16].张凯等[17]建立了兰州市人为源VOCs排放清单, 但对化石燃料燃烧源的空间分配仅依据GDP和人口分布进行插值处理, 未按企业计算排放量, 不利于制定“一企一策”的污染控制方案.因此, 本文通过调查相关部门数据和实地调研, 获取兰州市工业企业和集中供暖锅炉的位置和燃料消耗量, 利用排放系数法建立了2016年兰州市化石燃料燃烧源的VOCs排放清单, 根据国内外研究中实测VOCs成分谱以及臭氧的最大增量反应活性(maximum incremental reaction, MIR)和气溶胶生成系数(aerosolformation coefficient, FAC)对OFP和SOAFP进行了估算, 利用Arcgis软件实现兰州市化石燃料燃烧源的空间分配, 了解其排放对区域大气环境质量的影响, 以期为区域O3和PM2.5防控对策的制定提供依据和基础数据.
1 材料与方法 1.1 研究区域与研究对象根据国民经济行业分类标准(GB/T 4754-2017)以及对兰州市企业调查结果, 由于兰州市有色金属冶炼制造业只有电解铝行业, 不涉及化石燃料的燃烧过程, 同时国内外文献未见到关于电解铝行业VOCs排放数据, 因此本研究中不考虑该部分VOCs排放.兰州市涉化石燃料燃烧行业主要包括制造业和电力、热力、燃气及水生产和供应业, 其中2016年兰州市电力、热力生产和供应行业煤炭消耗量占规模以上工业企业煤炭消耗量(除电解铝行业外)的65.3%.制造业化石燃料燃烧主要有非金属矿物制品业(主要为水泥制造业、砖瓦制造业)和黑色金属冶炼及压延行业(主要为钢铁冶炼业)占总煤炭消耗量的19.5%, 其它化石燃料燃烧分为其它工业.因此, 本文将兰州市2016年化石燃料燃烧源分为电力生产供应、热力生产供应、砖瓦制造业、水泥制造业、钢铁冶炼业以及其它工业.为研究不同化石燃料燃烧的影响, 结合实际调查结果进一步将热力生产供应分为热力生产供应(煤炭)和热力生产行业(天然气), 将其它工业进一步划分为其它工业(煤炭)、其它工业(燃料油)以及其它工业(天然气).研究区域包括城关区、安宁区、七里河区、西固区、红古区、皋兰县、皋兰县、永登县和兰州新区.
1.2 VOCs排放量计算获取兰州市2016年各企业化石燃料消耗量, 对兰州市集中供暖锅炉采用实地调研的方式获取供暖锅炉燃料类型以及其相应的化石燃料消耗量, 进一步计算其VOCs排放量.
计算公式如下:
|
(1) |
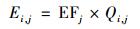
式中, Ei, j为j行业中i企业在全年的VOCs排放量; Qi, j为j行业中i企业相对应的活动水平(对于砖瓦制造业、水泥制造业、钢铁冶炼业为其相对应的产品产量), EFj为该活动水平所相对应的排放系数来源于文献[18].
1.3 VOCs的空间和物种分配利用获取的企业地理坐标, 通过Arcgis建立化石燃料燃烧企业的地理信息数据库, 以点源形式标明各个电力或热力生产供应以及制造业位置, 相关结果如图 1所示.

|
图 1 兰州市电力和热力生产供应及制造业的分布 Fig. 1 Distribution of power plants, boilers, and industrial kilns in Lanzhou City |
为进一步计算各类源排放VOCs对O3和SOA的影响, 需要了解相应源排放VOCs的组分, 对国内外已有研究和数据库资料进行收集, 其中电力生产供应、热力生产供应(煤炭)、钢铁冶炼业源成分谱信息来自文献[19];砖瓦制造业相应源成分谱数据来自文献[20];热力生产供应(天然气)、水泥制造业、其它工业(煤炭)、其它工业(燃料油)、其它工业(天然气)源成分谱数据来自EPA的SPECIATE 4.5数据库[21].
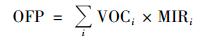
1.4 O3和SOA生成潜势计算最大增量反应活性(maximum incremental reaction, MIR)法、OH消耗速率法和光化学臭氧生成潜势(photochemical ozone creation potential, POCP)等方法是研究VOCs物种对O3生成影响的主要方法[22, 23]. MIR计算O3生成潜势用OFP表示, 反映了VOC物种在最佳反应条件下对O3生成贡献[24], 其广泛用于评估VOCs在某一地区臭氧生成中的作用[25, 26], 计算公式如下:
|
(2) |
式中, VOCi为化石燃料燃烧源中第i种VOCs的排放量; MIRi为第i种VOCs生成O3的最大增量反应活性系数; MIR值来自于Carter[27, 28]的研究成果.
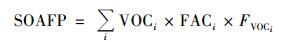
目前估算SOA的主要方法包括OC/EC比值法、WSOC法、气溶胶生成系数法(FAC)等[29~31], 其中, Grosjean等[32, 33]在综合大量烟雾箱实验和大气化学动力学数据的基础上整理了一套气溶胶生成系数, 在二次有机气溶胶生成潜势(secondary organic aerosol formation potential, SOAFP)的估算中得到了广泛地应用[34, 35], 本文采用该方法计算SOA生成潜势, 公式如下:
|
(3) |
式中, VOCi为工业化石燃料燃烧源中第i种VOCs的排放量; FACi为第i种VOCs生成SOA的生成系数; FVOCi为第i种VOCs参与反应的质量分数, %, FACi和 FVOCi均来自于Grosjean等[32, 33]大量的烟雾箱实验数据.
2 结果与讨论 2.1 兰州市化石燃料燃烧源VOCs排放量通过1.2节中的方法建立了兰州市各县区各类行业化石燃料燃烧源VOCs源清单, 其中各县区及各行业VOCs排放量如图 2所示.

|
图 2 兰州各县区化石燃料燃烧源各子源VOCs排放量 Fig. 2 VOCs emissions from fossil fuel combustion sources in various counties and regions of Lanzhou City |
兰州市2016年化石燃料燃烧源VOCs排放总量为3067.6 t, 永登县排放量最大为1108.9 t(36.2%), 其中水泥制造业占比最高.榆中县和西固区次之, 排放量分别为710.6 t(23.2%)和457.6 t(14.9%), 其占比最高的分别为水泥制造业和电力生产供应.对于全市化石燃料燃烧源而言, 水泥制造业是对VOCs排放量贡献最大的源, 其年排放量为1303.4 t, 贡献率为42.5%;电力生产供应、钢铁制造业、砖瓦制造业等高耗能行业VOCs排放量分别为653.2、447.1和329.3 t, 贡献率分别为21.3%、14.6%和10.7%;其它行业VOCs排放量均小于10%.
2.2 化石燃料燃烧源排放VOCs的OFP兰州市各行业化石燃料燃烧源和其吨标煤[36]燃烧排放VOCs的OFP如图 3所示, 其中水泥制造业排放VOCs的OFP最高为3589.7 t; 其次为砖瓦制造业、电力生产供应、热力生产供应(煤炭)和钢铁冶炼业, 燃烧产生的VOCs对应的OFP分别为1231.2、1191.2、821.5和398.9 t.为更好地评估各企业化石燃料产生VOCs对O3的影响, 计算各企业化石燃料折为吨标煤燃烧产生VOCs的OFP, 其中砖瓦制造业最高为4.9 kg·t-1, 其次为水泥制造业、钢铁冶炼业、其它工业(煤炭)以及热力生产供应(煤炭), 分别为3.8、3.5、1.6和1.2 kg·t-1, 热力生产供应(天然气)和其它工业(天然气)最小, 为0.2 kg·t-1.

|
图 3 化石燃料燃烧源各子源OFP总量及吨标煤燃烧产生VOCs的OFP Fig. 3 OFP of total VOCs and of VOCs emitted from combustion calculated as the ton of standard coal from each fossil fuel combustion source |
兰州市各行业化石燃料燃烧所引起的SOAFP和折为吨标煤燃烧排放VOCs的SOAFP如图 4所示, 通过气溶胶生成系数(FAC)计算得出的兰州市化石燃料燃烧源SOAFP总量为9.7 t, 其中水泥制造业SOAFP最大为4911.7 kg, 其次为砖瓦制造业、热力生产供应(煤炭)、电力生产供应以及钢铁冶炼业, SOAFP分别为1684.6、1117.9、985.4和536.5 kg; 根据折为吨标煤燃烧排放VOCs的SOAFP计算结果, 砖瓦制造业最高为6.7 g·t-1, 其次为水泥制造业、钢铁冶炼业、热力生产供应(煤炭)和其它工业(煤炭), 分别为5.5、4.7、1.7和1.4 g·t-1, 热力生产供应(天然气)、其它工业(天然气)最小, 均为0.03 g·t-1.

|
图 4 化石燃料燃烧源各子源SOAFP及吨标煤燃烧产生VOCs的SOAFP Fig. 4 SOAFP of total VOCs and of VOCs emitted from combustion calculated as the ton of standard coal from each fossil fuel combustion source |
由于化石燃料燃烧源存在明显的时间差异, 依据各个企业采暖期和非采暖期的化石燃料消耗量占比进行分配, 最终各时期各类物种贡献结果如图 5所示.其中化石燃料燃烧源排放VOCs中全年均以烷烃为主, 其次为芳香烃, 采暖期相对于非采暖期来说, 芳香烃、OVOCs和卤代烃占比增大, 而烷烃和炔烃占比减小, 烯烃基本保持不变.在全年各个时期芳香烃对OFP贡献占比均最大, 全年为40.0%, 其次为烷烃(26.1%)和烯烃(20.5%); SOAFP中芳香烃贡献占比最大, 采暖季可达到71.2%;全年占比为67.2%, 远高于烷烃(26.7%)和烯烃(6.0%).

|
图 5 不同时期化石燃料燃烧源的物种对O3和SOA的生成潜势占比 Fig. 5 OFP and SOAFP of VOCs speciated emissions from fossil fuel combustion in different periods |
采暖期和非采暖期各物种OFP和SOAFP占比前10位物种如图 6所示, 其中非采暖期和采暖期OFP前4位均为对, 间-二甲苯、1-丁烯、甲苯和乙苯, 后6位存在差异, 非采暖期为乙炔、正己烷、丙烯以及正丁烷、甲基环戊烷, 采暖期为正己烷、乙炔、二氯丙烯、正丁烷和丙烯. SOAFP占比中, 采暖期和非采暖期前4位均为甲基环戊烷、对, 间-二甲苯、甲苯和乙苯, 但后6位存在差异, 非采暖期为1-己烯、苯、4-乙基甲苯、邻-二甲苯、苯乙烯和反式-2-戊烯, 采暖期为1, 2, 3-三甲苯、间-乙基甲苯、1-己烯、正丙苯、邻-乙基甲苯、苯.其中非采暖期前10位物种OFP总占比为84.8%, SOAFP总占比为98.2%;采暖期前10位物种OFP总占比为77.6%, SOAFP总占比为93.8%.

|
图 6 不同时期O3和SOA的生成潜势贡献前10物种 Fig. 6 Key contributing species to OFP and SOAFP in different periods |
各县区化石燃料燃烧VOCs排放量和OFP及SOAFP占比如图 7, 其中各县区OFP分布顺序和排放量顺序基本一致, 永登县最高、其次为榆中县、西固区、皋兰县、红古区、城关区.对于SOAFP, 永登县最高、其次为榆中县、皋兰县、西固区、红古区、城关区, 这主要是由于城区天然气普及率更高, 天然气燃烧过程中对芳香烃的贡献远小于煤碳, 而SOA的主要前体物就为芳香烃[34, 37, 38].

|
图 7 不同县区化石燃料燃烧源VOCs排放量、OFP和SOAFP的占比 Fig. 7 Emissions and OFP and SOAFP of VOCs from fossil fuel combustion in different areas |
各个区县各个行业化石燃料燃烧排放VOCs的OFP和SOAFP如图 8和图 9所示, 各区县化石燃料燃烧源排放VOCs的OFP和SOAFP中, 城关区、安宁区、七里河区以及兰州新区热力生产供应(煤炭)占比最高; 西固区和红古区电力生产供应行业占比最高; 榆中县和永登县水泥制造业占比最高; 皋兰县砖瓦制造业对该县化石燃料燃烧源排放VOCs的OFP贡献最大, 钢铁冶炼业对该县化石燃料燃烧源排放VOCs的SOAFP贡献最大.结合图 2可知, 各区县各行业化石燃料燃烧源VOCs比重与其相应的OFP和SOAFP的比重存在明显的差别, 单纯的VOCs排放量无法为决策者对区域污染问题提供正确的防控对策.

|
图 8 各县区各行业化石燃料燃烧源排放VOCs的OFP Fig. 8 OFP of VOCs from fossil fuel combustion of different sources in various counties and regions |

|
图 9 各县区各行业化石燃料燃烧源排放VOCs的SOAFP Fig. 9 SOAFP of VOCs from fossil fuel combustion of different sources in various counties and regions |
为进一步研究兰州市化石燃料燃烧源对O3和SOA的生成潜势贡献的空间分布, 对化石燃料燃烧源按照3 km×3 km的网格进行空间分配(如图 10), 其中高值区分布在永登县、榆中县等区域, 并且该区域OFP及SOAFP分布较为分散, 而兰州市主城区相对密集, 主要集中于西固和城关区.为进一步直观分析, 利用Arcgis对O3和SOA贡献较大的企业进行空间管理(图 11), 其中化石燃料燃烧源对O3和SOA贡献较大的企业主要分布于永登县、榆中县、皋兰县和西固区等区域, 行业主要为水泥制造业、钢铁冶炼业和电力生产供应等; 砖瓦制造业主要分布于榆中县、永登县、皋兰县等地, 企业化石燃料燃烧对O3和SOA的生成潜势贡献较小, 但其数量较多, 分布较广, 总体来看, 其影响不容忽视.对于兰州市主城区, 其O3和SOA的生成潜势贡献较大的企业主要分布于西固的工业集中区域, 以电力生产供应行业和石油化工行业为主.

|
图 10 化石燃料燃烧源O3和SOA生成潜势网格化空间分配 Fig. 10 Spatial distribution of OFP and SOAFP of VOCs from fossil fuel combustion |

|
图 11 化石燃料燃烧源OFP和SOAFP主要贡献企业分布 Fig. 11 Distribution of major enterprises' OFP and SOAFP from fossil fuel combustion |
将兰州市化石燃料燃烧源OFP和SOAFP与兰州市生物质燃烧源[39]和移动源[40]进行比较, 结果如图 12所示.移动源OFP和SOAFP最高, 生物质燃烧源OFP高于化石燃料燃烧源, 但化石燃料燃烧源SOAFP略高于生物质燃烧源.相关研究中使用单位VOCs反应生成O3和SOA的量来表示该污染源所对应的O3和SOA的生成能力[36, 37], 兰州市移动源OFP/VOCs和SOAFP/VOCs值最高, 化石燃料燃烧源大于生物质燃烧源, 说明化石燃料燃烧源具有较强的O3和SOA生成能力.

|
图 12 兰州市各VOCs排放源的OFP和SOAFP贡献值及其相应的生成能力 Fig. 12 OFP and SOAFP and the respective VOCs generating capacity from different sources |
(1) 兰州市2016年化石燃料燃烧源VOCs排放量为3067.6t, 排放呈现明显的空间和行业的分布特征, 排放量小于生物质燃烧源和交通源, 但其具有较强的臭氧和二次有机气溶胶的生成能力, 其中芳香烃对O3和SOA生成潜势贡献最大.折为吨标煤天然气燃烧产生VOCs的O3和SOA生成潜势远小于煤炭, 说明用天然气替代燃煤的能源结构调整有利于减少O3和SOA的污染.
(2) 各区县各行业化石燃料燃烧源VOCs占比与其相应的OFP和SOAFP的占比存在明显的差别.对于OFP以及SOAFP而言, 城区主要为热力生产供应(煤炭)以及电力生产供应的贡献, 其它地区为水泥制造业、砖瓦制造业、钢铁冶炼业等高能耗产业的贡献; 从企业空间分布而言, 除主城区外各县区贡献较大的企业均远离城区, 且分布较为分散, 在城区中O3和SOA的生成潜势贡献较大的企业主要分布于西固区, 以电厂和化工企业为主.
| [1] | Gaffney J S, Marley N A. The impacts of combustion emissions on air quality and climate-from coal to biofuels and beyond[J]. Atmospheric Environment, 2009, 43(1): 23-36. DOI:10.1016/j.atmosenv.2008.09.016 |
| [2] |
吴兑. 近十年中国灰霾天气研究综述[J]. 环境科学学报, 2012, 32(2): 257-269. Wu D. Hazy weather research in China in the last decade:a review[J]. Acta Scientiae Circumstantiae, 2012, 32(2): 257-269. |
| [3] | Chan K L, Wang S S, Liu C, et al. On the summertime air quality and related photochemical processes in the megacity Shanghai, China[J]. Science of the Total Environment, 2017, 580: 974-983. DOI:10.1016/j.scitotenv.2016.12.052 |
| [4] | Atkinson R. Atmospheric chemistry of VOCs and NOx[J]. Atmospheric Environment, 2000, 34(12-14): 2063-2101. DOI:10.1016/S1352-2310(99)00460-4 |
| [5] | Yuan B, Hu W W, Shao M, et al. VOC emissions, evolutions and contributions to SOA formation at a receptor site in Eastern China[J]. Atmospheric Chemistry and Physics, 2013, 13(17): 8815-8832. DOI:10.5194/acp-13-8815-2013 |
| [6] | Wang H L, Jing S A, Lou S R, et al. Volatile organic compounds (VOCs) source profiles of on-road vehicle emissions in China[J]. Science of the Total Environment, 2017, 607-608: 253-261. DOI:10.1016/j.scitotenv.2017.07.001 |
| [7] | Li L Y, Chen Y, Zeng L M, et al. Biomass burning contribution to ambient volatile organic compounds (VOCs) in the Chengdu-Chongqing Region (CCR), China[J]. Atmospheric Environment, 2014, 99: 403-410. DOI:10.1016/j.atmosenv.2014.09.067 |
| [8] | Wang H L, Lou S R, Huang C, et al. Source profiles of volatile organic compounds from biomass burning in Yangtze River Delta, China[J]. Aerosol and Air Quality Research, 2014, 14(3): 818-828. DOI:10.4209/aaqr.2013.05.0174 |
| [9] | Mo Z W, Shao M, Lu S H, et al. Process-specific emission characteristics of volatile organic compounds (VOCs) from petrochemical facilities in the Yangtze River Delta, China[J]. Science of the Total Environment, 2015, 533: 422-431. DOI:10.1016/j.scitotenv.2015.06.089 |
| [10] | Jia C H, Mao X X, Huang T, et al. Non-methane hydrocarbons (NMHCs) and their contribution to ozone formation potential in a petrochemical industrialized city, northwest China[J]. Atmospheric Research, 2016, 169: 225-236. DOI:10.1016/j.atmosres.2015.10.006 |
| [11] | Bo Y, Cai H, Xie S D. Spatial and temporal variation of historical anthropogenic NMVOCs emission inventories in China[J]. Atmospheric Chemistry and Physics, 2008, 8(23): 7297-7316. DOI:10.5194/acp-8-7297-2008 |
| [12] | Wang M, Shao M, Lu S H, et al. Evidence of coal combustion contribution to ambient VOCs during winter in Beijing[J]. Chinese Chemical Letters, 2013, 24(9): 829-832. DOI:10.1016/j.cclet.2013.05.029 |
| [13] | Yan Y L, Lin P, Li R M, et al. Concentration, ozone formation potential and source analysis of volatile organic compounds (VOCs) in a thermal power station centralized area:a study in Shuozhou, China[J]. Environmental Pollution, 2017, 223: 295-304. DOI:10.1016/j.envpol.2017.01.026 |
| [14] |
夏思佳, 刘倩, 赵秋月. 江苏省人为源VOCs排放清单及其对臭氧生成贡献[J]. 环境科学, 2018, 39(2): 592-599. Xia S J, Liu Q, Zhao Q Y. Emission inventory of anthropogenically sourced VOCs and its contribution to ozone formation in Jiangsu Province[J]. Environmental Science, 2018, 39(2): 592-599. |
| [15] |
韩丽, 王幸锐, 何敏, 等. 四川省典型人为污染源VOCs排放清单及其对大气环境的影响[J]. 环境科学, 2013, 34(12): 4535-4542. Han L, Wang X R, He M, et al. Inventory and environmental impact of VOCs emission from the typical anthropogenic sources in Sichuan Province[J]. Environmental Science, 2013, 34(12): 4535-4542. |
| [16] |
岳立.兰州市大气污染治理的经济学分析[D].兰州: 兰州大学, 2011. Yue L. An economic analysis on control of air pollution in Lanzhou City[D]. Lanzhou: Lanzhou University, 2011. |
| [17] |
张凯, 于周锁, 高宏, 等. 兰州盆地人为源大气污染物网格化排放清单及其空间分布特征[J]. 环境科学学报, 2017, 37(4): 1227-1242. Zhang K, Yu Z S, Gao H, et al. Gridded emission inventories and spatial distribution characteristics of anthropogenic atmospheric pollutants in Lanzhou valley[J]. Acta Scientiae Circumstantiae, 2017, 37(4): 1227-1242. |
| [18] | 中华人民共和国环境保护部.大气挥发性有机物源排放清单编制技术指南(试行)[EB/OL]. http://www.mee.gov.cn/gkml/hbb/bgg/201408/t20140828_288364.htm, 2014-08-20. |
| [19] | Shi J W, Deng H, Bai Z P, et al. Emission and profile characteristic of volatile organic compounds emitted from coke production, iron smelt, heating station and power plant in Liaoning Province, China[J]. Science of the Total Environment, 2015, 515-516: 101-108. DOI:10.1016/j.scitotenv.2015.02.034 |
| [20] | Stockwell C E, Christian T J, Goetz J D, et al. Nepal ambient monitoring and source testing experiment (NAMaSTE):emissions of trace gases and light-absorbing carbon from wood and dung cooking fires, garbage and crop residue burning, brick kilns, and other sources[J]. Atmospheric Chemistry and Physics, 2016, 16(17): 11043-11081. DOI:10.5194/acp-16-11043-2016 |
| [21] | U.S. Environmental Protection Agency (U.S. EPA). SPECIATE version 4.5 through 4.0[EB/OL]. https://www.epa.gov/air-emissions-modeling/speciate-version-45-through-40, 2016-09. |
| [22] |
卢学强, 韩萌, 冉靓, 等. 天津中心城区夏季非甲烷有机化合物组成特征及其臭氧产生潜力分析[J]. 环境科学学报, 2011, 31(2): 373-380. Lu X Q, Han M, Ran L, et al. Characteristics of nonmethane organic compounds and their ozone formation potentials in downtown Tianjin in summer[J]. Acta Scientiae Circumstantiae, 2011, 31(2): 373-380. |
| [23] | Lam S H M, Saunders S M, Guo H, et al. Modelling VOC source impacts on high ozone episode days observed at a mountain summit in Hong Kong under the influence of mountain-valley breezes[J]. Atmospheric Environment, 2013, 81: 166-176. DOI:10.1016/j.atmosenv.2013.08.060 |
| [24] | Carter W L P. Development of the SAPRC-07 chemical mechanism and updated ozone reactivity scales[R]. California: University of California, 2010. |
| [25] | Zheng J Y, Shao M, Che W W, et al. Speciated VOC emission inventory and spatial patterns of ozone formation potential in the Pearl River Delta, China[J]. Environmental Science & Technology, 2009, 43(22): 8580-8586. |
| [26] |
徐敬, 马建中. 北京地区有机物种人为源排放量及O3生成潜势估算[J]. 中国科学:化学, 2013, 43(1): 104-115. Xu J, Ma J Z. Estimation of anthropogenic emissions and ozone formation potential of speciated VOCs in Beijing area[J]. Scientia Sinica Chimica, 2013, 43(1): 104-115. |
| [27] | Carter W P L. Development of ozone reactivity scales for volatile organic compounds[J]. Journal of the Air & Waste Management Association, 1994, 44(7): 881-899. |
| [28] | Carter W P L. Updated maximum incremental reactivity scale and hydrocarbon bin reactivities for regulatory applications[R]. Sacramento, California: California Air Resources Board, 2010. |
| [29] | Turpin B J, Huntzicker J J, Larson S M, et al. Los Angeles summer midday particulate carbon:primary and secondary aerosol[J]. Environmental Science & Technology, 1991, 25(10): 1788-1793. |
| [30] | Weber R J, Sullivan A P, Peltier R E, et al. A study of secondary organic aerosol formation in the anthropogenic-influenced southeastern United States[J]. Journal of Geophysical Research:Atmosphere, 2007, 112(D13): D13302. DOI:10.1029/2007jd008408 |
| [31] | Barthelmie R J, Pryor S C. Secondary organic aerosols:formation potential and ambient data[J]. Science of the Total Environment, 1997, 205(2-3): 167-178. DOI:10.1016/S0048-9697(97)00200-3 |
| [32] | Grosjean D. In situ organic aerosol formation during a smog episode:estimated production and chemical functionality[J]. Atmospheric Environment. Part A. General Topics, 1992, 26(6): 953-963. DOI:10.1016/0960-1686(92)90027-I |
| [33] | Grosjean D, Seinfeld J H. Parameterization of the formation potential of secondary organic aerosols[J]. Atmospheric Environment, 1989, 23(8): 1733-1747. DOI:10.1016/0004-6981(89)90058-9 |
| [34] |
林旭, 朱彬, 安俊琳, 等. 南京北郊VOCs对臭氧和二次有机气溶胶潜在贡献的研究[J]. 中国环境科学, 2015, 35(4): 976-986. Lin X, Zhu B, An J L, et al. Potential contribution of secondary organic aerosols and ozone of VOCs in the northern suburb of Nanjing[J]. China Environmental Science, 2015, 35(4): 976-986. |
| [35] |
陈小方, 张嘉妮, 张伟霞, 等. 化工园区挥发性有机物排放清单及其环境影响[J]. 中国环境科学, 2017, 37(11): 4062-4071. Chen X F, Zhan J N, Zhang W X, et al. VOCs emission inventory of a chemical industry park and its influence on atmospheric environment[J]. China Environmental Science, 2017, 37(11): 4062-4071. DOI:10.3969/j.issn.1000-6923.2017.11.007 |
| [36] |
GB/T 2589-2008, 综合能耗计算通则[S]. GB/T 2589-2008, General principles for calculation of the comprehensive energy consumption[S]. |
| [37] |
杨笑笑, 汤莉莉, 胡丙鑫, 等. 南京城区夏季大气VOCs的来源及对SOA的生成研究——以亚青和青奥期间为例[J]. 中国环境科学, 2016, 36(10): 2896-2902. Yang X X, Tang L L, Hu B X, et al. Sources apportionment of volatile organic compounds VOCs in summertime Nanjing and their potential contribution to secondary organic aerosols (SOA)[J]. China Environmental Science, 2016, 36(10): 2896-2902. DOI:10.3969/j.issn.1000-6923.2016.10.003 |
| [38] |
虞小芳, 程鹏, 古颖纲, 等. 广州市夏季VOCs对臭氧及SOA生成潜势的研究[J]. 中国环境科学, 2018, 38(3): 830-837. Yu X F, Cheng P, Gu Y G, et al. Formation potential of ozone and secondary organic aerosol from VOCs oxidation in summer in Guangzhou[J]. China Environmental Science, 2018, 38(3): 830-837. DOI:10.3969/j.issn.1000-6923.2018.03.004 |
| [39] |
郭文凯, 刘镇, 刘文博, 等. 兰州生物质燃烧VOCs排放特征及其大气环境影响[J]. 中国环境科学, 2019, 39(1): 40-49. Guo W K, Liu Z, Liu W B, et al. The characteristics of VOCs emission from biomass burning and its influence on atmospheric environment in Lanzhou City[J]. China Environmental Science, 2019, 39(1): 40-49. |
| [40] |
刘晓, 陈强, 郭文凯, 等. 移动源排放VOCs特征及臭氧生成潜势研究——以兰州市为例[J]. 环境科学学报, 2018, 38(8): 3220-3228. Liu X, Chen Q, Guo W K, et al. Emission characteristics and ozone formation potential of VOCs from mobile sources:a pilot study in Lanzhou[J]. Acta Scientiae Circumstantiae, 2018, 38(8): 3220-3228. |