 2019, Vol. 40


全氟烷基化合物(perflurorinated alkylated substances, PFASs)是一类人工合成的直链或支链有机氟化物, 因其独特的化学稳定性、热稳定性、高表面活性和疏水疏油性质, 被广泛用于食品包储材料、造纸、纺织品、洗涤剂、皮革、食品接触材料等生活消费的产品[1~3].工业生产中大量使用和持续排放到环境中的PFASs, 会通过食物链的传递放大效应在生物体内富集[4]. PFASs以其环境持久性、高生物蓄积性和多种毒性效应, 呈现出全球性生态系统污染的趋势, 已成为一类新型有机污染物[5], 对人体健康具有潜在危害而引起国际社会的高度关注[6]. 2009年9月5日联合国环境规划署日内瓦会议上, 将全氟辛烷磺酸(盐)和全氟辛基磺酰氟列入《斯德哥尔摩公约》管控物质名单, 限制其在全球范围内的使用[7]. 2010年3月17日欧盟委员会颁布2010/161/EU号议案, 提议对动物源食品中的PFASs进行监控[8].
国内关于PFASs的污染状况研究, 多围绕环境水体、表层沉积物和土壤等中的时空分布和污染特征方面展开[9~14], 而鸡蛋[15]、动物肝脏[16]和水产品[17, 18]中以PFASs检测方法的研究报道为主.目前, 国外许多学者研究了天然湖泊和海域中野生鱼类和市售水产品中PFASs的残留特征和污染水平.瑞典维纳恩湖、波罗海域鱼类[19]、西班牙加泰罗尼亚地区的水产品[20]、地中海区域[21]以及德国野生鱼类[22],含量水平最高的PFASs组分都是PFOS,而PFOA的含量相对较低.国内有研究人员调查了珠三角部分城市的海捕鱼类、贝类等水产品[23~25]以及西沙群岛和黄岩岛周围珊瑚礁区域鱼类[26]中PFASs的污染特征. PFOS在海捕鱼和贻贝中检出率和含量相对较高, 为南海区域特征性的PFASs组分.
本文旨在对广州市售的水产品(鱼类、贝类、甲壳类、头足类、海珍品和加工制品)中23种PFASs的污染分布特征和样品种类污染差异性作初步研究, 并评估了水产品中PFOA和PFOS的食用安全风险.
1 材料与方法 1.1 样品采集与制备2017年8~10月, 从广州市的批发市场、农贸市场和超市, 采集了鱼类、贝类、甲壳类、头足类、海珍品和加工制品等6类254个样品.鱼类样品沿背脊两侧取肌肉部分, 刮鳞片、去皮; 虾去除头、尾、壳及肠腺, 取肌肉部分; 蟹只取可食部分; 贝类开壳, 取软体组织(含内脏).将样品切块, 用绞肉机制成肉泥状, -20℃保存.加工制品剪碎, 研磨成粉末状, 4℃保存.
1.2 仪器与试剂Acquity I-Class/Xevo TQS超高效液相色谱串联三重四级杆质谱仪(美国Waters公司); 高速冷冻离心机Micro 21(美国Thermo公司); MS3旋涡混合器(德国IKA公司); 超纯水制备仪(美国Millipore公司); N-EVAP氮吹仪(美国Organomation公司).
全氟丁酸(PFBA)、全氟戊酸(PFPeA)、全氟己酸(PFHxA)、全氟庚酸(PFHpA)、全氟辛酸(PFOA)、全氟壬酸(PFNA)、全氟癸酸(PFDA)、全氟十一烷酸(PFUdA)、全氟十二烷酸(PFDoA)、全氟十三烷酸(PFTrDA)、全氟十四烷酸(PFTeDA)、全氟十八烷酸(PFODA)、全氟丁烷磺酸(PFBS)、全氟己烷磺酸(PFHxS)、全氟庚酸磺酸(PFHpS)、全氟辛酸磺酸(PFOS)、全氟辛烷磺酰胺(PFOSA)、N-甲基全氟辛烷磺酰胺(N-MeFOSA)、N-乙基全氟辛烷磺酰胺(N-EtFOSA)、N-甲基全氟辛烷磺酰胺乙醇(N-MeFOSE)、N-乙基全氟辛烷磺酰胺乙醇(N-EtFOSE)和内标物13C4-全氟辛酸(MPFOA)、13C4-全氟辛烷磺酸(MPFOS)和13C8-全氟辛烷磺酰胺(M8FOSA)均由Wellington Labortories公司生产(50 μg·mL-1); 甲酸、乙腈及乙酸铵(色谱纯)购自美国Thermo Fisher公司; C18吸附剂(50 μm)购自天津博纳艾杰尔科技有限公司; 石墨化炭黑(120~140目)购自德国CNW科技有限公司; 氯化钠、无水硫酸镁(分析纯)购自广州化学试剂厂; 实验用水为Milli-Q超纯水.
1.3 样品前处理 1.3.1 提取准确称取(5.00±0.05)g样品, 于50 mL聚丙烯离心管中, 加入内标物各10 ng, 再加入5 mL超纯水, 漩涡混合.加入10 mL 2%甲酸乙腈溶液, 高速均质1 min, 再加入5 g无水硫酸镁、1 g氯化钠, 立刻漩涡混合(避免硫酸镁结块), 8 000 r·min-1冷冻离心5 min.转移上清液至15 mL聚丙烯离心管中, 待净化.
1.3.2 净化准确称取1.5 g无水硫酸镁、200 mg C18填料和100 mg石墨化炭黑, 于装有待净化提取液的15 mL离心管中, 漩涡混合1 min, 室温静置5 min, 8 000 r·min-1离心10 min.净化后的提取液, 40℃水浴, 氮气吹干, 1 mL甲醇:5 mmol·L-1乙酸铵水溶液(1:1, 体积比)溶解, 12 000 r·min-1高速冷冻离心15 min, 过0.22 μm滤膜, UPLC-MS/MS测定.
1.4 测定条件 1.4.1 色谱条件色谱柱:Phenomenex Kinetex C18(100 mm×2.1 mm, 1.7 μm); 柱温:40℃; 进样量:10 μL; 流速:0.4 mL·min-1; 流动相:含0.1%甲酸的5 mmol·L-1乙酸铵溶液(A)和乙腈(B).梯度洗脱程序:0~0.8 min, 5% A; 0.8~2.5 min, 5%~90% A; 2.5~3.5min, 90% A; 3.5~3.6 min, 90%~5% A; 3.6~5 min, 5% A.
1.4.2 质谱条件离子源:电喷雾电离(ESI); 扫描方式:负离子扫描; 离子源温度:120℃; 毛细管电压:3.0 kV; 脱溶剂气温度:350℃; 脱溶剂气流量:750 L·h-1; 碰撞气流速:0.15 mL·min-1, 锥孔反吹气流量:150 L·h-1; 监测方式:多反应监测(multiple-period MRM), 详细参数见表 1.
|
|
表 1 目标分析物MRM质谱采集参数1) Table 1 MRM parameters of the targeted analytes |
1.5 质量控制
为防止实验过程引入过高的背景值, 避免使用聚四氟乙烯材质的色谱管路和器皿, 更换色谱管路为PEAK管或不锈钢材质管路[18, 27].液相系统混合器和进样器之间串联一根与色谱分离相同填料的短柱, 来捕集延迟液相系统背景干扰.控制样品前处理过程可能带入的外源性污染, 考察试剂空白中各待测物的含量, 发现低于检出限, 对样品定量结果无干扰.以20个样品为1批次, 每批次样品测定时, 做空白样品加标实验, 采用至少5个质量浓度点标准曲线校正, 同位素内标法定量. 23种PFASs的加标回收率为62.5%~117%, 相对标准偏差为5.3%~14.0%, 标准曲线线性相关系数大于0.99, 满足样品分析要求.
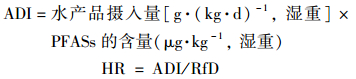
1.6 安全风险评价人体暴露于PFASs的健康风险通过危害指数(hazard ratios, HR)评价, HR是人体对食品的平均日摄入量(average daily intake, ADI)与PFASs参考剂量值(reference dose, RfD)的比值[28].目前, 除了PFOS和PFOA, 其它的PFASs组分还没有标准参考剂量值.本研究按照美国环境保护署(US EPA)规定的致癌因子及RfD来评估广州市售水产品中PFOS和PFOA的潜在健康风险.
具体评价公式为:
|
式中, HR>1, 表明人体暴露污染物具有潜在健康风险; HR<1则表明健康风险较低.
2 结果与讨论 2.1 PFASs的污染特征 2.1.1 总体检出情况调查的254份样品中检出了13种PFASs组分(检出限均为0.01 μg·kg-1), 包括10种全氟烷基羧酸(PFBA、PFHpA、PFHxA、PFOA、PHNA、PFDA、PFUdA、PFDoA、PFTrDA、PFTeDA)、2种全氟烷基磺酸(PFBS和PFOS)和1种全氟烷基磺酰胺(PFOSA), 见表 2.其余10种PFASs组分未检出.
|
|
表 2 PFASs的总体检出结果 Table 2 Total detection results of the PFASs |
PFOA和PFOS的检出率明显高于其它PFASs组分, 分别为75.6%和76.8%, 样品中最高含量分别为2.03和15.80 μg·kg-1.检出率较高的组分有PFBA(40.2%)、PFDA(52.0%)、PFNA(66.5%)、PFTrDA(48.0%)、PFOSA(56.7%)和PFUdA(63.4%); 其它PFASs组分的检出率为11.0%~23.6%.
检出的13种PFASs中, PFOS除检出率最高外, 其含量介于0.01~15.80 μg·kg-1, 平均为0.99 μg·kg-1, 检出总量(ΣPFOS)达192.27 μg·kg-1, 明显高于其它组分, 为主要污染物. PFOA的检出率虽较高, 但含量较低, 为0.01~2.03 μg·kg-1, 平均含量仅为0.08 μg·kg-1, ΣPFOA为16.17 μg·kg-1.其余11种组分的平均含量为0.07~0.38 μg·kg-1, ΣPFAS单组分为3.07~63.47 μg·kg-1, 且含量最高的多为加工制品, 提示加工过程中可能引入PFASs污染.
2.1.2 污染物组分特征13种PFASs占检出总量的质量分数见图 1, 从高到低顺序为:PFOS(35.15%)>PFHxA(11.60%)>PFUdA(10.25%)>PFNA(8.54%)>PFTrDA(8.28%)>PFDA(7.22%)>PFOSA(4.77%)>PFBA(4.23%)>PFBS(3.94%)>PFOA(2.96%)>PFDoA(1.22%)>PFTeDA(1.03%)>PFHpA(0.81%). PFOS的污染贡献率最高, 达35.15%, 远高于其它组分, 为PFASs的特征污染因子.

|
图 1 污染物组分所占质量分数 Fig. 1 Percentages of the contamination components |
用SPSS 19.0软件对样品中检出组分的含量相关性进行统计分析, 使用Spearman相关系数来分析主要污染物组分PFOA、PFOS和PFOSA与其它12种PFASs组分含量的相关性(见表 3).样品含量以湿重计, PFOA与10种组分(PFBA和PFHpA除外)呈现明显的相关性, PFOS与11种组分(PFHpA除外)存在明显的相关性, 而PFOSA则与除PFBA外的11种组分存在明显的相关性. PFOS与PFOA、PFOSA呈现极显著的正相关性, 说明这些样品可能遭受该区域相同来源PFASs的暴露污染[24, 25].
|
|
表 3 PFASs组分单体间的相关性1) Table 3 Spearman correlation analysis for the PFASs components |
2.2 样品种类污染特征差异性 2.2.1 样品总体检出差异性
23种PFASs在6类水产品中检出的种类、含量最高的组分和总检出率存在差异(见表 4).检出PFASs组分种类的顺序为:鱼类、甲壳类(13种)>头足类(12种)>加工制品(11种)>贝类(10种)>海珍品(鲍鱼)(6种).除加工品外, 其它种类样品的总检出率均为100%.鱼类、甲壳类和头足类中含量最高的组分均为PFOS, 贝类、海珍品和加工品中则分别为PFHxA、PFBA和PFDA.
|
|
表 4 各类样品PFASs的检出结果 Table 4 Detection results of PFASs in the various species sampled |
6类样品单个组分的含量, 包括检出总量(ΣPFAS)与平均含量, 除海珍品中含量最高的是ΣPFBA(3.00 μg·kg-1)、贝类中最高的是ΣPFHxA(6.46 μg·kg-1)外, 其它4类样品含量最高的均为ΣPFOS(见表 5).鱼类和甲壳类中PFHxA、PFNA、PFDA、PFUdA和PFTrDA等5种组分的检出总量高于其它类别样品, PFBS则在贝类中的含量明显高于其它5类样品(见图 2).
|
|
表 5 各类样品PFASs组分的平均含量和检出总量/μg·kg-1 Table 5 Average concentrations and ΣPFAS of the PFASs components in the various species sampled/μg·kg-1 |

|
图 2 各类样品中的污染物组分平均含量 Fig. 2 Average pollution levels of contaminates in the various species sampled |
如图 3所示:鱼类、甲壳类、头足类和加工制品污染物总量贡献率最高的是PFOS, 分别为35.64%、39.27%、35.08%和29.59%;其次是PFUdA, 其在4类样品的污染贡献率也分别达到11.77%、9.63%、12.00%和6.86%; PFTrDA的污染贡献率也较高, 分别为7.61%、8.00%、14.58%和9.72%.

|
图 3 各类样品中的污染物组分贡献率 Fig. 3 Percentage of contaminants in various species sampled |
贝类中, PFHxA的污染贡献率最高, 达69.31%, 其次为PFBS的13.84%和PFOSA的8.15%.相比之下, 在其它样品中污染贡献率最高的PFOS, 其在贝类中只有3.76%.
海珍品中, PFBA的污染贡献率最高, 为44.25%, 其次是PFHpA的26.11%和PFOS的21.39%, 3种组分的污染贡献率达91.75%.
2.3 与国内外研究情况的比较Bergera等[19]发现维纳恩湖和波罗地海的鱼类都检出了PFASs, 含量最高的是PFOS, 并且维纳恩湖鱼类的污染浓度高于波罗地海. Domingo等[20]对西班牙加泰罗尼亚地区水产品中PFASs进行研究, 检测出7种PFASs, 污染浓度最高的也是PFOS. Schuetze等[21]和Nania等[22]分别检测了德国和地中海野生鱼类中PFASs的污染水平, 发现PFOA的含量都比较低.
国内方面, Gulkowska等[23]检测了广州和舟山海捕水产品中PFASs的含量, 所有样品均检出了PFOS, 含量为0.30~13.9 μg·kg-1, 表明PFOS为主要PFASs污染组分. Wu等[24]比较了沿黄渤海、东海和南海海域6省份脂质鱼和贝类中13种PFASs的污染情况, 广东的带鱼中PFOS的含量最高, 为1.04 μg·kg-1. Zhao等[25]研究了珠三角流域部分城市贻贝和牡蛎中9种PFASs的分布特征, 检出了6种组分, 均包括PFOS和PFBA, PFOA的检出率虽比较低, 但含量高于PFOS和PFBA.
上述PFASs污染特征研究多集中于鱼类和贝类, 本研究的调查对象扩展至6类水产品, 检出的PFASs种类和数量也明显更多, 可能与本研究监测的PFASs数量(23种)有关. PFOS为含量较高的组分, PFOA检出率高、含量低, 与之前的研究相同.本研究中PFOS最高含量为15.80 μg·kg-1, 与Gulkowska等[23]对广州海捕产品检出的13.9 μg·kg-1接近, 而与Wu等[24]和Zhao等[25]对珠三角其它城市样品中检出的1.04和1.47 μg·kg-1差异较大, 体现了珠三角不同城市PFASs污染的区域性差异.
2.4 安全风险评价US EPA规定PFOS和PFOA的RfD[28]分别为0.025 μg·(kg·d)-1和0.333 μg·(kg·d)-1, 2015年中国每年人均水产品消费量为11.2 kg[29], 亚洲人的平均体重是60 kg, 将测得的PFOS和PFOA平均含量代入1.6节的公式, 计算得到PFOS和PFOA的HR为9.21×10⁻⁵~2.37×10⁻², 均远小于1, 说明此次调查的样品中, PFOA和PFOS对人的潜在健康风险低.
3 结论(1) 广州市售水产品中共检出PFOS和PFOA等13种PFASs组分.各个组分的总检出率为11.0%~76.8%, 含量最高为15.80 μg·kg-1. PFOS的总检出率最高(76.8%), 平均含量为0.99 μg·kg-1, 检出总量的污染贡献率达35.15%.
(2) 6类样品中PFASs总检出率为93.5%~100%, 检出的PFASs种类、单组分含量及特征污染组分等存在明显的样品差异性.鱼类、甲壳类、头足类和加工制品的特征污染组分是PFOS, 而贝类和海珍品则分别是PFHxA和PFBA.
(3) 人体健康安全风险评价结果表明:因食用此次调查的水产品而摄入PFOA和PFOS, 潜在健康风险低.
| [1] |
何建丽, 彭涛, 谢洁, 等. 固相萃取-液相色谱-串联质谱法测定食品包装材料中16种全氟烷基类化合物[J]. 色谱, 2016, 34(7): 708-714. Heng J L, Peng T, Xie J, et al. Determination of 16 perfluorinated alkyl substances in food packaging materials by solid phase extraction-liquid chromatography-tandem mass spectometry[J]. Chromaogarphy, 2016, 34(7): 708-714. |
| [2] |
郑建国, 刘葳, 张子豪, 等. 高效液相色谱-串联质谱法测定纺织品中16种全氟烷酸类化合物[J]. 分析测试学报, 2016, 35(2): 213-218. Zheng J G, Liu W, Zhang Z H, et al. Determination of 16 perfluoroalkyl acids in textiles by HPLC-MS/MS[J]. Journal of Instrumental Analysis, 2016, 35(2): 213-218. DOI:10.3969/j.issn.1004-4957.2016.02.013 |
| [3] |
陈笑梅, 刘慧婷, 谢维斌, 等. 食品接触材料中全氟烷基磺酸类化合物的HPLC-MS/MS测定[J]. 食品科学, 2010, 31(8): 174-176. Chen X M, Liu H T, Xie W B, et al. HPLC-MS/MS determination of perfluoroalkane sulfonates in food contact materials[J]. Food Science, 2010, 31(8): 174-176. |
| [4] | Wei Y H, Dai J Y, Liu M, et al. Estrogen-like properties of perfluorooctanoic acid as revealed by expressing hepatic estrogen-responsive genes in rare minnows (Gobiocypris rarus)[J]. Environmental Toxicology Chemistry, 2007, 26(11): 2440-2447. DOI:10.1897/07-008R1.1 |
| [5] | Johansson N, Fredriksson A, Eriksson P. Neonatal exposure to perfluorooctane sulfonate (PFOS) and perfluorooctanoic acid (PFOA) causes neurobehavioural defects in adult mice[J]. NeuroToxicology, 2008, 29(1): 160-169. DOI:10.1016/j.neuro.2007.10.008 |
| [6] | Zheng L, Dong G H, Jin Y H, et al. Immunotoxic changes associated with a 7-day oral exposure to perfluorooctanesulfonate (PFOS) in adult male C57BL/6 mice[J]. Archives of Toxicology, 2009, 83(7): 679-689. DOI:10.1007/s00204-008-0361-3 |
| [7] |
崔晓宇, 张鸿, 罗骥, 等. 深圳地区全氟辛烷磺酸的环境多介质迁移和归趋行为研究[J]. 环境科学, 2016, 37(8): 3001-3006. Cui X Y, Zhang H, Luo J, et al. Simulation of multimedia transfer and fate of perfluorooctane sulfonate (PFOS) in Shenzhen Region[J]. Environmental Science, 2016, 37(8): 3001-3006. |
| [8] | European Food Safety Authority. Results of the monitoring of perfluoroalkylated substances in food in the period 2000-2009[J]. EFSA Journal, 2011, 9(2): 2016. |
| [9] |
杨永亮, 路国慧, 杨伟贤, 等. 沈阳地区水环境和生物样品中全氟化合物的污染分布特征[J]. 环境科学学报, 2010, 30(10): 2097-2107. Yang Y L, Luo G H, Yang W X, et al. Levels and distribution of perfluorinated compounds in water and biological samples from the Shenyang area[J]. Acta Scientiae Circumstantiae, 2010, 30(10): 2097-2107. |
| [10] |
王超, 吕怡兵, 陈海君, 等. 固相萃取-液相色谱-串联质谱法同时测定水中14种短链和长链全氟化合物[J]. 色谱, 2014, 32(9): 919-925. Wang C, Lv Y B, Chen H J, et al. Simultaneous analysis of 14 short-and long-chain perfluorinated compounds in water by liquid chromatography-tandem mass spectrometry using solid phase extraction[J]. Chinese Journal of Chromatography, 2014, 32(9): 919-925. |
| [11] |
李法松, 倪卉, 黄涵宇, 等. 安徽省部分城市土壤中全氟化合物空间分布及来源解析[J]. 环境科学, 2017, 38(1): 327-332. Li F S, Ni H, Huang H Y, et al. Spatial distribution and source of perfluorinated compounds in urban soil from part of cities in Anhui province, China[J]. Environmental Science, 2017, 38(1): 327-332. |
| [12] |
刘庆, 贺德春, 许振成, 等. 液相色谱-串联质谱法测定水体、沉积物及土壤中全氟化合物[J]. 中国环境监测, 2010, 30(4): 134-139. Liu Q, Tang D C, Xu Z C, et al. Analysis of Polyfluoroalkyl chemicals in water, sediments and soil by liquid chromatography-tandem mass spectrometry[J]. Environmental Monitoring in China, 2010, 30(4): 134-139. |
| [13] |
王懿, 孔德洋, 单正军, 等. 加速溶剂萃取-固相萃取净化-超高效液相色谱串联质谱法测定土壤中11种全氟化合物[J]. 环境化学, 2012, 31(1): 113-119. Wang Y, Kong D X, Shan Z J, et al. Analysis of perfluorinated compounds in soil by accelerated solvent extraction combined with ultra performance liquid chromatographytandem mass spectrometry[J]. Environmental Chemisty, 2012, 31(1): 113-119. |
| [14] |
孟晶, 王铁宇, 王佩, 等. 淮河流域土壤中全氟化合物的空间分布及组成特征[J]. 环境科学, 2013, 34(8): 3188-3194. Meng J, Wang T Y, Yang P, et al. Spatial distribution and composition of perfluorinated compounds in soils around the Huaihe River[J]. Environmental Science, 2013, 34(8): 3188-3194. |
| [15] |
李静, 张鸿, 柴之芳, 等. 分散固相萃取结合HPLC-MS/MS检测鸡蛋中16种全氟化合物[J]. 分析测试学报, 2014, 33(10): 1109-1115. Li J, Zhang H, Chai Z F, et al. Determination of sixteen perfluorinated compounds in egg by high performance liquid chromatography-tandem mass spectrometry combined with dispersive solid phase extraction[J]. Journal of Instrumental Analysis, 2014, 33(10): 1109-1115. DOI:10.3969/j.issn.1004-4957.2014.10.003 |
| [16] |
何建丽, 彭涛, 谢洁, 等. 高效液相色谱-串联质谱法测定动物肝脏中20种全氟烷基类化合物[J]. 分析化学, 2015, 43(1): 40-48. He J L, Peng T, Xie J, et al. Development of a Qu ECh ERs method for determination of 20perfluorinated compounds in animal liver by HPLC-MS/MS[J]. Chinese Journal of Analytical Chemistry, 2015, 43(1): 40-48. |
| [17] |
郭萌萌, 吴海燕, 李兆新, 等. 超快速液相色谱-串联质谱法检测水产品中23种全氟烷基化合物[J]. 分析化学, 2013, 41(9): 1322-1327. Guo M M, Wu H Y, Li Z X, et al. Determination of 23 perfluorinated alkyl substances in Fishery products by ultra fast liquid chromatography tandem mass spectrometry[J]. Chinese Journal of Analytical Chemistry, 2013, 41(9): 1322-1327. |
| [18] |
郭萌萌, 吴海燕, 卢立娜, 等. 杂质延迟-液相色谱-四极杆/离子阱复合质谱测定水产加工食品中23种全氟烷基化合物[J]. 分析化学, 2015, 43(8): 1105-1112. Guo M M, Wu H Y, Lu L N, et al. Simultaneous identification and detection of 23 perfluorinated alkyl substances in processed aquatic products by impurity delay using liquid chromatography coupled with quadrupole/linear ion trap mass spectrometry[J]. Chinese Journal of Analytical Chemistry, 2015, 43(8): 1105-1112. |
| [19] | Berger U, Glynn A, Holmstrom K E, et al. Fish consumption as a source of human exposure to perfluorinated alkyl substances in Sweden-Analysis of edible fish from Lake Vättern and the Baltic Sea[J]. Chemosphere, 2009, 76(6): 799-804. DOI:10.1016/j.chemosphere.2009.04.044 |
| [20] | Domingo J L, Ericson-Jogeten I, Perelló G, et al. Human exposure to perfluorinated compounds in Catalonia, Spain:contribution of drinking water and fish and shellfish[J]. Journal of Agriculture and Food Chemistry, 2012, 60(17): 4408-4415. DOI:10.1021/jf300355c |
| [21] | Schuetze A, Heberer T, Effkemann S, et al. Occurrence and assessment of perfluorinated chemicals in wild fish from Northern Germany[J]. Chemosphere, 2010, 78(6): 647-652. DOI:10.1016/j.chemosphere.2009.12.015 |
| [22] | Nania V, Pellegrini G E, Fabrizi L, et al. Monitoring of perfluorinated compounds in edible fish from the Mediterranean Sea[J]. Food Chemistry, 2009, 115(3): 951-957. DOI:10.1016/j.foodchem.2009.01.016 |
| [23] | Gulkowska A, Jiang Q T, So M K, et al. Persistent perfluorinated acids in seafood collected from two cities of China[J]. Environmental Science & Technology, 2006, 40(12): 3736-3741. |
| [24] | Wu Y N, Wang L X, Li J G, et al. Perfluorinated compounds in seafood from coastal areas in China[J]. Environment International, 2012, 42: 67-71. DOI:10.1016/j.envint.2011.04.007 |
| [25] | Zhao Y G, Wan H T, Wong M H, et al. Partitioning behavior of perfluorinated compounds between sediment and biota in the Pearl River Delta of South China[J]. Marine Pollution Bulletin, 2014, 83(1): 148-154. DOI:10.1016/j.marpolbul.2014.03.060 |
| [26] | Pan C G, Yu K F, Wang Y H, et al. Species-specific profiles and risk assessment of perfluoroalkyl substances in coral reef fishes from the South China Sea[J]. Chemosphere, 2018, 191: 450-457. DOI:10.1016/j.chemosphere.2017.10.071 |
| [27] |
张明, 唐访良, 俞雅雲, 等. 杭州地区城区降雪中全氟化合物的污染特征[J]. 环境科学, 2018, 38(8): 3185-3191. Zhang M, Tang F L, Yu Y Y, et al. Perfluorinated compounds in snow from downtown Hangzhou, China[J]. Environmental Science, 2018, 38(8): 3185-3191. |
| [28] |
齐彦杰, 周珍, 史亚利, 等. 北京市市售鸡蛋和鸭蛋中全氟化合物的污染水平研究[J]. 环境科学, 2013, 34(1): 244-250. Qi Y J, Zhou Z, Shi Y L, et al. Pollution levels of perfluorochemicals in chicken eggs and duck eggs from the markets in Beijing[J]. Environmental Science, 2013, 34(1): 244-250. |
| [29] |
岳冬冬, 王鲁民, 方海, 等. 中国城乡居民水产品消费量与收入差距关系研究[J]. 渔业信息与战略, 2018, 33(1): 1-8. Yue D D, Wang L M, Fang H, et al. On the relationship between aquatic products consumption and income gap of urban and rural households in China[J]. Fishery Information & Strategy, 2018, 33(1): 1-8. |