 2018, Vol. 39

2. 中国科学院长沙农业环境观测研究站, 长沙 410125;
3. 中国科学院大学, 北京 100049
 , WANG Jie-fei1,2,3 , SHEN Jian-lin1,2
 , XIAO Run-lin1,2 , WANG Juan1,2 , WU Jin-shui1,2 , LI Yong1,2
2. Changsha Research Station for Agricultural & Environmental Monitoring, Institute of Subtropical Agriculture, Chinese Academy of Sciences, Changsha 410125, China;
3. University of Chinese Academy of Sciences, Beijing 100049, China
近几十年来, 伴随我国经济的快速发展, 畜禽养殖数量、化学氮肥使用量以及化肥燃料消耗量不断增加, 从而导致排放到大气中的氨气(NH3)及氮氧化合物(NOx)也呈持续激增的态势[1].排放到大气中的NH3和NOx及其二次反应的衍生物(如HNO3、颗粒态NH4+和NO3-), 最终将通过干湿沉降返回到陆地和水生生态系统中, 可导致土地、水体酸化和水体富营养化[2], 降低生态系统生产力[3], 并影响农田、森林、草地等生态系统的结构稳定性和功能稳定性[4], 造成生态系统多样性丧失等一系列全球性生态问题[5]. Holland等[6]基于观测数据运用模型模拟表明, 2006~2008年美国大陆的氮沉降量为3.7~4.5 Tg·a-1, 西欧的氮沉降量为8.4~10.8Tg·a-1, Lu等[7]在2014年的研究结果表明中国区域总氮沉降量在21世纪初为18.3 Tg·a-1.现有结果表明中国地区氮沉降量已超过欧洲与北美地区, 成为氮沉降最严重的区域.同时, 中国区域氮沉降时空格局模拟研究表明, 1961~2010年的50年内, 中国陆地大气氮沉降速率由0.29 g·(m2·a)-1增长到2.32 g·(m2·a)-1, 增加近8倍[8].这些研究表明, 大气氮沉降已成为我国陆地和水生生态系统氮素的重要来源.
大气氮沉降主要包括干沉降和湿沉降[9].大气氮湿沉降是指在重力作用下, 水溶性或颗粒态氮被雨雪溶解或冲刷至地面的过程[10].大气干沉降是指大气中的气态和颗粒态氮在没有降雨事件情况下, 以气体、气溶胶或降尘的形式直接沉降到地表的现象[11].大气混合沉降是指采用一直敞口的雨量器或雨量筒收集的大气湿沉降, 由于在未下雨期间, 雨量筒会接收部分干沉降, 因此混合沉降即混合有部分干沉降的湿沉降[12].我国亚热带区域是我国工业、农业和交通运输业均十分发达的区域, 在高的活性氮排放下, 大气氮沉降量也较高[13, 14].据Kuang等[15]对四川盐亭农田的大气氮沉降研究表明, 该地区的大气湿沉降量为16.7 kg·(hm2·a)-1, 郑祥洲等[16]对闽西北农田生态系统中氮沉降研究表明该地区的氮素年湿沉降(实为混合沉降)总量平均值为12.7 kg·(hm2·a)-1.孙素琪等[17]监测到重庆缙云山林地大气湿沉降量为11.5 kg·(hm2·a)-1, Fang等[18]在广东肇庆森林测得大气湿沉降(实为混合沉降)总量为16.2~38.2 kg·(hm2·a)-1.目前的研究多针对较为单一的生态系统, 且都集中在干沉降或湿沉降, 甚至有部分学者用混合沉降代替湿沉降, 一定程度上造成对研究区域的大气氮湿沉降结果的高估[19~21].我国虽然从20世纪70年代末以来就已经陆续开展了氮素沉降的监测工作, 但对不同土地利用类型的氮湿沉降与混合沉降进行比较的报道还比较少见, 本研究通过对湖南亚热带地区农田与林地大气活性氮湿、混合沉降量的监测, 评价两种方法监测的氮素沉降的差别, 并建立一种采用混合沉降来估算湿沉降的方法, 以期为全国氮沉降状况提供基础数据.
1 材料与方法 1.1 采样点概况采样点位于湖南省长沙市东北约70 km的长沙县金井镇境内的金井河流域内, 金井河为湘江支流捞刀河的支流, 金井河流域总面积约135 km2, 海拔43~460 m, 地势北高南低, 流域内年平均降雨量1 200~1 500 mm, 主要集中在4~10月, 年平均气温17.5℃, 年日照时数1 663 h, 无霜期274 d, 是典型亚热带红壤丘陵地貌.流域内主要有稻田、林地、茶园等土地利用方式, 分别占流域面积的26.5%、65.5%和2.4%[22].本研究分别在流域内主要土地方式下的一成片稻田区域(惠农点, HN)和连片林地区域(西山点, XS)设置湿沉降和混合沉降监测点.稻区面积20 hm2(HN), 主要种植双季稻, 年施肥量360 kg·(hm2·a)-1.林区面积50 hm2(XS), 海拔80~400 m, 主要为马尾松次生林.
1.2 样品采集本研究在HN和XS开展完整的2 a(2011年3月至2013年2月)大气氮湿沉降与混合沉降监测.在两个样地内分别设置湿沉降采样器和混合沉降采样器各一台, 固定在距地面1.5 m处.稻田采样点设置在稻区的中心(HN), 林地采样点设置在林区中部一水库边的空地上(XS), 以方便连接交流电.大气湿沉降降雨收集采用I-5020型智能采样器(青岛崂应, 中国), 该仪器采用微电脑控制, 降雨开始后采样器自动打开收集, 雨停立即封盖, 使样品不受干沉降影响.大气混合沉降雨水收集采用SDM6雨量器(天津气象仪器厂, 中国), 收集口与储存瓶之间加设纱网, 避免鸟粪等其他固态颗粒杂质落入污染样品.于每次降雨后当日或次日08:00收集, 记录降雨量, 采集时将雨水摇匀, 取500 mL水样装入聚乙烯样品瓶中, 不足500 mL的全部带回, 于-18℃条件下保存并于两个月内完成化学分析.
1.3 样品分析样品测定项目包括总氮(TN)、硝态氮(NO3--N)、铵态氮(NH4+-N)和可溶性有机氮(DON).样品在室温下解冻, 用0.45μm的微孔滤膜过滤, NH4+-N、NO3--N直接采用流动分析仪测定(Auto Analyzer 3, SEAL Analytical, 德国), TN经碱性过硫酸钾消解后转化为NO3--N, 采用流动分析仪测定.利用TN与NH4+-N、NO3--N的差值计算DON.
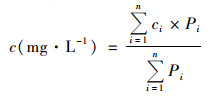
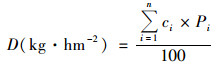
1.4 数据处理通过对原始数据分析整理, 采用Office 2010、SPSS和Origin软件对数据资料进行分析处理.降雨中NH4+-N和NO3--N的月平均浓度则利用每次降雨中的N素浓度结合降雨量体积加权平均表示, 湿、混合沉降中N的月或年浓度(c)和沉降量(D)分别根据公式(1)和公式(2)计算:
|
(1) |
|
(2) |
式中, ci为每次降雨中的N素浓度(mg·L-1), Pi为每次降雨的降雨量(mm), n为对应时段内降雨次数, 100为换算系数.
2 结果与分析 2.1 监测点降雨量、湿沉降与混合沉降活性氮各组分浓度月变化 2.1.1 监测点降雨量月变化图 1为2011年3月至2013年2月监测点降雨量月变化.从中可知, 两监测点的降雨季节分布不均, HN点监测期间年平均降雨量1 456.6 mm, 降雨主要集中在4~11月, 约占年均降雨量的77.2%, 两年共收集湿沉降和混合沉降降雨样品各146个.月降雨量最大为375.7 mm(2012年5月), 次大为313.8 mm(2011年6月); 最小为17.8 mm(2011年12月), 次小为19.5 mm(2013年1月). XS点监测期间年平均降雨量1 457.8 mm, 降雨主要集中在3~8月, 约占年均降雨量的72.6%, 两年共收集湿沉降和混合沉降降雨样品各137个.月降雨量最大为338.1 mm(2012年5月), 次大为266.3 mm(2011年6月); 最小为10.5 mm(2013年1月), 次小为14.9 mm(2012年9月).两监测点年均降雨量差距较小, 月均降雨量在降雨不集中的月份差异不明显, 但在高峰期差异显著(图 1).

|
图 1 监测点降雨量月变化 Fig. 1 Monthly variation of precipitation at the two monitoring sites |
监测期HN和XS湿沉降与混合沉降NH4+-N、NO3--N、DON和TN浓度及其变化特征如图 2所示.两监测点降雨中无机氮组分以NH4+-N为主, HN湿沉降与混合沉降NH4+-N月浓度均呈现明显的季节变化差异, 冬季NH4+-N浓度显著高于其它季节[图 2(a)].其中HN湿沉降NH4+-N浓度变化范围为0.30~2.18 mg·L-1, 混合沉降NH4+-N浓度变化范围为0.35~2.18 mg·L-1. XS湿沉降、混合沉降NH4+-N浓度变化范围分别为0.12~2.43 mg·L-1和0.03~2.45 mg·L-1.由表 1可知, HN和XS的湿、混合沉降NH4+-N浓度与降雨量均达到极显著负相关关系.

|
图 2 监测点湿沉降与混合沉降雨水中NH4+-N、NO3--N、DON和总氮浓度月变化 Fig. 2 Monthly variations of concentrations of NH4+-N, NO3--N, DON, and total N in wet-only and bulk depositions at the two sites |
|
|
表 1 降雨量与监测点湿沉降及混合沉降雨水中各形态氮浓度的相关系数1) Table 1 Correlation coefficients between precipitation and concentrations of various nitrogen forms in wet-only deposition and bulk deposition at the two sites |
监测点NO3--N浓度变化趋势与NH4+-N基本同步, 11月至次年3月的NO3--N浓度明显高于其它月份[图 2(b)].监测期间HN湿沉降NO3--N浓度变化范围为0.18~1.68 mg·L-1, 混合沉降NO3--N浓度变化范围为0.21~1.87 mg·L-1. XS湿沉降、混合沉降NO3--N浓度变化范围分别为0.05~2.43 mg·L-1和0.06~2.43 mg·L-1.由表 1可见, 降雨量与两监测点的湿、混合沉降中NO3--N浓度均达到极显著负相关关系.
监测点DON浓度随时间呈单峰形, HN湿沉降与混合沉降的DON浓度的最大值分别为1.27 mg·L-1和1.03 mg·L-1, XS湿沉降与混合沉降的DON浓度的最大值分别为0.74mg·L-1和1.53 mg·L-1[图 2(c)].但两地湿、混合沉降DON浓度与降雨量均无明显相关性.
两监测点TN月浓度极值与NH4+-N、NO3--N浓度极值出现较为一致[图 2(d)].在监测期HN湿沉降TN浓度于2011年11月达到最大值4.21 mg·L-1, 于2011年6月达到最小值0.79 mg·L-1, 混合沉降TN浓度变化范围为0.81~4.12 mg·L-1. XS湿、混合沉降的TN浓度变化范围分别为0.87~4.86 mg·L-1、0.32~4.86 mg·L-1.两地湿、混合沉降TN浓度与降雨量均达到极显著负相关关系, 其Pearson相关系数分别为-0.413**、-0.443**、-0.417**和-0.388**.
2.2 监测点湿沉降与混合沉降活性氮各组分沉降量月变化 2.2.1 HN监测点湿沉降与混合沉降活性氮各组分沉降量月变化由图 3可知, HN监测期内大气湿、混合沉降NH4+-N、NO3--N和TN通量月变化趋势基本同步, 2011年集中在3~6月, 2012年集中在1~5月和10~12月.其中NH4+-N的湿沉降与混合沉降月均沉降量分别为1.08 kg·(hm2·month)-1和1.17 kg·(hm2·month)-1. NO3--N湿、混合沉降月均沉降量分别为0.68 kg·(hm2·month)-1和0.76 kg·(hm2·month)-1, DON月均湿、混合沉降量分别为0.41 kg·(hm2·month)-1和0.48 kg·(hm2·month)-1.湿沉降与混合沉降TN月通量变化范围分别为0.38~5.71 kg·(hm2·month)-1和0.58~5.44 kg·(hm2·month)-1, 年均湿沉降、混合沉降量分别为26.2 kg·(hm2·a)-1、28.9 kg·(hm2·a)-1.湿沉降NH4+-N、NO3--N和DON分别占湿沉降TN的49.7%、31.3%和19.0%.混合沉降NH4+-N、NO3--N和DON分别占混合沉降TN的48.7%、31.6%和19.7%.

|
图 3 监测点湿沉降与混合沉降雨水中NH4+-N、NO3--N、DON和总氮沉降量月变化 Fig. 3 Monthly variations of deposition amounts of NH4+-N, NO3--N, DON, and total N in wet-only and bulk depositions at the two sites |
XS监测期内大气湿、混合沉降NH4+-N、NO3--N和TN通量月变化趋势基本同步, 且与HN监测点的变化趋势较为一致.沉降主要集中在2011年3~6月和2012年1~5月、10~12月.其中XS的NH4+-N湿沉降与混合沉降月均沉降量分别为1.06 kg·(hm2·month)-1和1.15 kg·(hm2·month)-1.湿、混合沉降NO3--N月均沉降量分别为0.68 kg·(hm2·month)-1、0.73 kg·(hm2·month)-1. DON月均湿、混合沉降量分别为0.22 kg·(hm2·month)-1、0.44 kg·(hm2·month)-1. XS湿沉降与混合沉降变化范围分别为0.32~4.36 kg·(hm2·month)-1和0.30~5.47 kg·(hm2·month)-1, 年均湿、混合沉降量为23.6 kg·(hm2·a)-1、27.8 kg·(hm2·a)-1.湿、混合沉降NH4+-N、NO3--N和DON分别占湿、混合沉降TN的53.9%、34.8%、11.4%和49.6%、31.6%、18.9%.
2.2.3 监测点湿沉降与混合沉降活性氮各组分沉降量与降雨量的相关关系监测点湿、混合沉降量与降雨量的相关关系由表 2可知, 两监测点湿沉降与混合沉降各形态氮沉降量与降雨量均呈极显著正相关关系, 降雨量大的月份, 其沉降量也随之增加.监测点湿、混合沉降各形态氮之间的相关关系可见表 3, 监测点NH4+-N与NO3--N湿、混合沉降量的Pearson相关系数均大于0.839**, 达到极显著正相关关系. NH4+-N、NO3--N和DON与TN湿、混合沉降量均达到极显著正相关关系.
|
|
表 2 降雨量与监测点湿沉降及混合沉降各形态氮沉降量的相关系数 Table 2 Correlation coefficients between precipitation and deposition of various nitrogen forms in wet-only deposition and bulk deposition at the two sites |
|
|
表 3 监测点湿沉降及混合沉降中各形态氮沉降量的相关系数 Table 3 Correlation coefficient matrix of deposition of various nitrogen forms for both wet-only deposition and bulk deposition at the two sites |
2.3 混合沉降对湿沉降的估算模拟与比较 2.3.1 HN混合沉降对湿沉降的估算模拟与比较
采样期间, HN大气氮混合沉降NH4+-N、NO3--N、TN浓度对湿沉降浓度的估算模拟见图 4(a)~4(c).各形态氮浓度线性拟合方程式决定系数(R2)均高于0.871.说明农田生态系统混合沉降与湿沉降的N营养盐极显著正相关.混合沉降各形态氮浓度均高于湿沉降.其中可将87.5%的混合沉降NH4+-N浓度视为湿沉降浓度; NO3--N与TN湿沉降占混合沉降的比例则为77.4%和85.3%.

|
图 4 监测点混合沉降与湿沉降雨水中各形态氮浓度的相关性 Fig. 4 Relationship between concentrations of various N forms in wet-only and bulk depositions at the two sites |
XS大气氮混合沉降各形态氮浓度与湿沉降浓度的估算模拟见图 4(d)~4(f).湿沉降NH4+-N、NO3--N、TN浓度分别占混合沉降的85.9%、78.4%和81.9%.其回归方式的R2均大于0.822.
3 讨论本研究结果表明, 亚热带农田和林地氮素湿沉降和混合沉降存在极显著的正线性相关, 可以用氮素混合沉降结果来估算氮素湿沉降的结果.鉴于在野外开展的湿沉降采样, 由于需要接入交流电、易遭受雷击等因素, 往往难以实施或长期连续实施.而混合沉降监测由于不需要交流电, 通常简单易行.氮素混合沉降由于包含部分氮素干沉降, 如用其代替氮素湿沉降会导致对湿沉降的高估[23, 24].本研究结果表明, 用氮素混合沉降替代氮素湿沉降, 将导致农田和林地点氮素湿沉降分别被高估10.3%和17.8%.鉴于此, 建立由混合沉降推算湿沉降的关系式, 可以使得氮素湿沉降监测变得更加简单易行, 也可减少用混合沉降直接代替湿沉降导致的对氮沉降的高估.
本研究在农田点用混合沉降中NH4+-N、NO3--N与TN沉降量估算湿沉降中相应组分的沉降量的系数分别是0.875、0.774和0.853, 在林地点相应的系数分别为0.859、0.784和0.819.两个样点利用混合沉降估算湿沉降的不同活性氮组分沉降量的系数比较接近, 这可能与两个样点氮素湿沉降量比较接近, 以及两个样点气态和气溶胶态活性氮浓度差别不大[25], 以致混合沉降中的干沉降相差不大有关.这也表明, 在湿沉降量和大气活性氮浓度稳定的条件下, 该系数也具有一定的稳定性.收集混合沉降的雨量筒采用不锈钢材质、属惰性材料, 由于气态NH3、NO2和HNO3在惰性介质表面难以沉降或沉降后极易再挥发, 则在雨量筒上产生干沉降的主要是气溶胶中的NH4+-N和NO3--N.根据在2011年3月~2013年2月间在两采样点监测到的颗粒态NH4+-N和NO3--N平均浓度分别为4.34 μg·m-3和1.30 μg·m-3(HN)以及4.53 μg·m-3和1.70 μg·m-3(XS)[22, 25], 颗粒态NH4+-N和NO3--N的平均干沉降速率按0.12 cm·s-1计[26], 初步估算得到HN点混合沉降中干沉降的NH4+-N和NO3--N分别为1.64 kg·(hm2·a)-1和0.49 kg·(hm2·a)-1, XS点相应值为1.71 kg·(hm2·a)-1和0.64 kg·(hm2·a)-1.而根据本研究中混合沉降和湿沉降中NH4+-N及NO3--N的差值, 估算得到HN点混合沉降中的干沉降NH4+-N和NO3--N分别为1.08 kg·(hm2·a)-1和0.96 kg·(hm2·a)-1, XS点相应值为1.08 kg·(hm2·a)-1和0.60 kg·(hm2·a)-1.采用两种方法所估算得到的混合沉降中NH4+-N和NO3--N干沉降比较接近, 说明颗粒态含氮组分(包括NH4+-N、NO3--N和DON)的干沉降可能是混合沉降中干沉降的主要来源.我国北方地区由于大气气溶胶污染较严重, 大气颗粒态NH4+-N和NO3--N浓度较高, 以致于在我国北京东北旺观测到混合沉降的氮素输入量比湿沉降高5.7~8.3 kg·(hm2·a)-1, 氮素湿沉降仅占混合沉降的73%[23, 24]. Shen等[27]在北京东北旺测定的大气颗粒物PM10中的NH4+-N和NO3--N浓度分别为7.1 μg·m-3和4.0 μg·m-3, 初步估算混合沉降中干沉降的NH4+-N和NO3--N分别为2.7 kg·(hm2·a)-1和1.5 kg·(hm2·a)-1.考虑到在我国北方地区空气动力学直径大于10 μm的大气颗粒物污染也比较严重(如降尘等), 大气颗粒物的干沉降在北方地区导致较高的氮素混合沉降与湿沉降差值是可能的.因此, 采用氮素的混合沉降来估算其湿沉降时, 所采用的估算系数可能主要与当地的氮素湿沉降水平以及大气颗粒态氮的污染水平有关.大气颗粒态氮浓度越高, 混合沉降中干沉降输入值较大, 估算系数值较小; 反之, 大气颗粒态氮浓度越低, 混合沉降中干沉降输入值较小, 估算系数值较大并逐渐接近1.
本研究结果表明, 氮素湿、混合沉降以NH4+-N为主, 与前人在亚热带区域报道的结果较为一致[28].本研究中亚热带农田氮素湿、混合沉降量分别为26.2 kg·(hm2·a)-1和28.9 kg·(hm2·a)-1, 林地的相应沉降量分别为23.6 kg·(hm2·a)-1和27.8 kg·(hm2·a)-1.该湿沉降值分别与江西千烟洲农田湿沉降[29][23.2 kg·(hm2·a)-1]和广东鼎湖区烂柯山湿沉降[18] [38.2 kg·(hm2·a)-1]比较接近, 表明当前我国亚热带具有较高的大气氮沉降输入.对于农田生态系统, 较高的氮沉降输入是一种重要的养分资源, 需要在氮素养分管理中加以考虑, 以减少农田氮素施用.对于森林生态系统, 以往研究表明森林氮沉降临界负荷在10~20 kg·(hm2·a)-1之间[30, 31], 本研究中亚热带林地仅氮素湿沉降就已超过氮沉降临界负荷值, 氮沉降对林地生态系统的影响不容忽视.本研究结果也表明, 每月的氮素湿沉降量与降雨量呈极显著正相关.这表明在亚热带地区大气中活性氮污染物普遍存在, 降雨产生的湿沉降是大气活性氮的重要清除方式.因此, 要减少亚热带地区的大气氮素湿沉降, 十分有必要减少亚热带地区的大气活性氮排放.而本研究及亚热带区域的其他研究也表明, 农业源铵氮对湿沉降氮素的贡献要高于工业及交通源硝氮对湿沉降氮素的贡献, 因此, 减少农业源氨排放对减少亚热带地区的氮沉降尤为重要[32].
4 结论(1) 在亚热带区典型农田和林地点进行了两年大气氮素湿沉降和混合沉降监测结果表明, 氮素湿沉降以无机氮形态为主, 占到总沉降量的81.0%~88.9%;湿沉降的无机氮以NH4+-N为主, NH4+-N/NO3--N比值为1.55~1.59, 降雨量与雨水中NH4+-N、NO3--N和TN浓度均存在显著负相关关系, 而与沉降量有显著正相关性.
(2) 两监测点湿沉降与混合沉降的雨水中N素浓度具有极显著线性相关性, 根据二者之间建立的回归方程, 农田点采用混合沉降估算湿沉降中NH4+-N、NO3--N和TN沉降的系数值分别为0.875、0.774和0.852;林地点相应的系数值分别为0.859、0.783和0.819, 该系数值主要与监测点的氮素湿沉降量及大气颗粒态氮的污染水平有关.亚热带区域采用大气氮素混合沉降替代氮素湿沉降, 将导致氮素湿沉降被高估10%~18%.
| [1] | Liu X J, Zhang Y, Han W X, et al. Enhanced nitrogen deposition over China[J]. Nature, 2013, 494(7438): 459-462. DOI:10.1038/nature11917 |
| [2] | Galloway J N, Dentener F J, Capone D G, et al. Nitrogen cycles:past, present, and future[J]. Biogeochemistry, 2004, 70(2): 153-226. DOI:10.1007/s10533-004-0370-0 |
| [3] | Vitousek P M, Aber J D, Howarth R W, et al. Human alteration of the global nitrogen cycle:Sources and consequences[J]. Ecological Applications, 1997, 7(3): 737-750. |
| [4] | Lee J A, Caporn S J M. Ecological effects of atmospheric reactive nitrogen deposition on semi-natural terrestrial ecosystems[J]. The New Phytologist, 2010, 139(1): 127-134. |
| [5] | Bouwman A F, Lee D S, Asman W A H, et al. A global high-resolution emission inventory for ammonia[J]. Global Biogeochemical Cycles, 1997, 11(4): 561-587. DOI:10.1029/97GB02266 |
| [6] | Holland E A, Dentener F J, Braswell B H, et al. Contemporary and pre-industrial global reactive nitrogen budgets[J]. Biogeochemistry, 1999, 46(1-3): 7-43. DOI:10.1007/BF01007572 |
| [7] | Lu C Q, Tian H Q. Half-century nitrogen deposition increase across China:a gridded time-series data set for regional environmental assessments[J]. Atmospheric Environment, 2014, 97: 68-74. DOI:10.1016/j.atmosenv.2014.07.061 |
| [8] |
顾峰雪, 黄玫, 张远东, 等. 1961-2010年中国区域氮沉降时空格局模拟研究[J]. 生态学报, 2016, 36(12): 3591-3600. Gu F X, Huang M, Zhang Y D, et al. Modeling the temporal-spatial patterns of atmospheric nitrogen deposition in China during 1961-2010[J]. Acta Ecologica Sinica, 2016, 36(12): 3591-3600. |
| [9] | Liu X J, Duan L, Mo J M, et al. Nitrogen deposition and its ecological impact in China:an overview[J]. Environmental Pollution, 2011, 159(10): 2251-2264. DOI:10.1016/j.envpol.2010.08.002 |
| [10] | Galloway J N, Aber J D, Erisman J W, et al. The nitrogen cascade[J]. Bioscience, 2003, 53(4): 341-356. DOI:10.1641/0006-3568(2003)053[0341:TNC]2.0.CO;2 |
| [11] | Sirois A, Barrie L A. An estimate of the importance of dry deposition as a pathway of acidic substances from the atmosphere to the biosphere in eastern Canada[J]. Tellus B, 1988, 40(1): 59-80. DOI:10.3402/tellusb.v40i1.15630 |
| [12] | Fan J L, Hu Z Y, Wang T J, et al. Atmospheric inorganic nitrogen deposition to a typical red soil forestland in southeastern China[J]. Environmental Monitoring and Assessment, 2009, 159(1-4): 241-253. DOI:10.1007/s10661-008-0626-6 |
| [13] | Zhang W, Mo J M, Zhou G Y, et al. Methane uptake responses to nitrogen deposition in three tropical forests in southern China[J]. Journal of Geophysical Research:Atmospheres, 2008, 113(D11): D11116. DOI:10.1029/2007JD009195 |
| [14] | Lu C Q, Tian H Q, Liu M L, et al. Effect of nitrogen deposition on China's terrestrial carbon uptake in the context of multifactor environmental changes[J]. Ecological Applications, 2012, 22(1): 53-75. DOI:10.1890/10-1685.1 |
| [15] | Kuang F H, Liu X J, Zhu B, et al. Wet and dry nitrogen deposition in the central Sichuan Basin of China[J]. Atmospheric Environment, 2016, 143: 39-50. DOI:10.1016/j.atmosenv.2016.08.032 |
| [16] |
郑祥洲, 张玉树, 丁洪, 等. 闽西北农田生态系统中大气氮湿沉降研究[J]. 水土保持学报, 2012, 26(3): 127-130, 204. Zheng X Z, Zhang Y S, Ding H, et al. Nitrogen wet-deposition in agro-ecosystem of Northwestern Fujian province[J]. Journal of Soil and Water Conservation, 2012, 26(3): 127-130, 204. |
| [17] |
孙素琪, 王云琦, 王玉杰, 等. 缙云山大气氮湿沉降组成及其变化特征[J]. 北京林业大学学报, 2013, 35(4): 47-54. Sun S Q, Wang Y Q, Wang Y J, et al. Composition and temporal variation of atmospheric nitrogen wet deposition in Jinyun Mountain, southwestern China[J]. Journal of Beijing Forestry University, 2013, 35(4): 47-54. |
| [18] | Fang Y, Muneoki Y, Keisuke K, et al. Nitrogen deposition and forest nitrogen cycling along an urban-rural transect in southern China[J]. Global Change Biology, 2011, 17(2): 872-885. DOI:10.1111/gcb.2010.17.issue-2 |
| [19] |
林兰稳, 肖辉林, 刘婷琳, 等. 广州东北郊大气氮湿沉降动态及其与酸雨的关系[J]. 生态环境学报, 2013, 22(2): 293-297. Lin L W, Xiao H L, Liu T L, et al. Dynamics of wet atmospheric nitrogen deposition and the relation to acid rain in the northeast suburb of Guangzhou[J]. Ecology and Environment Sciences, 2013, 22(2): 293-297. |
| [20] |
王金杰, 张克荣, 吴川, 等. 汉江上游金水河流域氮湿沉降[J]. 环境科学, 2014, 35(1): 66-72. Wang J J, Zhang K R, Wu C, et al. Wet deposition of atmospheric nitrogen of the Jinshui watershed in the upper Hanjiang river[J]. Environmental Science, 2014, 35(1): 66-72. |
| [21] |
尹兴, 张丽娟, 刘学军, 等. 河北平原城市近郊农田大气氮沉降特征[J]. 中国农业科学, 2017, 50(4): 698-710. Yin X, Zhang L J, Liu X J, et al. Nitrogen deposition in suburban croplands of Hebei plain[J]. Scientia Agricultura Sinica, 2017, 50(4): 698-710. DOI:10.3864/j.issn.0578-1752.2017.04.010 |
| [22] | Shen J L, Li Y, Liu X J, et al. Atmospheric dry and wet nitrogen deposition on three contrasting land use types of an agricultural catchment in subtropical central China[J]. Atmospheric Environment, 2013, 67: 415-424. DOI:10.1016/j.atmosenv.2012.10.068 |
| [23] | Liu X J, Ju X T, Zhang Y, et al. Nitrogen deposition in agroecosystems in the Beijing area[J]. Agriculture, Ecosystems & Environment, 2006, 113(1-4): 370-377. |
| [24] |
张颖, 刘学军, 张福锁, 等. 华北平原大气氮素沉降的时空变异[J]. 生态学报, 2006, 26(6): 1633-1699. Zhang Y, Liu X J, Zhang F S, et al. Spatial and temporal variation of atmospheric nitrogen deposition in North China Plain[J]. Acta Ecologica Sinica, 2006, 26(6): 1633-1699. |
| [25] | Shen J L, Liu J Y, Li Y, et al. Contribution of atmospheric nitrogen deposition to diffuse pollution in a typical hilly red soil catchment in southern China[J]. Journal of Environmental Sciences, 2014, 26(9): 1797-1805. DOI:10.1016/j.jes.2014.06.026 |
| [26] | Flechard C R, Nemitz E, Smith R I, et al. Dry deposition of reactive nitrogen to European ecosystems:a comparison of inferential models across the NitroEurope network[J]. Atmospheric Chemistry and Physics, 2011, 11(6): 2703-2728. DOI:10.5194/acp-11-2703-2011 |
| [27] | Shen J L, Tang A H, Liu X J, et al. High concentrations and dry deposition of reactive nitrogen species at two sites in the North China Plain[J]. Environmental Pollution, 2009, 157(11): 3106-3113. DOI:10.1016/j.envpol.2009.05.016 |
| [28] |
王杰飞, 朱潇, 沈健林, 等. 亚热带稻区大气氨/铵态氮污染特征及干湿沉降[J]. 环境科学, 2017, 38(6): 2264-2272. Wang J F, Zhu X, Shen J L, et al. Atmospheric ammonia/ammonium-nitrogen concentrations and wet and dry deposition rates in a double rice region in subtropical China[J]. Environmental Science, 2017, 38(6): 2264-2272. |
| [29] |
郝卓, 高扬, 张进忠, 等. 南方红壤区氮湿沉降特征及其对流域氮输出的影响[J]. 环境科学, 2015, 36(5): 1630-1638. Hao Z, Gao Y, Zhang J Z, et al. Characteristics of atmospheric nitrogen wet deposition and associated impact on n transport in the watershed of red soil area in southern China[J]. Environmental Science, 2015, 36(5): 1630-1638. |
| [30] |
肖辉林. 大气氮沉降与森林生态系统的氮动态[J]. 生态学报, 1996, 16(1): 90-99. Xiao H L. Atmospheric nitrogen deposition and nitrogen dynamics of forest ecosystems[J]. Acta Ecologica Sinica, 1996, 16(1): 90-99. |
| [31] |
叶雪梅, 郝吉明, 段雷, 等. 中国主要湖泊营养氮沉降临界负荷的研究[J]. 环境污染与防治, 2002, 24(1): 54-58. Ye X M, Hao J M, Duan L, et al. On critical loads of nutrient nitrogen deposition for some major lakes in China[J]. Environmental Pollution and Control, 2002, 24(1): 54-58. |
| [32] |
许稳, 金鑫, 罗少辉, 等. 西宁近郊大气氮干湿沉降研究[J]. 环境科学, 2017, 38(4): 1279-1288. Xu W, Jin X, Luo S H, et al. Dry and bulk nitrogen deposition in suburbs of Xining city[J]. Environmental Science, 2017, 38(4): 1279-1288. |