 2017, Vol. 38


近年来, 由于社会经济的快速发展, 将大量的二氧化硫(SO2)、氮氧化物(NOx)和汞(Hg)排放入大气.这些大气污染物具有共同的主要人为排放源, 包括燃煤电厂、工业锅炉、工业窑炉、金属冶炼和民用炉灶等[1, 2].进入大气中的硫、氮和汞生成各种形态, 随降水或以气体/颗粒物的形式沉降到陆生或者水生生态系统中(分别称为湿沉降和干沉降), 从而可能带来一系列的环境问题.过高的硫和氮沉降统称酸沉降(俗称酸雨, 我国南方存在大面积的酸雨分布区), 会造成土壤和水体酸化与富营养化、森林生产力下降和生物多样性减少等问题[3~5].而大气中的汞(以气态单质汞GEM、活性气态汞RGM和颗粒态汞PBM这3种形式存在, 主要是GEM)沉降到土壤和水体中后, 部分无机汞会转化为甲基汞, 可能经食物链富集, 危害极大[6].
湿沉降可以利用降水采样器进行长期观测.相比湿沉降, 干沉降的测定通常较为困难, 目前常用的方法有微气象法、浓度梯度法、涡度相关法和穿透水法等[7~9].其中, 穿透水法特别适合于对森林地区进行观测.降水在通过森林冠层的过程中会对叶面上积累的干沉降进行淋洗, 从而引起降水中化学组分的改变, 表现在穿透水中各组分的沉降量高于降水中的沉降量, 因此穿透水通量与湿沉降量之差, 可作为干沉降量的估算值[10~12].此方法操作简单, 应用广泛, 但由于忽略了树干茎流通量以及树冠的交换作用, 估算值存在一定的不确定性.冠层收支模型(canopy budget model)对用穿透水法估算干沉降量进行了进一步的补充[13, 14], 但模型假设目前仍存诸多争议.
由于酸沉降是我国长期面临的严重的环境问题, 因此国内对酸沉降的观测较多, 其中还包括一些长达多年的持续观测[15~17].近年来, 由于对大气汞污染问题的逐渐关注, 有关汞沉降的观测也在一些地区开展[18~21].不过, 大多数的观测只针对湿沉降(于是无法获得总沉降), 而且将酸沉降和汞沉降结合起来进行观测国内外尚未见报道.本研究拟在我国南方两个典型亚热带森林中进行湿沉降和总沉降的观测, 以获得该地区的硫、氮和汞的沉降特征及其相关性, 以期为相关元素的生物地球化学循环研究以及大气污染控制决策提供参考.
1 材料与方法 1.1 试验地概况本研究以江西千烟洲森林生态站和湖南会同杉木林生态站作为采样点, 两站的基本信息如表 1所示.两个站点均为亚热带湿润季风气候, 植被均为亚热带典型的森林类型.千烟洲生态站周边方圆30 km内无燃煤电厂、有色冶金厂和水泥厂等大型人为SO2、NOx和Hg的排放源, 因此可看作一个区域背景点.而会同生态站周边虽然也无大型人为排放源, 但是与万山汞矿(中国曾经最大的汞矿, 现已停产)直线距离仅100 km左右, 因此可能受到自然源汞排放的影响较大. 2014年会同站的林冠上方气态元素汞(GEM)的年均浓度高于千烟洲站(表 1), 说明会同站处于大气汞污染相对较重的地区.
1.2 样品采集与分析在千烟洲生态站的林区内随机布设6个林冠穿透水(canopy throughfall, CTF)采样器, 另外在林地外的空旷地随机布设6个混合降水(bulk precipitation, BP)采样器.这两种采样器完全相同, 均是由倒立的剪去瓶底的PET瓶(内径为9.3 cm, 用尼龙网盖住瓶底, 以防止枯落物掉入)和正立的teflon材质的样品瓶(用锡箔纸包裹, 避光以防止水分蒸发和成分挥发)连接而成, 采样器竖直固定在距地面1 m的高度.将降水采样器和混合降水采样器均随机分为两组, 每组各3个, 一组取样用于分析可溶性汞含量, 每次采样前需在样品瓶中预先加入10 mL盐酸(6 mol·L-1)以减少汞的吸附和挥发损失[25]; 另一组取样用于分析SO42-、NO3-和NH4+离子含量, 不作加酸处理.在会同生态站同样布设了6个CTF采样器, 但是只布设3个BP采样器(只进行汞的分析).
|
|
表 1 千烟洲站和会同站的基本信息 Table 1 Basic information for monitoring sites |
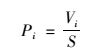
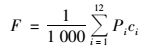
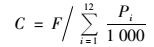
自2013年12月起至2014年11月, 在两站点开展了为期一年的水样采集, 采样频率为每周一次.将来自同一采样器的每四周的水样进行混合, 作为当月的水样, 并记录总水量.每个月的水样需通过孔径为0.45 μm的滤膜后再进行化学分析(表 2), 3个采样器的结果取平均值. NO3-N与NH4+-N之和作为氮含量, SO42--S作为硫含量.沉降量计算如下:
|
|
表 2 水样的分析指标、分析方法及标准样品 Table 2 Analysis indicators, methods, and standard samples for precipitation samples |
|
(1) |
|
(2) |
|
(3) |
|
(4) |
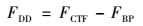
式中, P为降水量或穿透水量(单位:mm); V为每个样品的水量(L); S为采样器的横截面积(m2); F为年沉降通量[硫和氮沉降量g·(m2·a)-1; 汞沉降量μg·(m2·a)-1]; c和C分别为月浓度和年均浓度(阴阳离子:mg·L-1; 汞:ng·L-1); 下标i为月份; 下标DD、CTF和BP分别表示干沉降、穿透水沉降(代表总沉降)和混合降水沉降(代表湿沉降); 1 000为单位换算系数.基于月均浓度, 用Pearson系数反映硫、氮和汞沉降量相互之间以及各自同降水量(或穿透水量)之间的相关性(利用SPSS软件).
2 结果与分析 2.1 硫、氮和汞的浓度千烟洲站和会同站降水和穿透水中的S、N和Hg浓度以及水量的月变化情况如图 1所示, 根据水量计算各组分的体积加权年均浓度, 结果见图 2.观测期间, 千烟洲站降水中的SO42--S、NO3--N、NH4+-N和Hg的年均浓度分别为1.89 mg·L-1、0.957 mg·L-1、0.401 mg·L-1和12.5 ng·L-1. S和N浓度均在6月达到最大值(4.11 mg·L-1和2.88 mg·L-1), 11月最小(0.066 7 mg·L-1和0.304 mg·L-1).其中, NO3--N月均浓度范围在0.123~2.45 mg·L-1之间, 最低浓度出现在3月, 6月浓度最高; NH4+-N在4月达到最高浓度0.672 mg·L-1, 11月最低, 仅为0.078 mg·L-1. Hg月均浓度的变化范围为1.50~34.6 ng·L-1, 其中最低浓度出现在2月, 最高浓度出现在10月.另外, 会同站降水中Hg的年均浓度为8.62 ng·L-1, 月均浓度变化范围为3.26~29.4 ng·L-1, 12月浓度最高, 8月最低.

|
误差线表示标准差, 样本数为3, 即采样器数 图 1 两个站点降水和穿透水中硫、氮和汞浓度以及水量的月变化 Fig. 1 Monthly average precipitation amounts and concentrations of sulfur, nitrogen, and mercury in rainfall and throughfall at the two sites |

|
误差线表示标准差, 样本数为12, 即全年月数 图 2 两个站点降水(BP)和穿透水(CTF)中硫、氮和汞的年均浓度 Fig. 2 Annual average concentrations of sulfur, nitrogen and mercury in rainfall and throughfall at the two sites |
千烟洲站全年穿透水量为1 378 mm, 略低于降水量(1 467 mm), 两者的月变化趋势相似.千烟洲站穿透水中的SO42--S、NO3--N、NH4+-N和Hg的体积加权平均浓度分别为2.39 mg·L-1、1.18 mg·L-1、0.897 mg·L-1和22.2 ng·L-1; 会同站穿透水中的平均浓度则分别为2.93 mg·L-1、1.60 mg·L-1、0.502 mg·L-1和22.0 ng·L-1.两站穿透水中各组分浓度均高于降水.两站穿透水中N和Hg的浓度都十分接近, 但S的浓度则差别较大, 会同站比千烟洲站高22.6%.与降水中各组分浓度的月变化趋势相似, 千烟洲站6~7月穿透水中S和N浓度显著高于其他月份, 春秋两季则较低; Hg浓度的最低值和最高值分别出现在4月和10月.会同站全年穿透水中S和N浓度在1月最高, 而秋季含量最低, 平均浓度不足年均浓度的1/2; Hg浓度11月最低, 12月最高, 冬季Hg浓度是夏季的3.52倍.
千烟洲站和会同站穿透水中S、N和Hg浓度及穿透水量的相关性如表 3所示.两个站点的SO42--S均与NO3--N浓度显著正相关(P<0.01).会同站NH4+-N分别与SO42--S和NO3--N也显著相关(P<0.05).此外, 千烟洲站Hg浓度和水量显著负相关(P<0.01).两站Hg浓度与S、N浓度之间以及S、N浓度与N水量之间均无显著相关性.
|
|
表 3 穿透水中硫、氮和汞浓度及穿透水量之间的相关系数1) Table 3 Correlation coefficients between concentrations of sulfur, nitrogen and mercury in throughfall and throughfall volume |
2.2 硫、氮和汞的沉降量
图 3所示为千烟洲站和会同站S、N和Hg沉降通量的季节变化.基于穿透水的千烟洲站大气S、N和Hg的沉降量分别为3.56g·(m2·a)-1、3.02g·(m2·a)-1和30.6 μg·(m2·a)-1, 会同站分别为6.18 g·(m2·a)-1、4.48g·(m2·a)-1和37.3 μg·(m2·a)-1.整体看来, 会同站各研究组分的沉降量均高于千烟洲站.将总沉降通量与湿沉降通量作差, 得到干沉降量, 发现S和N的湿沉降量明显高于干沉降量, 而Hg的干湿沉降量基本持平.千烟洲站S和N的干沉降量分别占总沉降量的22.0%和34.1%, 其中两种不同形态的氮(NO3--N和NH4+-N)对N干沉降量的贡献比例分别为25.7%和74.3%.千烟洲站全年Hg的干沉降比例为39.9%, 其中冬夏两季干沉降比例较高; 会同站Hg全年干沉降量占总沉降量的比例为58.2%, 秋季干沉降量远高于湿沉降量, 夏季干沉降量也与湿沉降量相当.

|
图 3 两个站点硫、氮和汞沉降通量的季节变化 Fig. 3 Seasonal variations of sulfur, nitrogen and mercury deposition fluxes at the two sites |
两站S、N和Hg的总沉降量表现出相似的季节变化, 均在夏季达到最高, 平均为年沉降量的2.12、2.11和1.67倍.千烟洲站Hg沉降量的季节变化趋势与S和N基本一致, 在秋季达到最低; 会同站S和N沉降量在秋冬季较低, 而Hg的秋季沉降量仅低于夏季.
3 讨论 3.1 干沉降的贡献本研究用混合降水(bulk precipitation, BP)代表湿沉降, 严格来讲与真实的湿沉降(wet-only deposition, WO)存在一定的差异, 或者说在一定程度上高估了湿沉降, 原因是包含了部分气态和颗粒态的干沉降[17].相应地, 公式(4)中穿透水沉降(CTF)和BP的差值只能表示林冠捕获的干沉降, 因此S和N的干沉降可能均被低估.迄今为止国内对上述方法不确定性的评估很少, 根据中国-挪威合作项目“中国陆地生态系统酸化的综合观测计划”(IMPACTS)在2001~2004年间对重庆铁山坪的WO、BP和CTF沉降的观测结果, S和N的BP分别比WO高34%和29%, 同时S和N的CTF分别比WO高3.53倍和75%(未发表数据).如果认为CTF和WO之差为总的干沉降(DD), 则BP和WO之差所代表的DD部分只占总DD的10%(S)和39%(N).目前尚无有关Hg沉降的不确定性结果.
尽管存在低估, 千烟洲站S、N和Hg的干沉降量在总沉降量中的比例分别达到22.0%、34.1%和39.9%, 而会同站Hg的干沉降量比例接近60%.
利用LRT模型对1995年我国S沉降量的模拟结果表明, 干沉降量的平均占比为55.6%[26]; 程念亮等利用CAMx空气质量模型模拟分析2013年中国大陆地区S沉降分布, 结果显示S的干沉降量占总沉降量的38%左右[27]. S的干沉降量比例的下降与我国SO2排放控制实现环境空气SO2浓度显著下降密切相关.国外S总沉降量整体较低, 但干沉降量比例接近一半; 千烟洲站的S干沉降量比例明显低于国外, 也低于我国重庆和贵州等地的监测结果, 略高于湖南蔡家塘(表 4).总体来讲, 背景地区S和N的湿沉降量对总沉降量的贡献可能更高, 或者说污染较严重地区的干沉降比例通常较高.
|
|
表 4 国内外部分地区硫、氮和汞沉降量研究结果比较1) Table 4 Comparison of sulfur, nitrogen and mercury deposition fluxes at different sites |
2010年全国N沉降模拟结果表明干沉降量占总沉降量的60%左右[28], 即N的干沉降量高于湿沉降.但是, 观测结果(特别是用穿透水法)得到的N干沉降比例普遍较小(表 4), 2010~2014年全国43个站点实测结果显示干沉降比例为51.6%[29].重庆铁山坪马尾松林内用穿透水法估算的干沉降量仅为用沉降速率法得到结果的一半[11]; 内蒙古太仆寺旗草原的穿透水沉降仅为用CMAQ模型计算总沉降的55%左右, 用穿透水法观测和用模型计算的干沉降量比例分别为20.6%和56.2%[30].这些差异说明穿透水法可能存在由于叶面对N的吸收而导致的N干沉降低估问题, 即N作为植物生长的必需元素, 部分在降水通过森林冠层时被植物叶片和一些微生物所吸收(以NH4+-N为主)[11, 31].
用GEOS-Chem模型模拟中国大陆地区的Hg沉降量分布, 发现Hg干沉降量的平均比例为56.9%[32].本研究中所测两站的Hg的干湿沉降量之比平均为1.03, 即干湿沉降贡献相当.国内外对于Hg沉降量的一些观测结果显示干沉降量比例在40.8%~70.6%之间(表 4), 本研究结果在此范围之内.
3.2 沉降的来源与相关性沉降中各组分之间的相关性会在一定程度上反映其来源的一致性.相关性分析结果显示, SO42--S与NO3--N含量显著相关(P<0.01), 说明区域SO2和NOx的来源相似, 燃煤(包括周边的民用燃煤, 以及区域电厂贡献)同时排放大量的SO2和NOx, 可能是硫和氮沉降的重要来源.而NH4+-N主要来自于农业, 因此SO42--S与NH4+-N含量相关性低甚至不相关.人为活动和自然过程都会向大气释放Hg, 我国人为源Hg排放量约为500~700 t·a-1[2], 而Shetty等利用模型估算我国自然源Hg排放量约为462 t·a-1[40], 因此自然源Hg排放同样值得关注.千烟洲站和会同站的Hg浓度与S、N浓度之间并无显著相关性(P>0.05), 这表明自然源对Hg沉降的贡献比较重要.特别是, 万山汞矿位于会同站西北方向不足100 km处, 矿区土壤的Hg背景值较高, 富Hg土壤会向大气中释放大量Hg, 而我国秋冬季盛行西北风, 这些Hg随大气传输至此, 会同站秋冬季对全年Hg沉降量的贡献相对于S和N沉降显著提升(相比而言, 千烟洲站Hg沉降的季节分布同S和N沉降类似; 图 3).
4 结论(1) 观测期间, 基于穿透水的千烟洲站大气硫、氮和汞的沉降量分别为3.30g·(m2·a)-1、3.02g·(m2·a)-1和30.6 μg·(m2·a)-1, 会同站分别为6.18 g·(m2·a)-1、4.48g·(m2·a)-1和37.3 μg·(m2·a)-1, 三者均在夏季达到峰值.会同站各研究组分的沉降量均高于千烟洲站, 因此会同较千烟洲地区酸沉降和汞污染严重.
(2) 两个站点的硫和氮的湿沉降量在总沉降量中均占主导地位, 而汞的干湿沉降量贡献基本持平.对这两个站点来说, 硫和氮沉降的来源相似, 主要来自燃煤等人为源, 而汞的自然源贡献更为显著, 特别是万山汞矿土壤的汞排放对于会同站的汞沉降影响较大.
| [1] | Zhao B, Wang S X, Wang J D, et al. Impact of national NOX and SO2 control policies on particulate matter pollution in China[J]. Atmospheric Environment, 2013, 77: 453-463. DOI:10.1016/j.atmosenv.2013.05.012 |
| [2] | Zhang L, Wang S X, Wang L, et al. Updated emission inventories for speciated atmospheric mercury from anthropogenic sources in China[J]. Environmental Science & Technology, 2015, 49(5): 3185-3194. |
| [3] | Aber J D, Nadelhoffer K J, Steudler P, et al. Nitrogen saturation in northern forest ecosystems:excess nitrogen from fossil fuel combustion may stress the biosphere[J]. BioScience, 1989, 39(6): 378-386. DOI:10.2307/1311067 |
| [4] | Duan L, Yu Q, Zhang Q, et al. Acid deposition in Asia:emissions, deposition, and ecosystem effects[J]. Atmospheric Environment, 2016, 146: 55-69. DOI:10.1016/j.atmosenv.2016.07.018 |
| [5] | Gorham E. Scientific understanding of ecosystem acidification:a historical review[J]. AMBIO, 1989, 18(3): 150-154. |
| [6] | Hua Z, Feng X B, Larssen T, et al. In inland China, rice, rather than fish, is the major pathway for methylmercury exposure[J]. Environmental Health Perspectives, 2010, 118(9): 1183-1188. DOI:10.1289/ehp.1001915 |
| [7] |
樊建凌, 胡正义, 周静, 等. 林地大气氮沉降通量观测对比研究[J]. 中国环境科学, 2013, 33(5): 786-792. Fan J L, Hu Z Y, Zhou J, et al. Comparative study on the observation of atmospheric nitrogen deposition in a forestland[J]. China Environmental Science, 2013, 33(5): 786-792. |
| [8] | Wright L P, Zhang L M, Marsik F J. Overview of mercury dry deposition, litterfall, and throughfall studies[J]. Atmospheric Chemistry and Physics, 2016, 16(21): 13399-13416. DOI:10.5194/acp-16-13399-2016 |
| [9] | Erisman J W, Draaijers G. Deposition to forests in Europe:most important factors influencing dry deposition and models used for generalisation[J]. Environmental Pollution, 2003, 124(3): 379-388. DOI:10.1016/S0269-7491(03)00049-6 |
| [10] | Draaijers G P J, Erisman J W, Spranger T, et al. The application of throughfall measurements for atmospheric deposition monitoring[J]. Atmospheric Environment, 1996, 30(19): 3349-3361. DOI:10.1016/1352-2310(96)00030-1 |
| [11] | 金蕾, 邵敏, 曾立民, 等. 穿透水方法估算主要可溶性无机组分的干沉降通量[J]. 科学通报, 2006, 51(11): 1333-1337. DOI:10.3321/j.issn:0023-074X.2006.11.015 |
| [12] | Kopá Dč ek J, Turek J, Hejzlar J, et al. Canopy leaching of nutrients and metals in a mountain spruce forest[J]. Atmospheric Environment, 2009, 43(34): 5443-5453. DOI:10.1016/j.atmosenv.2009.07.031 |
| [13] | Draaijers G P J, Erisman J W. A canopy budget model to assess atmospheric deposition from throughfall measurements[J]. Water, Air, and Soil Pollution, 1995, 85(4): 2253-2258. DOI:10.1007/BF01186169 |
| [14] | Adriaenssens S, Staelens J, Baeten L, et al. Influence of canopy budget model approaches on atmospheric deposition estimates to forests[J]. Biogeochemistry, 2013, 116(1-3): 215-229. DOI:10.1007/s10533-013-9846-0 |
| [15] |
金蕾, 徐谦, 林安国, 等. 北京市近二十年(1987~2004)湿沉降特征变化趋势分析[J]. 环境科学学报, 2006, 26(7): 1195-1202. Jin L, Xu Q, Lin A G, et al. Trend analysis of wet deposition between 1987~2004 in Beijing City[J]. Acta Scientiae Circumstantiae, 2006, 26(7): 1195-1202. |
| [16] |
余德祥, 马萧萧, 谭炳全, 等. 重庆市铁山坪2001~2010年酸沉降变化[J]. 环境科学, 2014, 35(1): 60-65. Yu D X, Ma X X, Tan B Q, et al. Trend in acid deposition at Tieshanping, Chongqing during 2001-2010[J]. Environmental Science, 2014, 35(1): 60-65. |
| [17] | Aas W, Shao M, Jin L, et al. Air concentrations and wet deposition of major inorganic ions at five non-urban sites in China, 2001-2003[J]. Atmospheric Environment, 2007, 41(8): 1706-1716. DOI:10.1016/j.atmosenv.2006.10.030 |
| [18] | Wan Q, Feng X B, Lu J L, et al. Atmospheric mercury in Changbai Mountain area, northeastern China Ⅱ. The distribution of reactive gaseous mercury and particulate mercury and mercury deposition fluxes[J]. Environmental Research, 2009, 109(6): 721-727. DOI:10.1016/j.envres.2009.05.006 |
| [19] | Fu X W, Feng X B, Zhu W Z, et al. Elevated atmospheric deposition and dynamics of mercury in a remote upland forest of southwestern China[J]. Environmental Pollution, 2010, 158(6): 2324-2333. DOI:10.1016/j.envpol.2010.01.032 |
| [20] | Fu X W, Feng X, Dong Z Q, et al. Atmospheric gaseous elemental mercury (GEM) concentrations and mercury depositions at a high-altitude mountain peak in south China[J]. Atmospheric Chemistry and Physics, 2010, 10(5): 2425-2437. DOI:10.5194/acp-10-2425-2010 |
| [21] | Ming M, Wang D Y, Du H X, et al. Atmospheric mercury deposition and its contribution of the regional atmospheric transport to mercury pollution at a national forest nature reserve, southwest China[J]. Environmental Science and Pollution Research, 2015, 22(24): 20007-20018. DOI:10.1007/s11356-015-5152-9 |
| [22] |
陈永瑞, 林耀明, 李家永, 等. 江西千烟洲试区杉木人工林降雨过程及养分动态研究[J]. 中国生态农业学报, 2004, 12(1): 74-76. Chen Y R, Lin Y M, Li J Y, et al. Rainfall process and nutrient dynamics of artificial Chinese fir plantation in Jiangxi Qianyanzhou experimental station[J]. Chinese Journal of Eco-Agriculture, 2004, 12(1): 74-76. |
| [23] |
伍倩, 闫文德, 赵亮生, 等. 湖南会同杉木人工林林冠截留特征[J]. 生态学报, 2016, 36(13): 4131-4140. Wu Q, Yan W D, Zhao L S, et al. Canopy interception characteristics of Chinese fir plantations in central south China[J]. Acta EcologicaSinica, 2016, 36(13): 4131-4140. |
| [24] |
罗遥. 我国南方典型森林生态系统汞的输入输出与迁移[D]. 北京: 清华大学, 2015. Luo Y. Mercury input, output and transport in forest ecosystems in southern China[D]. Beijing:Tsinghua University, 2015. http://cdmd.cnki.com.cn/Article/CDMD-10003-1016713005.htm |
| [25] | Luo Y, Duan L, Xu G Y, et al. Inhibition of mercury release from forest soil by high atmospheric deposition of Ca2+ and SO42-[J]. Chemosphere, 2015, 134: 113-119. DOI:10.1016/j.chemosphere.2015.03.081 |
| [26] | Hao J M, Duan L, Zhou X L, et al. Application of a LRT model to acid rain control in China[J]. Environmental Science & Technology, 2001, 35(17): 3407-3415. |
| [27] |
程念亮, 易文杰, 张开太, 等. 2013年中国硫沉降数值模拟研究[J]. 环境污染与防治, 2016, 38(4): 38-44, 50. Cheng N L, Yi W J, Zhang K T, et al. Numerical simulation of sulfur deposition in China in 2013[J]. Environmental Pollution & Control, 2016, 38(4): 38-44, 50. |
| [28] |
郑丹楠, 王雪松, 谢绍东, 等. 2010年中国大气氮沉降特征分析[J]. 中国环境科学, 2014, 34(5): 1089-1097. Zheng D N, Wang X S, Xie S D, et al. Simulation of atmospheric nitrogen deposition in China in 2010[J]. China Environmental Science, 2014, 34(5): 1089-1097. |
| [29] | Xu W, Luo X S, Pan Y P, et al. Quantifying atmospheric nitrogen deposition through a nationwide monitoring network across China[J]. Atmospheric Chemistry and Physics, 2015, 15(21): 12345-12360. DOI:10.5194/acp-15-12345-2015 |
| [30] |
张菊, 康荣华, 赵斌, 等. 内蒙古温带草原氮沉降的观测研究[J]. 环境科学, 2013, 34(9): 3552-3556. Zhang J, Kang R H, Zhao B, et al. Monitoring nitrogen deposition on temperate grassland in Inner Mongolia[J]. Environmental Science, 2013, 34(9): 3552-3556. |
| [31] | Fenn M E, Ross C S, Schilling S L, et al. Atmospheric deposition of nitrogen and sulfur and preferential canopy consumption of nitrate in forests of the Pacific Northwest, USA[J]. Forest Ecology & Management, 2013, 302: 240-253. |
| [32] | Wang L, Wang S X, Zhang L, et al. Source apportionment of atmospheric mercury pollution in China using the GEOS-Chem model[J]. Environmental Pollution, 2014, 190: 166-175. DOI:10.1016/j.envpol.2014.03.011 |
| [33] | Zimmermann F, Plessow K, Queck R, et al. Atmospheric N-and S-fluxes to a spruce forest-Comparison of inferential modelling and the throughfall method[J]. Atmospheric Environment, 2006, 40(25): 4782-4796. DOI:10.1016/j.atmosenv.2006.03.056 |
| [34] | Junior R C D O, Keller M M, Ramos J F D F, et al. Chemical analysis of rainfall and throughfall in the Tapajós National Forest, Belterra, Pará, Brazil[J]. Ambiente & Água-An Interdisciplinary Journal of Applied Science, 2015, 10(2): 263-285. |
| [35] | Larssen T, Duan L, Mulder J. Deposition and leaching of sulfur, nitrogen and calcium in four forested catchments in China:implications for acidification[J]. Environmental Science & Technology, 2011, 45(4): 1192-1198. |
| [36] |
肖劲松, 武学丽, 夏园. 贵州省六冲关流域大气沉降和地表水化学特征[J]. 环境科学研究, 2010, 23(5): 539-542. Xiao J S, Wu X L, Xia Y. Chemical characteristics of atmospheric deposition and surface water in Liuchongguancatchment, Guizhou Province[J]. Research of Environmental Sciences, 2010, 23(5): 539-542. |
| [37] |
向仁军, 柴立元, 张龚, 等. 湖南蔡家塘森林小流域氮和硫的输入输出特征[J]. 环境科学学报, 2006, 26(8): 1372-1378. Xiang R J, Chai L Y, Zhang G, et al. Input-output dynamics ofnitrogen and sulfur in Caijiatang forested catchment in Hunan Province[J]. Acta Scientiae Circumstantiae, 2006, 26(8): 1372-1378. |
| [38] | García-Gomez H, Izquieta-Rojano S, Aguillaume L, et al. Atmospheric deposition of inorganic nitrogen in Spanish forests ofQuercusilexmeasured with ion-exchange resins and conventional collectors[J]. Environmental Pollution, 2016, 216: 653-661. DOI:10.1016/j.envpol.2016.06.027 |
| [39] | Kocman D, Vre Dč a P, Fajon V, et al. Atmospheric distribution and deposition of mercury in the Idrija Hg mine region, Slovenia[J]. Environmental Research, 2011, 111(1): 1-9. DOI:10.1016/j.envres.2010.10.012 |
| [40] | Shetty S K, Lin C J, Streets D G, et al. Model estimate of mercury emission from natural sources in East Asia[J]. Atmospheric Environment, 2008, 42(37): 8674-8685. DOI:10.1016/j.atmosenv.2008.08.026 |